Share your thoughts
placeholder
Article
$LETTALL /USDT Perp – "Flatline Chop – Watch"**
**Trading Plan Long $LETTALL
Entry: 16.161
SL: 16.100
TP1: 16.209
TP2: 16.272
LETTALL is flatlined on the EMAs (16.161-16.163) with no momentum. Trade only a breakout above the 16.209 yellow resistance, stopping out below the 16.112 support.
post-image
LETTALL+0.48%
  • 3
  • 2
#USELESSSurgesAnother67%
$USELESS
MOMENTUM IS STILL RUNNING
USELESS has once again become one of the most aggressive momentum stories in the market. After its explosive multi-day rally, the token is now trading around $0.22, following a powerful move that previously pushed price toward the $0.25–$0.28 region. The latest market data shows just how extreme the move has become: USELESS has gained roughly 250%+ over seven days, while 24-hour trading volume has expanded above $200M.
THE BIGGER PICTURE
What makes this setup interesting is that USELESS is not simply experiencing a one-candle pump
Falcon_Official
#USELESSSurgesAnother67%
USELESS is once again proving that small-cap momentum can move extremely fast. Around $0.24, the token has delivered another explosive move of roughly 67%, while the latest market data shows price pushing close to the $0.25 area. The move is especially notable because it follows an already powerful multi-day rally rather than coming after a long period of weakness. Current data also shows roughly $140M+ in 24-hour trading volume, meaning this is not simply a low-liquidity price spike.
From a technical perspective, the chart is extremely bullish but also extremely stretched. The RSI(14) is around 77 on one major technical snapshot, while another calculation has pushed RSI above 90. Either way, the message is similar: momentum is powerful, but buyers are operating in an overbought zone. MACD remains positive and moving averages are aligned bullishly, with the short-term averages sitting well below the current price. This combination confirms that the trend is strong, but it also increases the probability of sharp pullbacks after such a vertical move.
The most important level right now is the $0.25 psychological zone. Price reaching approximately $0.25 means buyers are testing a clean round-number resistance after the huge acceleration. A convincing breakout above $0.25, supported by sustained volume rather than only a quick wick, could open the way toward $0.258 and then the $0.30–$0.31 area. The latter becomes particularly interesting because technical resistance data places a major resistance zone around $0.312.
But there is another side to this chart. After a 67% surge, chasing the candle becomes much riskier than entering during the earlier breakout. The current price is significantly above its short-term averages: the latest technical data places the 5-day SMA near $0.20, the 10-day SMA around $0.19, the 20-day SMA around $0.176, and the 50-day SMA around $0.141. That distance tells us just how aggressively momentum has expanded. Strong trends can remain irrational for longer than expected, but eventually the market often returns to test previous breakout zones.
For me, the key battle is therefore not simply “can USELESS go higher?” but whether $0.20–$0.21 can become a new support zone. If price pulls back and buyers defend this region, it would show that the latest breakout is being accepted rather than completely rejected. Below that, the next meaningful technical area is around $0.176–$0.18, close to the 20-day average. A deeper correction toward the $0.15 area would still leave the broader recent rally intact, but losing that region with heavy selling would weaken the immediate momentum structure. Technical pivot data also identifies approximately $0.1498 as a support level.
The volume picture is equally important. USELESS has recently experienced a dramatic expansion in trading activity alongside its price appreciation. That is generally healthier than a huge move occurring on disappearing liquidity, but high volume can work both ways. If volume continues expanding while price holds above $0.20, it would support the continuation thesis. If volume becomes dominated by sellers around $0.25–$0.26 and price starts producing long upper wicks, that would be an early warning that momentum is becoming exhausted.
So the current setup is bullish trend + extreme momentum + elevated correction risk. The chart does not currently look like a normal slow accumulation; it looks like a momentum phase where candles can move several percentage points very quickly. RSI and ADX are warning that the market is overheated, while MACD and moving averages continue to confirm the underlying bullish trend.
At around $0.24–$0.25, I would watch three zones very closely: $0.25 for breakout confirmation, $0.20–$0.21 for immediate support, and $0.176–$0.18 for deeper trend protection. Above $0.25 with strong volume, $0.258 and then $0.30–$0.31 become the next technical areas to monitor. If $0.20 fails decisively, however, the market could need a cooling-off period before another serious attempt higher.
My technical view: USELESS remains strongly bullish, but after another ~67% surge, the risk/reward is no longer the same as it was at the beginning of the move. The next confirmation matters more than the size of the last candle. **A clean $0.25 breakout could extend the momentum toward $0.30+, while rejection followed by a loss of $0.20 would make a deeper correction increasingly likely.**
@Gate_Square
$USELESS ‌ ‌
repost-content-media
USELESS-6.22%
  • 5
Robinhood Chain is 60 days old and already flipping Base in daily active users.
$791,000,000 in TVL. Two months.
Solana ($SOL )'s narrative just got a new challenger.
SOL-1.32%
Trust is not built by words, but proven through results time and time again.
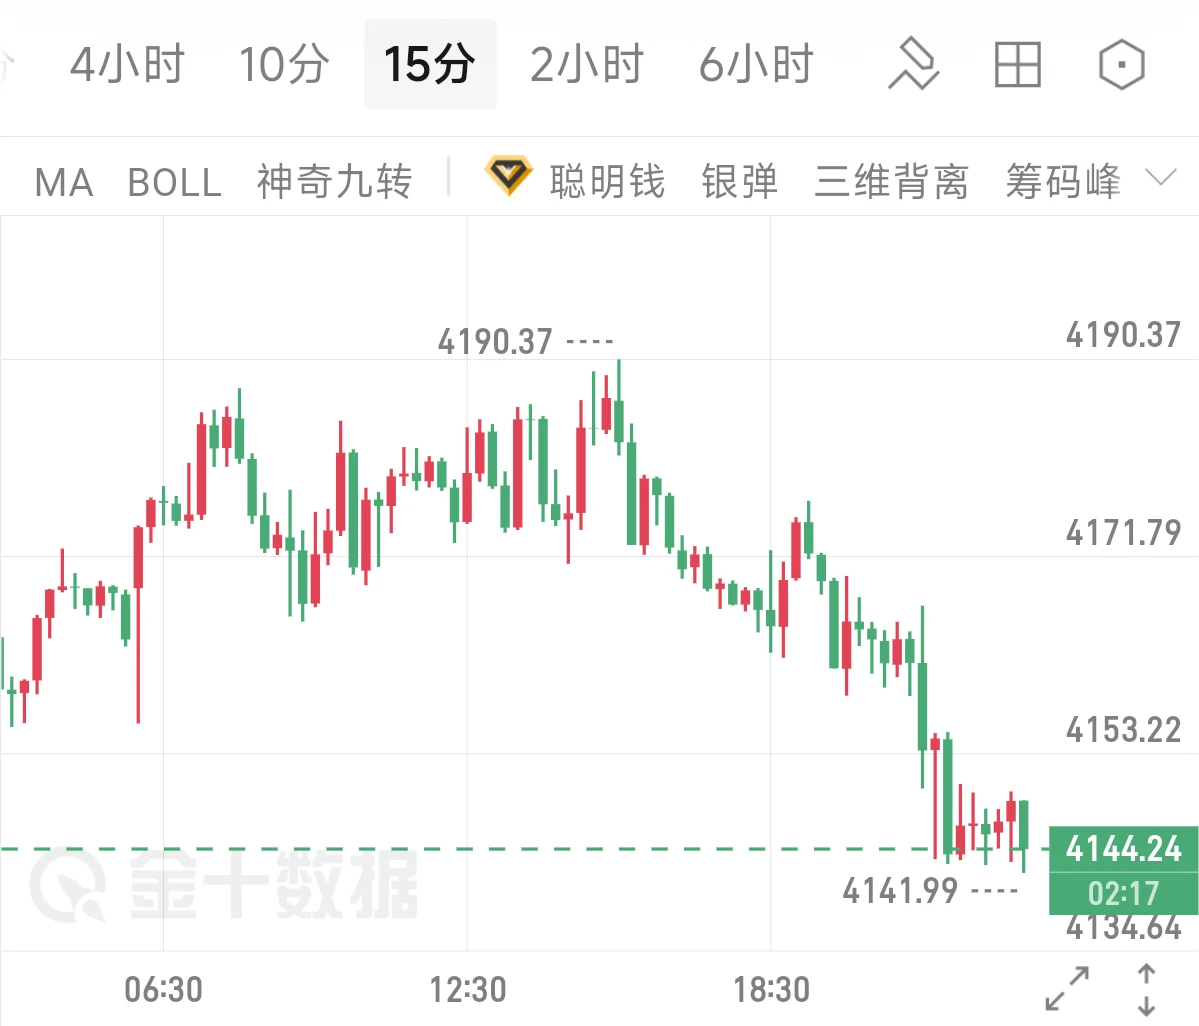
In just one week, we have basically doubled the accounts, reaching $80,000 and $40,000. This requires not only top-tier strategies, but also keeping up with top-tier real-time guidance during the session—neither is dispensable. Next, we will continue to maintain a steady pace.
If you currently have no direction or feel confused, you can contact Bai Ge for real-time guidance. While I cannot promise to turn things around for you overnight, I can give you direction when you are panicking and lend you a hand when you are
XAU-0.79%
#GateTops7DayNetInflowsGlobally
GATE CROSSES $300M IN 7-DAY NET INFLOWS
Gate has recorded approximately $300.43 million in net capital inflows over the past seven days, placing it among the top three globally according to the latest DeFiLlama-based data. The figure is significant because it shows that capital movement toward Gate has remained strong even while the broader crypto market is dealing with elevated volatility and changing macro expectations.
WHAT DOES $300M+ NET INFLOW ACTUALLY MEAN?
Net inflow is not simply the amount of money entering an exchange. It represents the difference b
post-image
Falcon_Official
#GateTops7DayNetInflowsGlobally
Gate is making a strong statement through capital flows. According to DeFiLlama data, Gate recorded approximately $273.72 million in net capital inflows over the past 7 days, placing it among the top three centralized exchanges globally. For an exchange, this is more than just a large number on a dashboard—it shows that a significant amount of capital has moved onto the platform after accounting for outflows.
The important word here is “net.” If users deposit $500 million but withdraw $226 million during the same period, the net inflow is roughly $274 million. That means the headline figure is measuring the difference between money coming in and money leaving, rather than simply counting deposits. This makes a sustained positive seven-day figure a useful indicator for understanding where exchange liquidity is building.
A seven-day window is particularly interesting because it filters out some of the noise that can appear in a single day. One large transfer can make a 24-hour ranking look impressive, but maintaining strong net inflows across an entire week suggests broader activity. Capital may be arriving for spot trading, derivatives, portfolio repositioning, new listings, hedging or simply to keep funds ready for opportunities.
There is another reason this number deserves attention. Exchange inflows should never be interpreted as an automatic bullish signal for the entire crypto market. Coins moving onto an exchange can eventually be used for buying, but they can also be deposited for selling or hedging. The stronger interpretation comes when capital inflows are combined with trading volume, price action, stablecoin liquidity and user activity. In other words, inflow tells us where capital is moving; market behavior tells us what that capital is actually doing.
Gate's broader flow picture also adds context. DeFiLlama data cited by Gate showed approximately $520.45 million of net inflows over the past month, ranking Gate third among centralized exchanges globally. The seven-day figure therefore fits into a larger story of meaningful capital movement rather than appearing as an isolated one-day event.
For traders, this is the part I find most interesting. If strong net inflows continue while trading activity expands, liquidity becomes an increasingly important part of the Gate ecosystem. More available capital can support deeper market participation and provide traders with greater flexibility when volatility creates opportunities. But if inflows rise while prices weaken sharply, the interpretation becomes more complicated because those funds could be positioned for selling or defensive strategies.
The recent data also shows how quickly rankings can change. Another September 3 snapshot from DeFiLlama placed Gate's seven-day net inflow at $78.19 million and ranked it first among global centralized exchanges, highlighting that exchange-flow figures can move rapidly as deposits and withdrawals change. The key takeaway is therefore not to treat one snapshot as permanent, but to watch whether positive capital-flow momentum continues over multiple periods.
For Gate, the $273.72 million seven-day net inflow is still a notable milestone. It puts the exchange firmly on the global capital-flow radar and gives the community another metric to watch beyond simple trading volume. If the next weekly readings remain positive and are accompanied by stronger activity, that would make the trend considerably more meaningful.
Capital follows opportunity, but the smartest signal is not simply seeing money arrive. The real signal is seeing whether that capital stays, participates and contributes to sustained market activity.
@Gate_Square
repost-content-media
BTC-1.44%
  • 5
Bitcoin’s Probability Waves have cooled sharply from deep overvaluation to just 1.96 in only two days.
At $77K, $BTC is now sitting much closer to its short-term average.
The excess has been flushed out quickly, giving Bitcoin a cleaner setup.
post-image
BTC-1.44%
Markets rise and fall, and being stuck is a phase many people go through, but ruminating in place won't bring a solution🍑.
Don't pin your hopes on an accidental market rebound. Recognizing the problem and adjusting your approach is the key to breaking through. Put aside the tension of watching the market this weekend and give yourself some space to think.
It's easy to get stuck in a rut when fighting alone, so I'm looking for🪵 like-minded companions. If you're facing the 🍑trapped-position problem and want to sort through your thoughts together and give each other pointers, come join us$BTC
post-image
BTC-1.44%
ETH-2.23%
Gate is being popular world wide. $TSLA
post-image
TSLA-5.96%
Wait for the next few hours
If $Bulla is going to drop, it’ll likely drop from here.
Be patient in trading, otherwise, you’ll never succeed.
post-image
BULLA+151.59%
Market prediction
live-cover
LIVE2,055
$SHENHUA /USDT Perp – "Flatline Chop – Watch"**
**Trading Plan Long $SHENHUA
Entry: 7.055
SL: 7.000
TP1: 7.096
TP2: 7.150
SHENHUA is flatlined on the Bollinger Bands (7.055) with no volume. Enter only if it breaks the 7.055 high, with a stop below the 7.021 support.
post-image
SHENHUA-0.10%
  • 4
Everyone’s staring at the 1D range—but the 4h clock just started ticking against $ETH /USDT.

$ETH /USDT - SHORT

Trade Plan:
Entry: 2445.80 – 2452.56
SL: 2481.60
TP1: 2424.87
TP2: 2408.66
TP3: 2384.34

Why this setup?
Why now?
- The 4h structure is armed SHORT at 2449.18, not a random guess.
- RSI on the 15m (45.84) shows weak bounce fuel, not momentum.
- ATR (13.5) confirms tight compression—breakouts here sting faster.
- Targets stack down: 2424 → 2408 → 2384, while invalidation sits far at 2461.
- Range day + compressed volatility = sniper window, not a trend day.

Debate:
If
ETH-2.23%
hot Topics
live-cover
LIVE1,194
WAL/USDT — A quiet recovery after a long downtrend
WAL is trading around 0.02619, up 4.22%, with price finally stabilizing after falling from the 0.12531 peak.
The bigger picture is still weak, but the recent structure is different: price has formed a base around 0.02001 and is slowly pushing higher.
Levels on my radar:
• 0.02646 — immediate resistance
• 0.03000 — key breakout area
• 0.04106 — major resistance
• 0.02001 — major support
• 0.02098 — SuperTrend level
MACD is improving and has moved back into positive territory, which supports the recovery idea. But the long-term performance is st
WAL+4.49%
  • 2
$ink is closer than ever
Don't fade $QUOTRONS
Coop's body will explode the day he gets to share TGE details
Quotrons wallets will explode the day the $ink token drops 🔥
@inkonchain
@inkfndhq
@cruelhandeth
post-image
With this trend, I don’t even have to think—the account is dancing on its own. $DGAI kept climbing and hit a new high. Didn’t see that coming.
Just checked the account: entry price 0.6959, current price 0.7818, return +242.65%. The profit pace was timed just right. Don’t ask me how I managed to hold; when the logic is solid enough, your hands won’t shake. This run has been a very comfortable meal of big profits, and the patience earlier wasn’t wasted.
I had my eye on it when it was bottoming out during the session. Volume was expanding while the price wasn’t rising, which clearly showed funds
post-image
DGAI+0.65%
ETH-2.23%
BTC-1.44%
#SNDK
SNDK is currently trading around $1,739.85. After the recent sharp upside move, the stock remains in a strong bullish structure, but the price is now entering a zone where resistance, momentum and profit-taking risk become increasingly important.
MOMENTUM STATUS
The technical picture remains bullish, with RSI(14) around 77, indicating that momentum is strong but already in overbought territory. MACD remains positive, supporting the continuation of the current bullish trend.
Overbought does not automatically mean a reversal is coming. It simply means buyers have pushed price aggressively
SNDK+11.51%
  • 7
  • 1
I only meant to test the waters with a small position, but it ended up being a bit underwhelming? No, it delivered a big one! As it repeatedly oscillated intraday, I watched the order book for ages. Every dip held above support, and the volume-price action was actually getting healthier and healthier. My instincts told me this move had potential. I bought the dip during the daytime pullback at 0.00793, and when I opened the app again after lunch, it had already reached 0.00855, sending the return to +191.86%. My account was dancing on its own—I was worried it might fall.

Made the profit fair
post-image
SNDK+11.51%
ADA-3.97%
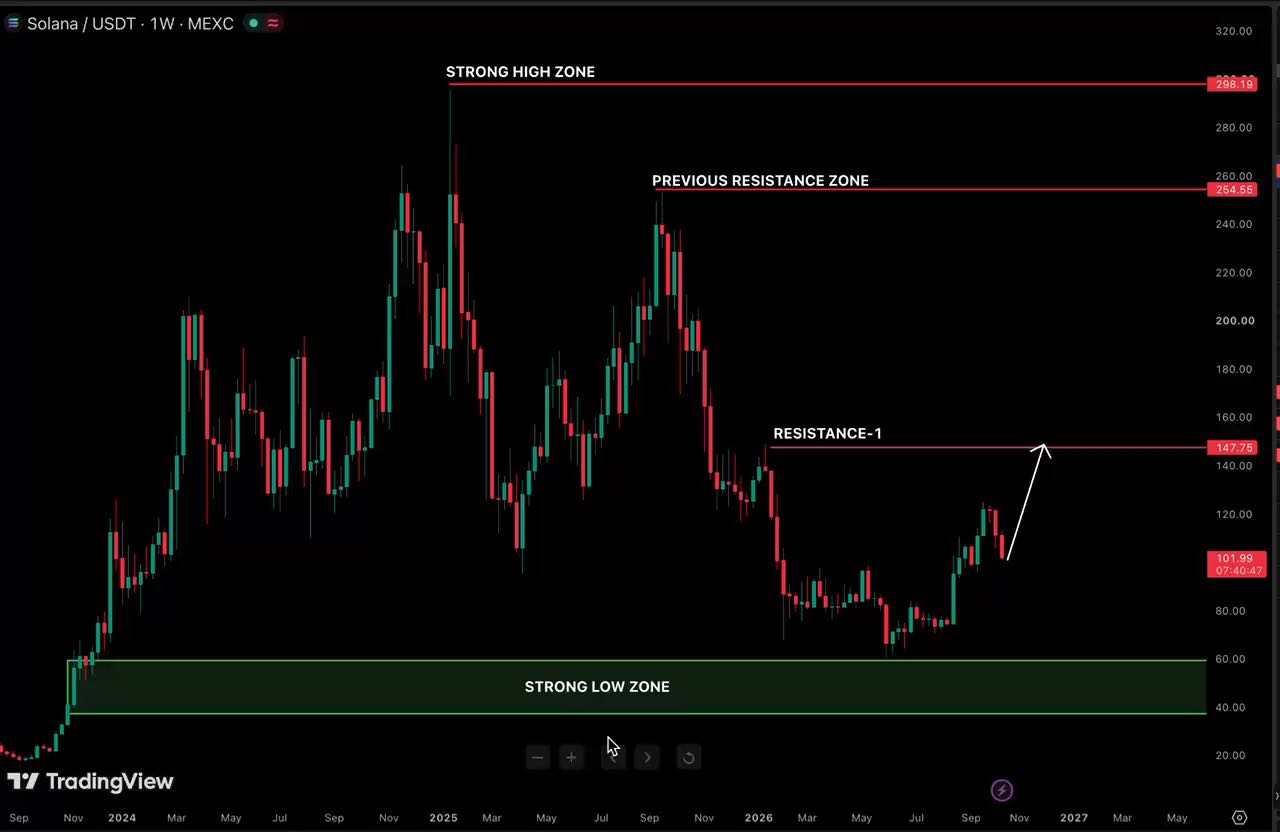
$SOL Signal】4H death cross + order book sell pressure, short attack
$SOL 4H MACD death cross in progress, with the price below and hugging EMA20. Sell pressure dominates the order book, with a depth imbalance of -5.93% and a bid-to-ask ratio of 0.89. The 1H Bollinger Bands are narrowing, volatility is contracting, and a short-term reversal point is approaching.
🎯Direction: short
⚡Entry/limit order: 101.6641 - 101.9700
🛑Stop-loss: 102.9897
🚀Target 1: 100.4404
🚀Target 2: 99.6757
🛡️Trade management: - Reduce the position by 50% upon reaching Target 1 and move the stop-loss up to breakeven.
post-image
SOL-1.29%
BTC-1.44%
ETH-2.28%
All I can say is that flomo has really gone downhill.
Even if they couldn't display it properly, they shouldn't have displayed these characters...
If it wants to make money, it has to keep adding all sorts of messy features to attract attention, so it can no longer remain small and elegant.
For example, the AI feature—I’ve already cut it from the note-taking app I made myself.
Because you can have an Agent like Codex do the analysis, which is much more useful than using this app for analysis.
Putting an Agent inside the app is truly the stupidest approach.
post-image
Load More

Join 40 M users in our growing community

⚡️ Join 40 M users in the crypto craze discussion

💬 Engage with your favorite top creators

👍 See what interests you

View More