✨ Gate Money: One Account for Crypto, Stocks, Gold, and Everyday Spending
🔹 At TOKEN2049 Singapore, Gate Founder and CEO Dr. Lin Han introduced Gate Money, a unified financial application built around the vision "One Gate, Everything Money." The platform consolidates digital assets, fiat currencies, stocks, ETFs, gold, bank accounts, and payments into a single account within the Gate App.
📊 The data behind the platform:
🔹 Asset coverage:
▪️ Over 5,300 crypto assets
▪️ More than 12,800 stocks and ETFs
▪️ Tokenized gold
▪️ Over 60 fiat currencies
🔹 Spending infrastructure:
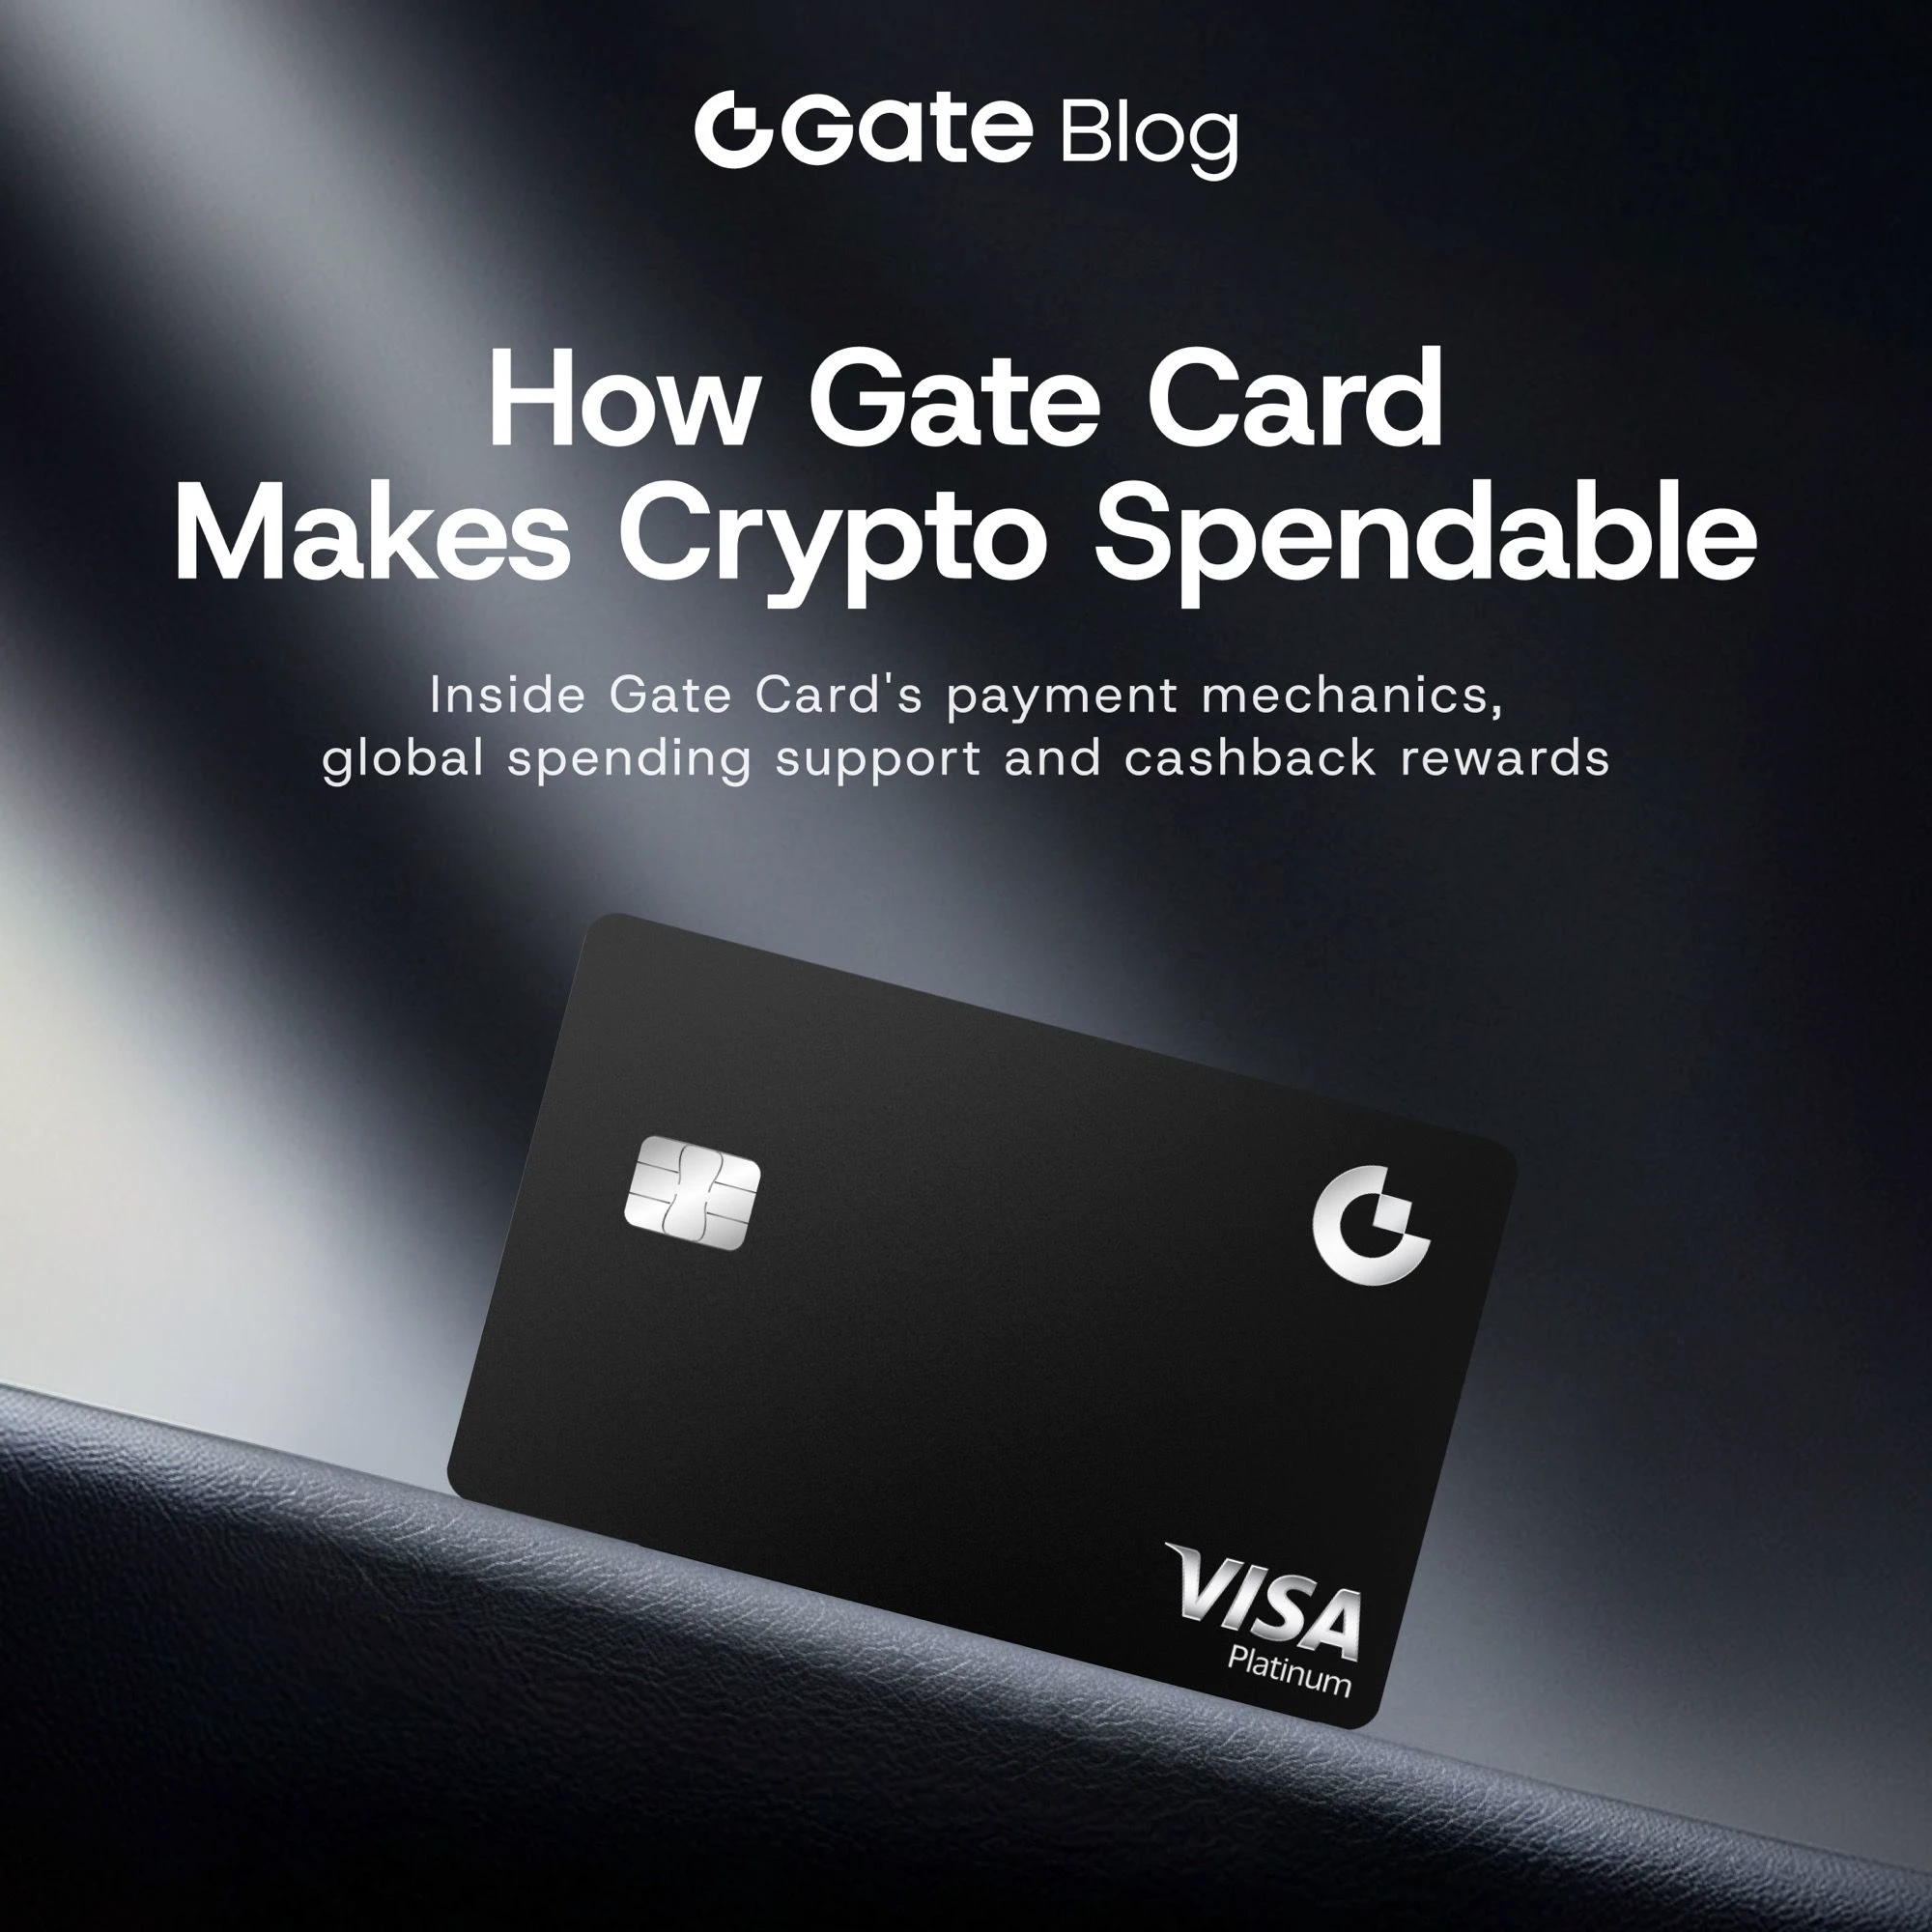
▪️ Gate Visa Card enables direct spending from multi-asset balances at checkout
▪️ Coverage across 40+ markets and more than 175 million Visa merchant locations worldwide
▪️ Supports Apple Pay, Google Pay, and ATM cash withdrawals
🔹 Banking integration:
▪️ Eligible users can open a global electronic bank account in their own name with one click
▪️ Supports receiving and transferring funds in over 60 local currencies
⚖️ Structural perspective:
🔹 From a long-term structural perspective, Gate Money addresses a persistent inefficiency in the financial system: the fragmentation of asset holding, management, and spending. Historically, users have had to move between banks, brokerages, exchanges, and payment tools to manage different forms of value.
▪️ The platform's design compresses this process into a single framework. The core logic is straightforward: Earn → Hold → Exchange → Transfer → Spend.
▪️ The significance extends beyond convenience. By connecting bank accounts, digital assets, fiat currencies, stocks, gold, and ETFs within one account architecture, the framework allows assets to remain usable without requiring prior liquidation. The reported example — paying for a coffee with stock holdings or covering dinner with gold — reflects this structural shift from asset silos to unified liquidity.
▪️ Dr. Han has noted that the traditional divide between the crypto world and traditional finance forces users to switch between multiple platforms. Gate Money's approach is to treat asset forms as diverse while keeping management unified.
▪️ The collaboration with Visa links this framework to an established global payments network, and the broader context shows crypto-linked card programs have seen payment volumes expand by nearly 200% year-over-year.
💬 When evaluating unified financial platforms, do you prioritize asset breadth or the depth of spending integration? 👇
Not financial advice.
🔹 At TOKEN2049 Singapore, Gate Founder and CEO Dr. Lin Han introduced Gate Money, a unified financial application built around the vision "One Gate, Everything Money." The platform consolidates digital assets, fiat currencies, stocks, ETFs, gold, bank accounts, and payments into a single account within the Gate App.
📊 The data behind the platform:
🔹 Asset coverage:
▪️ Over 5,300 crypto assets
▪️ More than 12,800 stocks and ETFs
▪️ Tokenized gold
▪️ Over 60 fiat currencies
🔹 Spending infrastructure:
▪️ Gate Visa Card enables direct spending from multi-asset balances at checkout
▪️ Coverage across 40+ markets and more than 175 million Visa merchant locations worldwide
▪️ Supports Apple Pay, Google Pay, and ATM cash withdrawals
🔹 Banking integration:
▪️ Eligible users can open a global electronic bank account in their own name with one click
▪️ Supports receiving and transferring funds in over 60 local currencies
⚖️ Structural perspective:
🔹 From a long-term structural perspective, Gate Money addresses a persistent inefficiency in the financial system: the fragmentation of asset holding, management, and spending. Historically, users have had to move between banks, brokerages, exchanges, and payment tools to manage different forms of value.
▪️ The platform's design compresses this process into a single framework. The core logic is straightforward: Earn → Hold → Exchange → Transfer → Spend.
▪️ The significance extends beyond convenience. By connecting bank accounts, digital assets, fiat currencies, stocks, gold, and ETFs within one account architecture, the framework allows assets to remain usable without requiring prior liquidation. The reported example — paying for a coffee with stock holdings or covering dinner with gold — reflects this structural shift from asset silos to unified liquidity.
▪️ Dr. Han has noted that the traditional divide between the crypto world and traditional finance forces users to switch between multiple platforms. Gate Money's approach is to treat asset forms as diverse while keeping management unified.
▪️ The collaboration with Visa links this framework to an established global payments network, and the broader context shows crypto-linked card programs have seen payment volumes expand by nearly 200% year-over-year.
💬 When evaluating unified financial platforms, do you prioritize asset breadth or the depth of spending integration? 👇
Not financial advice.