Square
Following
Hot
News
Notifications
Profile
Share your thoughts
placeholder
Article
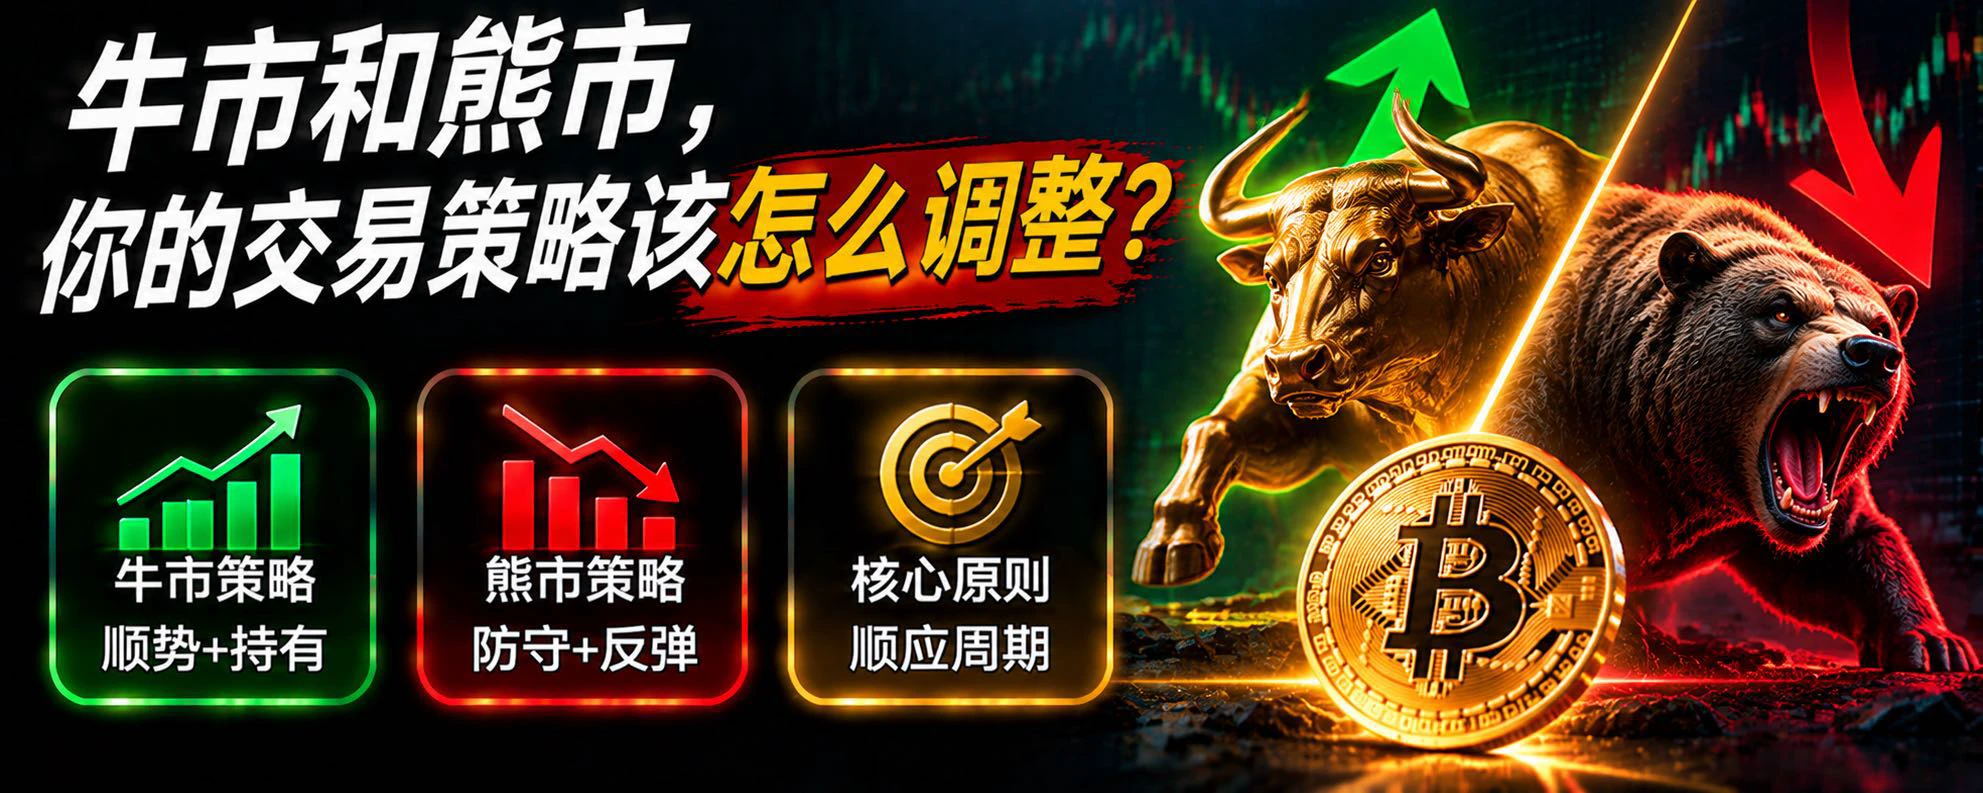
But decisions that can truly make money over the long term
often look stupid,
lonely, and counterintuitive in the short term.
For example, Dogecoin in 2021:
“You’re seriously putting money into a dog meme?”
The result: from around $0.004 at the end of 2020
to a peak of $0.74 in May 2021
Truly profitable, counterintuitive decisions over the long term
are usually built on value, patience,
and going against human nature
You think a token trading sideways is dead
Bitcoin’s bear market also went sideways for a year
In reality, sideways action is often when whales accumulate
and when the market shak
post-image
DOGE-0.22%
BTC-0.67%
🔴 1.6 million records stolen from a CAF platform. Names, addresses, and phone numbers are circulating on the dark web.
The hack targeted VACAF, the Caisse d'allocations familiales platform that manages vacation assistance. The hackers gained access using stolen partner accounts and spyware, then extracted 1.6 million records.
CAF is not an isolated case. The latest monthly report from the National Agency for the Security of Information Systems (ANSSI) lists 64 new data breaches, including 5 targeting ministries or public agencies.
France Travail was hacked on September 26 using a compromised
post-image
Trenches
mihao
m
bade
b
mihao
4Cxj...pump
Market Cap
$.
Change
.
24h Vol
$.
Holders
.
IDOL
I
bade
b
IDOL
0x3b...ab07
Market Cap
$.
Change
.
24h Vol
$.
Holders
.
FOOD
F
bade
b
FOOD
FTu5...pump
Market Cap
$.
Change
.
24h Vol
$.
Holders
.
Sakura
S
bade
b
Sakura
9sFG...pump
Market Cap
$.
Change
.
24h Vol
$.
Holders
.
AGT
A
bade
b
AGT
0x5d...e274
Market Cap
$.
Change
.
24h Vol
$.
Holders
.
STRATEGY ADDED 210,333 $BTC … BUT LOST $22.78 BILLION IN VALUE. WHAT WENT WRONG?
On Oct 6, 2025: 640,031 BTC worth $79.82B.
Today: 850,364 BTC worth just $57B.
That's 210,333 additional BTC, yet nearly $23B wiped off its Bitcoin NAV.
Now imagine BTC reclaiming $125K.
Strategy's current holdings would be worth $106.3 BILLION. (+49B)
Accumulation continued. Valuation collapsed. What happens when Bitcoin reverses?
BTC-0.67%
How to identify a false breakout and avoid getting trapped in a bull trap!

In BTC trading, one of the market moves most likely to create an illusion for traders is a false breakout. The price suddenly breaks above a key resistance level, and many people see the candlesticks surge and assume a new rally has begun, rushing to go long. However, the price soon falls back into its previous range, leaving those who bought at the top at an immediate disadvantage.

So, how can you identify a false breakout?

First, check whether trading volume confirms it. A genuine, strong breakout usually needs vol
post-image
BTC-0.67%
How can you gauge BTC’s next move when it enters a sideways range?

In the crypto market, sideways trading is often more frustrating for traders than a one-way rally or decline. Prices repeatedly fluctuate within a range, making it seem like there are plenty of opportunities, but few people can actually capitalize on them. Some keep going long, while others repeatedly go short, only to find that fees and frequent stop-losses are steadily eating away at their accounts.

So, how should you gauge BTC’s next move during a sideways market?

First, watch changes in trading volume. If volume graduall
post-image
BTC-0.67%
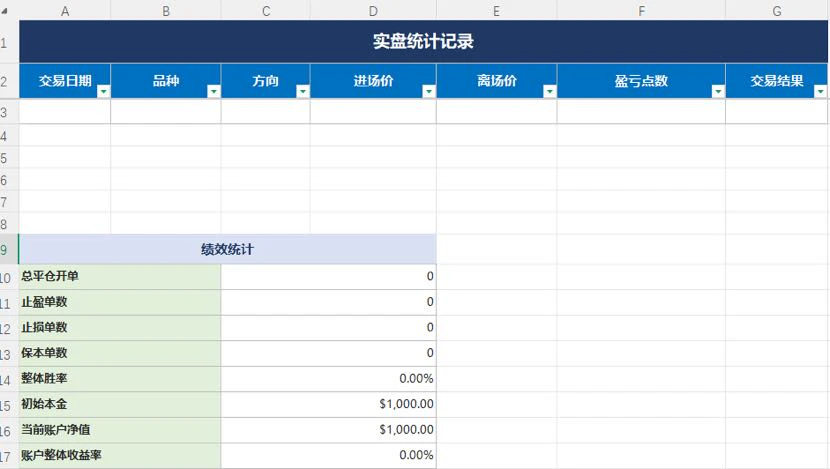
Next week, I’ll transfer 1000U into the copy-trading account and begin a brand-new live trading cycle.
I can’t publicly display my personal positions, so all funds are held in the copy-trading account. Live trading records are shared with subscribers, and every trade is logged and tracked.
My trading focus is expanding beyond precious metals into U.S. stocks.
For subscribers who trade crypto, I’ll continue to look for more relevant trading signals.

📌Note for subscribers: Markets move very quickly. By the time a text signal for a (real-time) trade is sent, the best entry point has usually alr
post-image
11.14 Daily Market Analysis
‍$BTC A high-volume decline—where will support emerge?
BTC-0.65%
You never know where the black swan will emerge from
post-image
  • 2
Many traders expect a pullback after BTC rises, hoping for a better entry. But a retest isn't always an opportunity; sometimes it can signal that a downtrend is resuming. The key is to determine whether support is holding and whether the overall market trend remains healthy.

First, assess the strength of the support level. If a price area has seen multiple rebounds in the past, that may indicate strong buying demand there. When the price returns to this area, watch closely to see whether buyers step back in.

Second, watch for changes in trading volume. If volume gradually declines as the pri
BTC-0.67%
One shocking revelation after another keeps coming out, and each is more explosive than the last.
How should the complete process of a BTC futures trade, from opening to closing a position, work?

Many traders who are new to the BTC futures market go long when they see prices rising and short when they see prices falling. But what truly determines the outcome of a trade is not just your assessment of the direction—it’s whether you have a complete execution process from before opening a position through to closing it.

Step 1: Analyze the market trend. Before opening a position, first assess whether BTC is currently rising, falling, or trading sideways. Use price structure across different
post-image
BTC-0.65%
$JTO Now heavily shorting, later selling at $0.3695. Short entry price: $0.2922 $JTO 🔥
post-image
JTO-0.68%
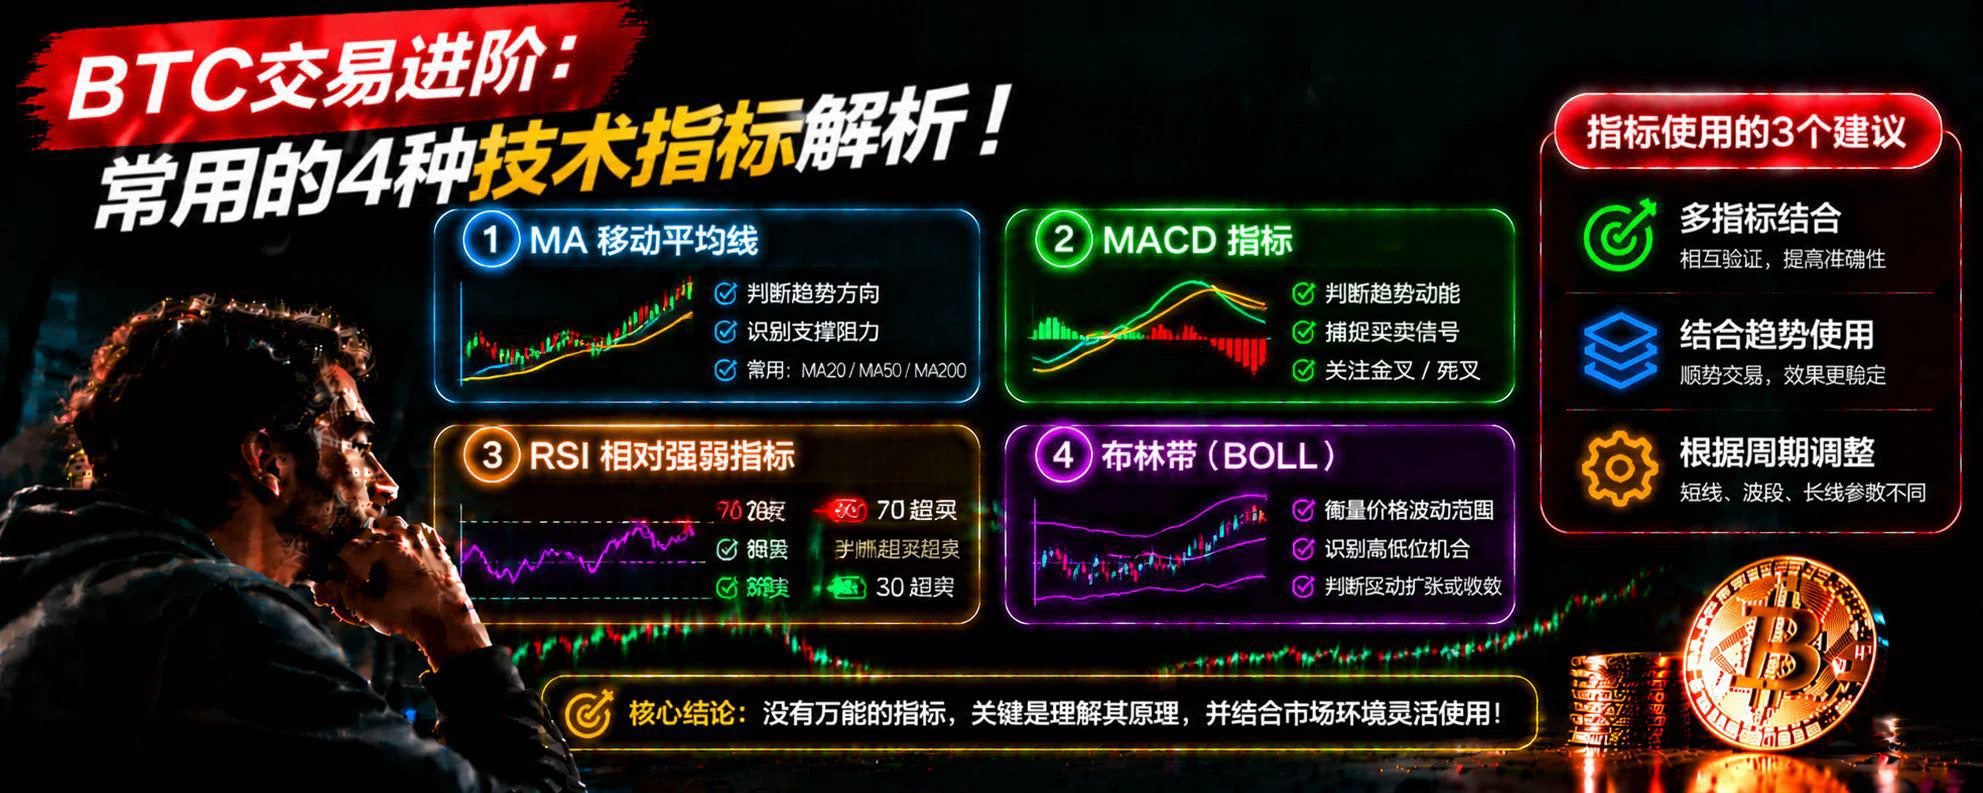
When Multiple Indicators Send Conflicting Signals in BTC Trading, Which Should You Trust?

In BTC technical analysis, many traders routinely use MA, MACD, RSI, and Bollinger Bands at the same time, hoping that multiple indicators will improve the accuracy of their judgments. But in actual trading, a common situation is that MA shows an uptrend, RSI has already entered overbought territory, and MACD shows signs of weakening momentum. So should you go long or short?

First, prioritize assessing market structure. Technical indicators are only auxiliary tools; price itself is the market’s most dir
post-image
BTC-0.67%
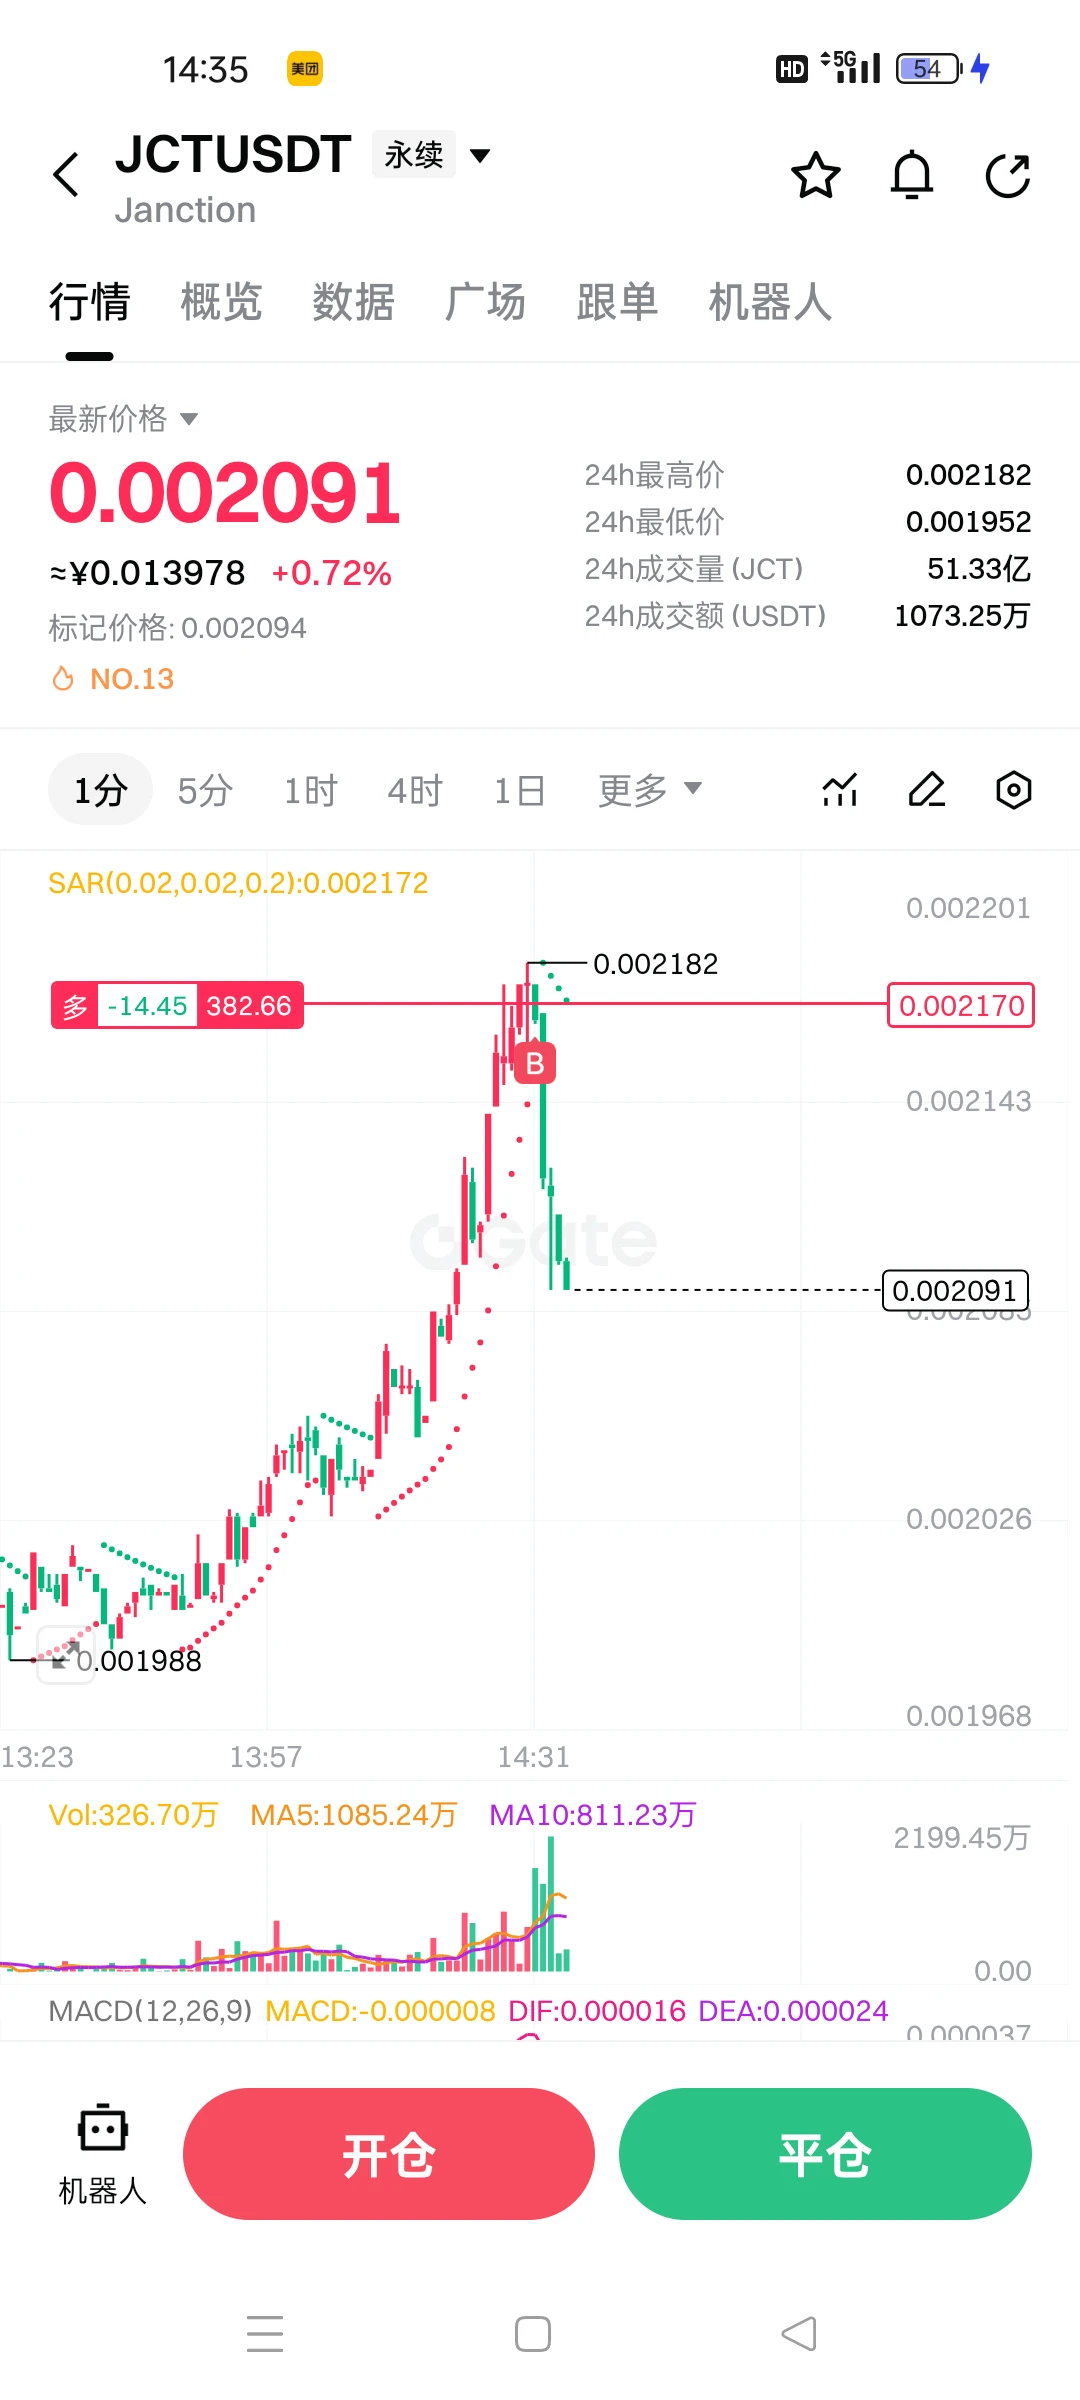
Can I say the market maker is targeting me? It drops as soon as I buy. What kind of market maker would pull something like this.
post-image
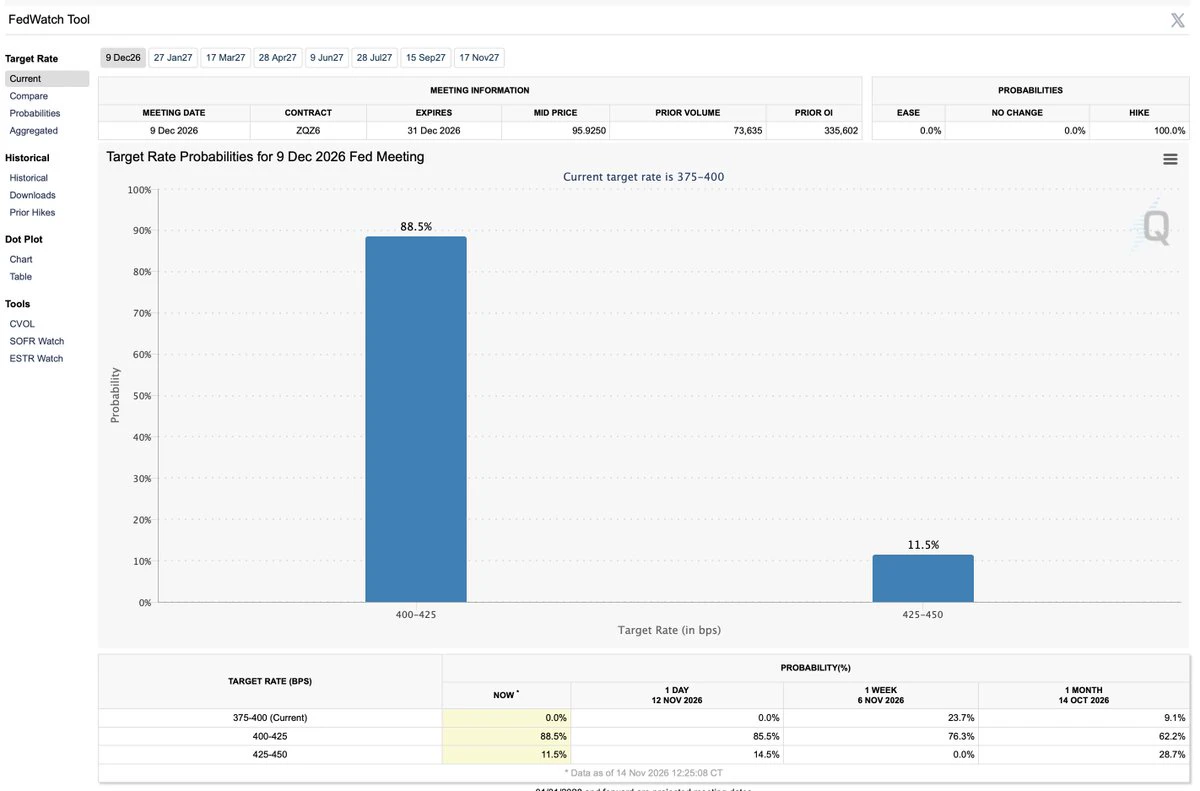
This FedWatch snapshot shows markets fully pricing a December rate hike: an 88.5% probability of 25bps and 11.5% of 50bps.
A headwind for #BTC & #Crypto: higher rates can tighten financial conditions and reduce appetite for risk. The next question is how much is already priced in.
So, according FedWatch, the combined implied probability of a rate rise is 100%:
post-image
BTC-0.67%
Is BTC Suitable for Dollar-Cost Averaging? Use Time for a More Measured Investment Pace!

In the cryptocurrency market, many people hope to buy at the bottom and sell at the top. But in reality, even experienced investors find it difficult to accurately predict every market turn. Some make a lump-sum purchase and then face a major drawdown, while others keep waiting for a lower price and ultimately miss a long-term rally.

So, is BTC suitable for dollar-cost averaging?

First, it reduces the difficulty of timing the market. The biggest feature of dollar-cost averaging is investing in installme
post-image
BTC-0.67%
In the cryptocurrency market, many traders know some technical analysis methods, yet continue to lose money repeatedly in choppy markets. The reason may not be that their technical skills are lacking, but that they have failed to identify the current market regime.

The biggest difference between trending and choppy markets lies in how prices move.

First, in choppy markets, prices usually fluctuate repeatedly within a certain range, with resistance above and support below. If you follow a trend-trading approach, going long when you see prices rise and going short when you see them fall, you c
post-image
🔹Buy the Dip or Sell the Rally on Nvidia? Tom Lee Calls for Buying the Dip, While Michael Burry War
live-cover
LIVE2,900
Ethereum market predictions update
live-cover
LIVE1,861
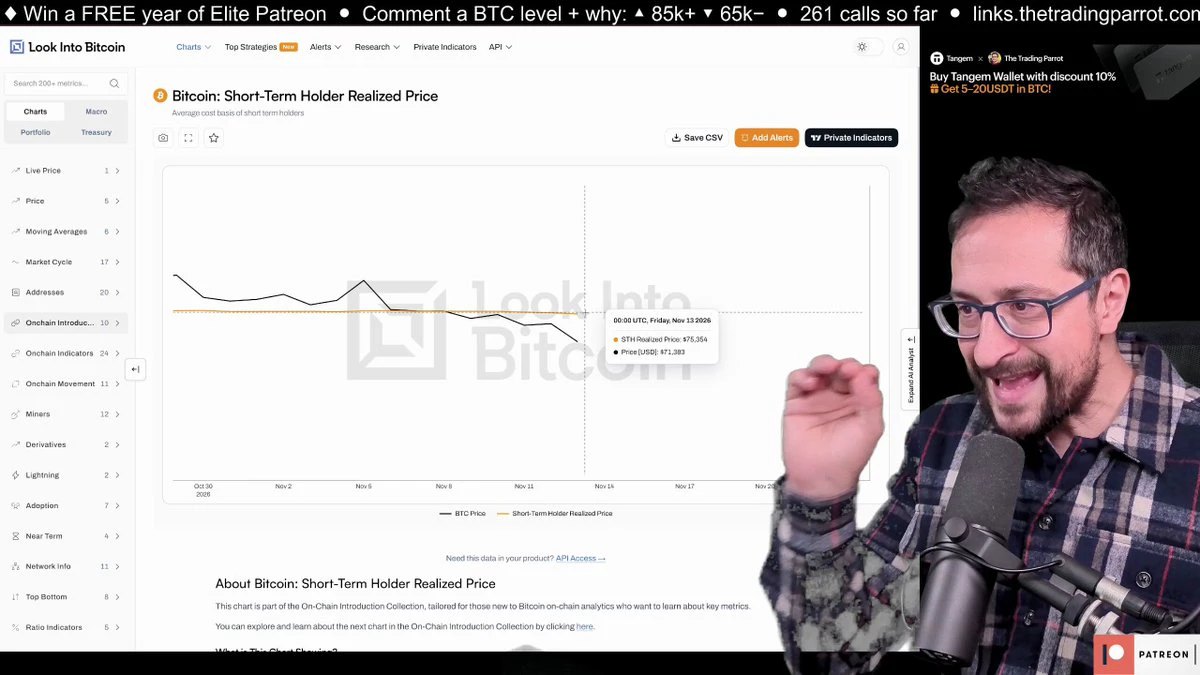
🎯 The $75K short-term holder realized price is THE line in the sand. In a bull market, it's support. In a bear market, it's resistance you don't reclaim for months. Which one is it? The answer starts at 19:53 in today's video.
#Bitcoin #BTC #Crypto #STH #BitcoinAnalysis
post-image
BTC-0.67%
Load More

Join 40 M users in our growing community

⚡️ Join 40 M users in the crypto craze discussion

💬 Engage with your favorite top creators

👍 See what interests you

Trending Topics

GateIPOAccessAnthropic

305.3K Views2.8K Discussing

Gate IPO Access Phase 3 features Anthropic (ANT), with USDT subscription interest starting from 100 USDT. Successful allocations will be delivered as real shares to Gate Stock Accounts. Indicative price: $70–$78/share Subscription: Nov 12–17 (UTC+8) Allocation is not guaranteed. Please manage risk accordingly.

Dr.HanOxfordUnionSpeech

147.2K Views586 Discussing

USOctoberPPIBelowExpectations

461.1K Views1.4K Discussing

View More