Share your thoughts
placeholder
Article
$SUSHI is going to hit 0.27 - 0.3 soon 😍
Buy now ✅
Aim for:
1st expansion zone: 0.27-0.3
2nd expansion zone: 0.35-0.37
3rd expansion zone: 0.4 - 0.47
Move stop loss to entry once 0.285 hits 👍
post-image
SUSHI+36.75%
This rounding bottom on the RSI looking mega bullish for $ADA
I wouldn't be surprised to see an explosion in the near future🚀
post-image
ADA+2.80%
  • 2
【$BUS Signal】Go long on 1H pullback support
$BUS The buy/sell order book depth ratio is 1.13, with buy-side order volume leading. The 1H RSI is 62.23, while the 4H candlestick surged and retraced to 0.1774, with MA20 providing support. The 1H MACD histogram turned negative, but buy-side depth remains strong, with clear support around 0.1768.
🎯 Direction: Long
⚡ Entry/Limit Orders: Scale in within the 0.176868-0.177400 range
🛑 Stop Loss: 0.175626
🚀 Target 1: 0.180061
🚀 Target 2: 0.181391
🛡️Trade Management:
- Execution Strategy: After reaching Target 1, reduce the position by 50% and mov
post-image
BTC+0.12%
ETH+0.83%
SOL+1.65%
Trumps right hand man..
post-image
Everyone’s long ETH here—but the 4h tape is quietly whispering a different name.

$ETH /USDT - SHORT

Trade Plan:
Entry: 2471.39 – 2476.31
SL: 2497.44
TP1: 2456.16
TP2: 2444.36
TP3: 2426.67

Why this setup?
- $ETH /USDT sits at 2473.85, pinned in a 1D range while the 4h bias flips SHORT (conf: 55).
- RSI on 15m is hot at 62—buyers are exhausted, not impulsive.
- ATR 1h at 9.8 means the squeeze is tight; invalidation at 2460.15 is the line in the sand.
- Why now? We’re waiting at entry, but the path of least resistance is down toward TP1 2456, then TP2 2444.

Debate:
If 2460 breaks, d
ETH+0.90%
$ASTEROID liquidated over 600 million in long positions.
post-image
ASTEROID-13.81%
This move doesn't even require me to think—the account is dancing on its own. When the screen was all green, everyone was selling at a loss, but I didn't panic watching the market. It was bottoming without breaking support, while funds quietly entered—the signal worked better than any analysis.

$SNDK $LAB
post-image
SNDK+2.14%
LAB+1.61%
People often ask how to hold onto a position when the market is rallying. Honestly, it’s not about stubbornly holding on; each stage requires its own approach. I decided to go long on $SUI not out of a momentary impulse, but because the price held up after repeatedly retesting key levels, with the structure temporarily favoring the bulls, so I chose to enter around 0.7630 to test a long.

The hardest part during the consolidation wasn’t judging the direction, but keeping my hands steady and not making impulsive moves. Once the price started rising again and short-term room opened up, I first
post-image
SUI+6.28%
XRP+1.11%
ZEC-1.85%
I was just hoping to get a bite of meat, but the market handed me an entire cow instead. During the repeated intraday swings, I noticed the buy orders were quietly accumulating, clearly showing that someone was stepping in to absorb the supply. I kept my core position unchanged and decisively entered at the indicated level.

Now $ORDI has climbed from 3.466 all the way to 4.207, with floating gains surging to +1026.14%. Those who missed the move are kicking themselves.

Brothers on board, take note: First, take 80% profit off the table, then immediately move the stop-loss on the remaining 2
post-image
ORDI+4.19%
LAB+1.61%
ADA+2.91%
That said, don't get greedy trying to catch the very last bit of the move. I'll take profit on 80% first to lock in the gains, and place a breakeven stop on the remaining 20%. If it keeps pumping, I'll let the profits run; if it pulls back, I won't let the gains turn into a loss.
$DOGE $ZEC
post-image
DOGE+7.15%
ZEC-1.85%
market overview
live-cover
LIVE67
SKYAI’s 95% short signal is screaming, but the 15m RSI just hit 65—who’s buying this fake bounce?

$SKYAI /USDT - SHORT

Trade Plan:
Entry: 0.06033 – 0.06095
SL: 0.06357
TP1: 0.05844
TP2: 0.05698
TP3: 0.05478

Why this setup?
Why now? The 4h timeframe is loading a bearish cannon, and the daily trend confirms the floor is giving way.
- Entry zone: 0.06064 (tight range 0.06033–0.06095) is your launchpad.
- Targets: TP1 at 0.05844, TP2 at 0.05698—that’s a 6% drop from here.
- Stop at 0.06357 is wide enough to breathe, but tight enough to punish dreamers.
- ATR (1h) at 0.001221 means vo
SKYAI+6.90%
I originally wanted to cut my losses as a sacrifice to the heavens, but the sacrifice never happened—the meat roasted itself. When I checked the chart after lunch, $SKHYNIX was grinding around 1235.91 and testing my patience. One look at that lower wick told me everything: this was a textbook pullback holding support, with bottom-fishing bids absurdly strong.

The thinking at the time was very simple: hold as long as the key level stayed intact, and leave only if it broke. Who could have imagined it would surge straight to 1276.07 in the afternoon, sending paper profits soaring to +229.4%? T
post-image
SKHYNIX-0.23%
BTC+0.17%
SOL+1.72%
Most traders will fade this 95% confidence LONG on NEAR — that’s exactly why it prints.

$NEAR /USDT - LONG

Trade Plan:
Entry: 2.2204 – 2.2448
SL: 2.1152
TP1: 2.3207
TP2: 2.3794
TP3: 2.4674

Why this setup?
- Daily trend is bullish, and 4h structure is armed for a breakout, not a breakdown.
- RSI 15m at 52.47 shows room to run—no overbought cliff yet.
- Entry zone 2.2204–2.2448 aligns with the 1h pivot (2.2326); TP1 at 2.3207 is a 4% scalp, TP2 at 2.3794 is the real meat.
- ATR 1h (0.0489) says volatility is expanding—waiting for a “better” entry means missing the move.
- Invalidat
NEAR+1.20%
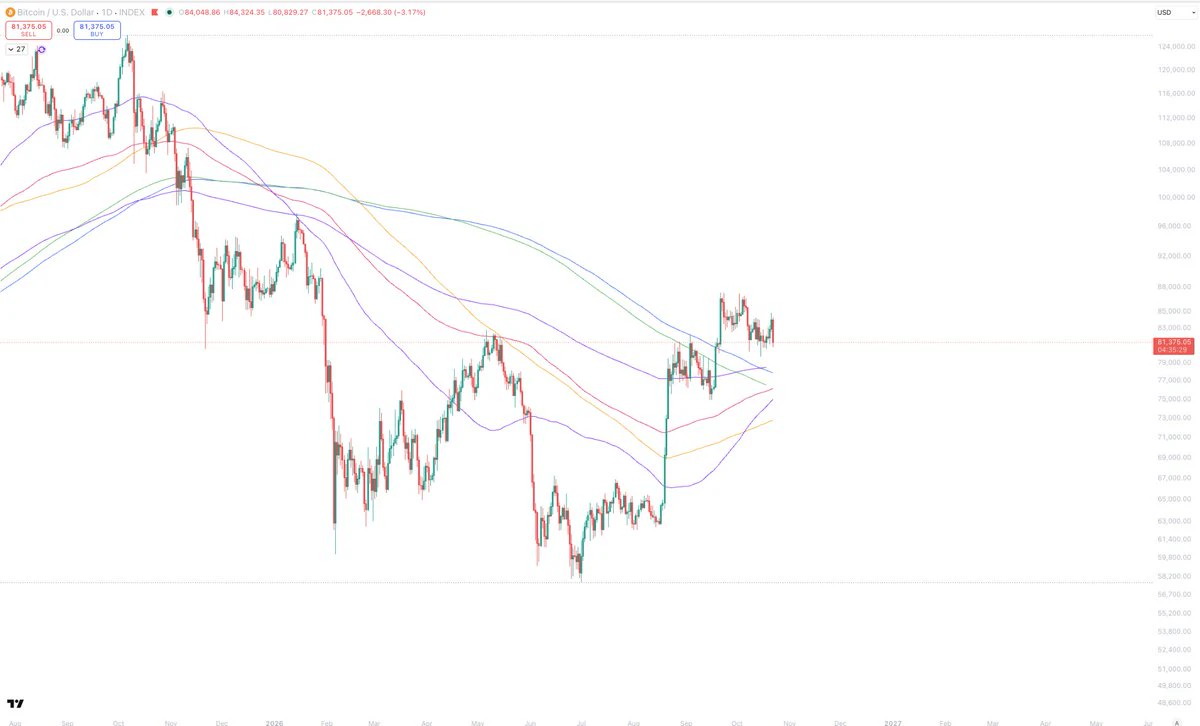
Why is everyone watching BTC/USDT at 79,957 while the 4h chart whispers a different story?

BTC/USDT - SHORT

Trade Plan:
Entry: 79896.64 – 80018.94
SL: 80544.86
TP1: 79517.49
TP2: 79223.95
TP3: 78783.65

Why this setup?
- The 1D trend is *range*, not breakout—so fading the top is the play, not chasing.
- RSI on 15m is at 61.36 (overbought short-term), but the 4h bias is SHORT (conf 55.4).
- ATR on 1h is just 244—tight moves mean the entry at 79,957 is a precision zone, not a gamble.
- Targets are stacked: TP1 79,517, TP2 79,223, TP3 78,783—each a step down the ladder.
- Why now? Th
BTC+0.17%
Everyone’s long LTC at 54.78—I’m counting the seconds until the 4h rug pull hits SYMBOL.

$LTC /USDT - SHORT

Trade Plan:
Entry: 54.64 – 54.92
SL: 56.58
TP1: 53.43
TP2: 52.53
TP3: 51.17

Why this setup?
- RSI on the 15m is already overheated at 68 while price sits mid-range—no fuel left for upside.
- 1D trend is *range*, and we’re at the top of that range with a 77% short conviction.
- ATR (0.58) is tight, meaning the breakout is violent when it comes—and it’s pointing to TP1 at 53.43 before you blink.
- Why now? Because the 4h structure is rejecting 54.92, and the waiting game ends w
LTC+7.08%
Most traders will fade this LINK move—that’s exactly why it prints.

$LINK /USDT - LONG

Trade Plan:
Entry: 11.980 – 12.032
SL: 11.761
TP1: 12.190
TP2: 12.312
TP3: 12.496

Why this setup?
- 1D trend is bullish, yet 4h shows a 95% confidence long setup at 12.006—this is the pullback buyers begged for.
- RSI 15m at 53.78 = room to run, not overbought. ATR 1h (0.102) says volatility is compressing—breakout fuel.
- TP1 at 12.190 is a 1.5% scalp, but TP3 at 12.496 is 4% with zero resistance overhead per structure.
- Why now? The 1h pivot held perfectly (11.980–12.032). Invalidation at 11.3
LINK+2.56%
Gold and Bitcoin Remain Active as Traders Balance Inflation With Rate Expectations
live-cover
LIVE318
A few days ago, I was still calculating whether I had enough money for instant noodles this month; this morning, I was already wondering whether to add sausage. While everyone else was rushing in, I kept watching the chart and repeatedly confirming that there were buyers at this level. $DASH It started from 39.86 and reached 67.49 in one go, with unrealized gains of +3341.81%—it feels incredible. Funds quietly entered, and the bottom range held without breaking. That’s why I held my long position. I’m taking 75% off the table now to lock in profits, moving the stop loss on the remaining 20% to
post-image
DASH+21.24%
BNB+7.78%
SOL+1.72%
Everyone’s staring at the green ticker, but the 4H chart just whispered a 95% secret about $LAB /USDT.

$LAB /USDT - SHORT

Trade Plan:
Entry: 0.07439 – 0.07489
SL: 0.07700
TP1: 0.07287
TP2: 0.07169
TP3: 0.06992

Why this setup?
- The daily trend is **bearish**, and confidence is a rare 95/100—this isn’t a coin flip.
- Price is hovering at 0.07464, but the real gravity pulls toward TP1 at 0.07287 and TP2 at 0.07169.
- RSI on the 15m (51.65) shows zero bullish momentum—just a lazy pause before the next leg down.
- Why now? The 1h ATR (0.000984) is tight, meaning the breakdown will be e
LAB+1.61%
Load More

Join 40 M users in our growing community

⚡️ Join 40 M users in the crypto craze discussion

💬 Engage with your favorite top creators

👍 See what interests you

View More