Square
Following
Hot
News
Profile
Share your thoughts
placeholder
Article
+$7,000 added to my balance: Telegram gift.

Finally got lucky with Telegram gifts — fortune smiled on me:

> Resitanse Dog gift has caused a lot of buzz lately because of its rising price, beautiful designs, and crafting mechanic (you use 1 to 4 gifts to get a new gift).

So:
> in August 2025, I bought the gift for 5,000 Telegram Stars (~$75);
> in October 2026, I upgraded the gift for 1,000 Telegram Stars (~$15);
> result — I got a black-background gift; as it happens, black-background designs are the most valuable ones;
> I sold it for 5,476 $GRAM = ~$7,337.
After all the times I’ve up
post-image
GRAM-0.01%
$BTC and $ETH are dumping again.
$120 million worth of longs liquidated in the past 60 minutes.
post-image
BTC-0.52%
ETH-1.36%
  • 7
  • 2
Trenches
AGT
A
bade
b
AGT
0x5d...e274
Market Cap
$.
Change
.
24h Vol
$.
Holders
.
CNPY
C
bade
b
CNPY
0xc6...ddd2
Market Cap
$.
Change
.
24h Vol
$.
Holders
.
Q
Q
bade
b
Q
0xc0...0589
Market Cap
$.
Change
.
24h Vol
$.
Holders
.
Gato
G
bade
b
Gato
55A3...pump
Market Cap
$.
Change
.
24h Vol
$.
Holders
.
FTR
F
bade
b
FTR
DFMt...pump
Market Cap
$.
Change
.
24h Vol
$.
Holders
.
Lighter's EVM devnet, built with Axiom, is live, letting smart contracts place, modify and cancel orders on its exchange directly. Lighter is backed by Founders Fund, Ribbit Capital and Robinhood.
@Lighter_xyz
post-image
LIT-2.38%
HOOD-4.94%
EtherFi's borrowing market is the largest app on Optimism, with $300.5M locked, nearly six times Aave V3's $50.35M on the network. Its loans are up 24.81% in the past 30 days to $41.55M.
@ether_fi
OP-6.60%
AAVE-2.49%
$SAND Bottom line: Short-term bias is bullish, but this is a short squeeze driven by crowded shorts, not a trend reversal. Wait for a pullback confirmation before chasing higher.
The funding picture is the key factor right now. The funding rate is -0.1930%, making it extremely costly to hold short positions, while the price has risen 9.97% over 24h to 0.05978, indicating that shorts are being squeezed and funding is being pushed toward the long side. But beware: the MACD histogram remains negative at -0.00023, and the RSI is only 52.7, so momentum is unconfirmed; the range over 30 candles is a
post-image
AVAX-2.69%
i clicked out after 100% but queue let me run it to almost 2x
gud tek
post-image
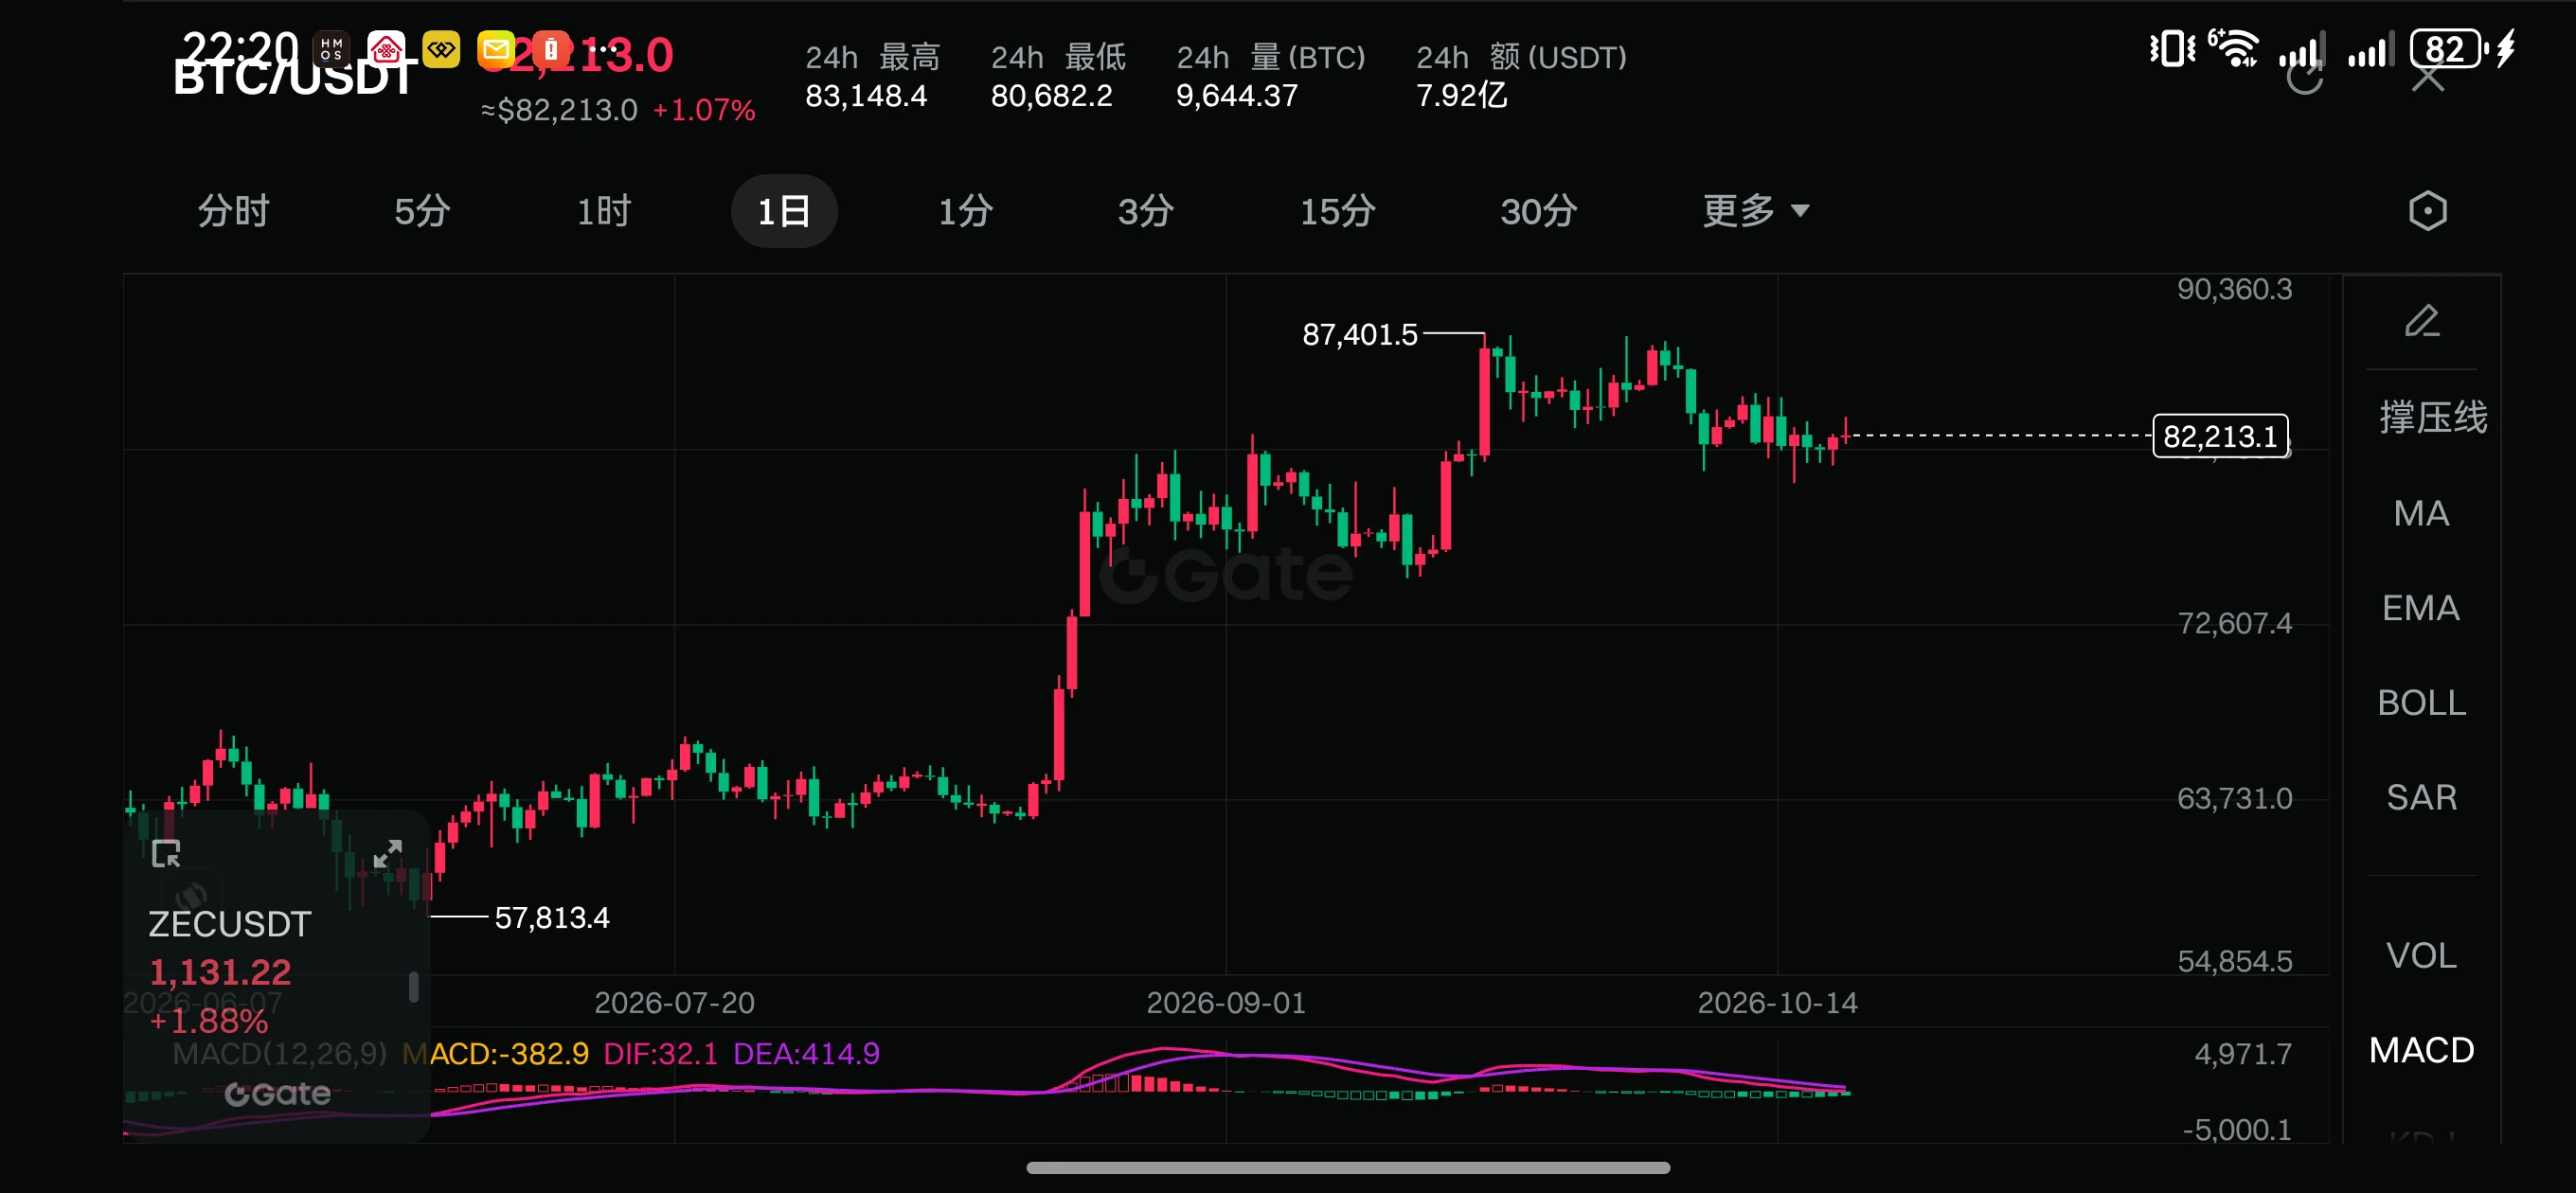
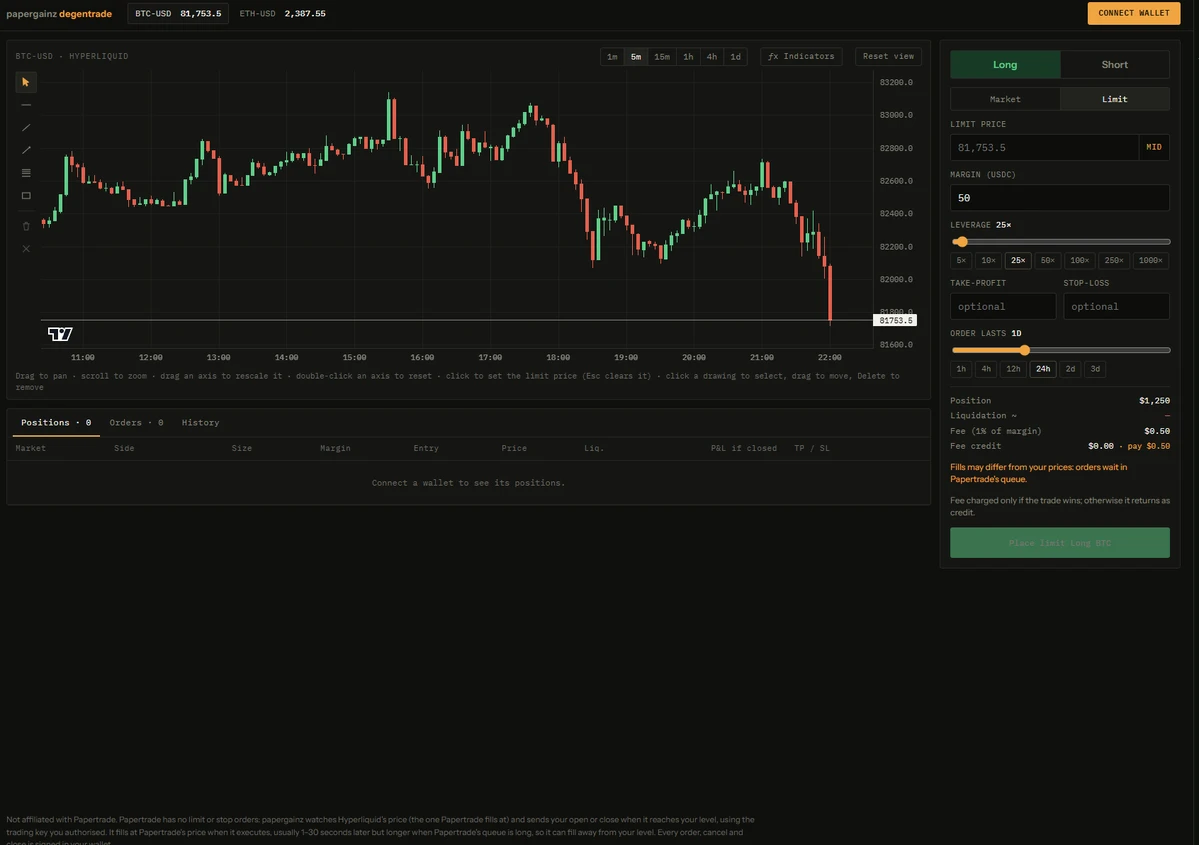
A huge bearish candle just came down.
If 80K holds, I’m not closing my long. I’m sticking with my bullish view and targeting 90K.
post-image
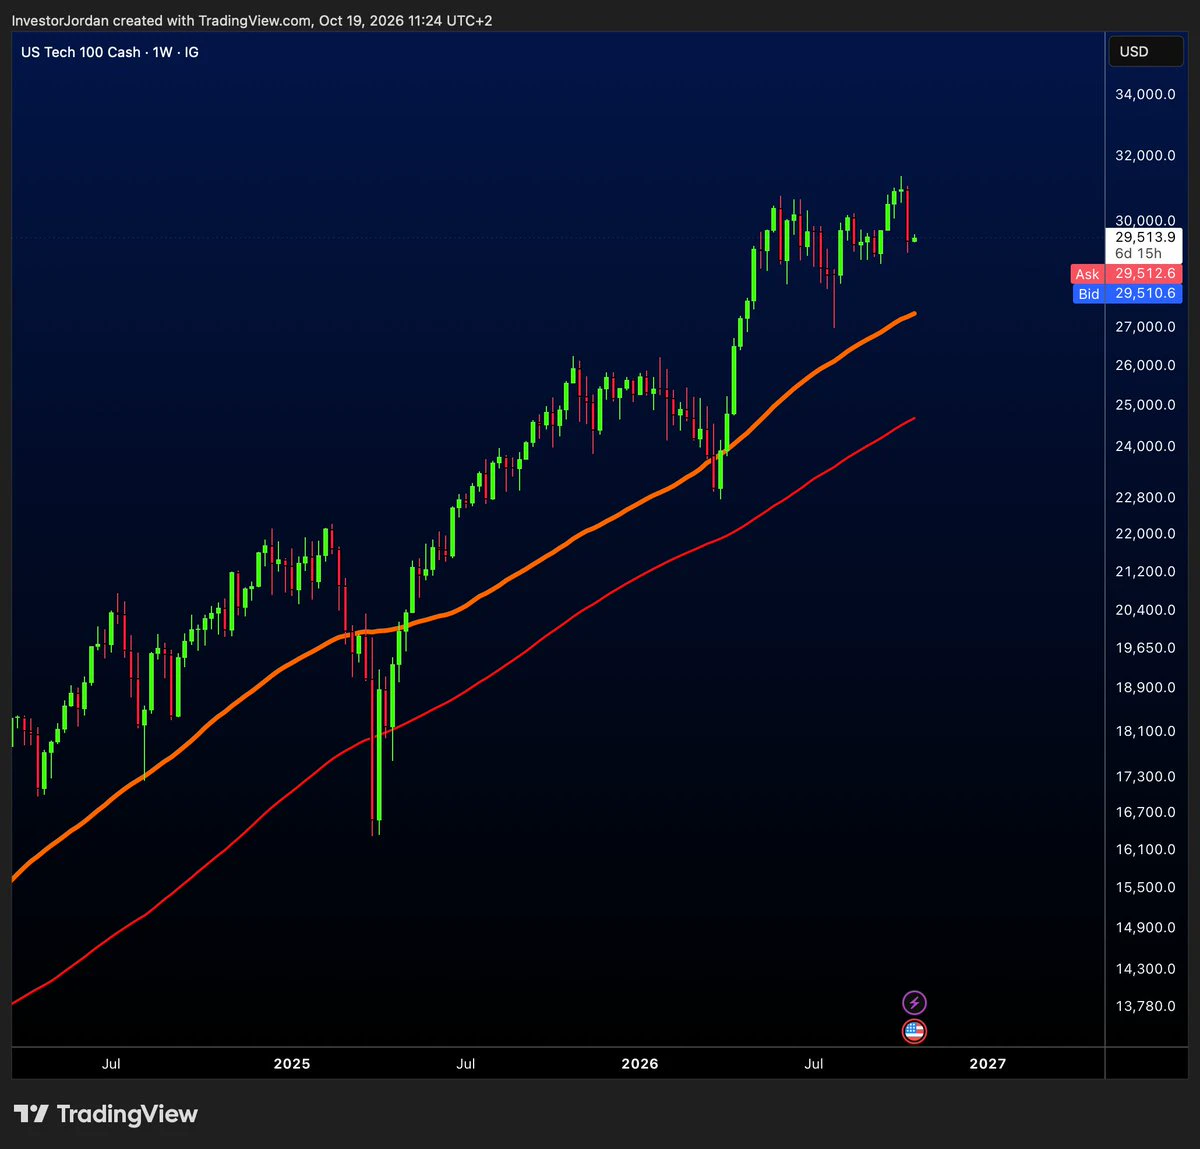
The Magnificent Seven are propping up S&P earnings growth. The earnings data is still there, but this level of concentration is a risk in itself. Once the social media buzz cools, the crowded trade can quickly unwind. After doing this for so long, I’ve learned that position sizing is always more important than getting the direction right. What do you think?
post-image
SPX+5.61%
Strong rebound in the main FVG zone on the 1-hour chart, with a pullback expected to the main liquidity area around $0.255–$0.260. ‼️Long $GTC Entry price: 0.235 - current price Take profit: 0.257 Stop loss: 0.215 Trade here $GTC 👇
post-image
GTC
GTC芝麻币
Gate.Fun
MC:$0.1Holders:1
0%
Grinding sluggishly along the 7-day lower edge; the rebound is as limp as day-old noodles😏 Longs make up 74%, all crowded together; any position cuts on a drop mean stop-loss sellers lining up. A break below 2355 triggers a stampede—the shorts are closing in, countdown to the squeeze👀
post-image
ETH-1.33%
Bitcoin falls below $81k, Ethereum below $2,400
live-cover
LIVE2,120
BTC falls 0.62% in 24 hours, with $31.89 million in sell volume in the final hour
Gate spot BTC/USDT is currently quoted at 81285.5 USDT, down 0.62% over 24 hours, with a high of 81818.4 and a low of 80817.0. That 0.62% is almost negligible on the daily chart, but the final hourly candle was different: it opened at 81647.1, plunged to a low of 80817.0, and closed at 81124.9, with 31.89 million USDT in hourly trading volume—more than three times the previous hour’s approximately 8.71 million.
What I’m more interested in is whether this drop was accompanied by volume. Looking at the latest 48 ho
BTC-0.52%
  • 1
What #ticker could 100x next?
post-image
The Fear and Greed Index remains in the greed zone at 55, but $PUMP is currently at 0.004315, below the Bollinger lower band at 0.00432588, down 7.86% in 24h, with a trading volume of 14.8M USDT; MA5=0.0044206 is below MA20=0.00452215, RSI=36.6 is nearing oversold territory, and the MACD histogram at -2.051e-05 remains bearish. While broader market sentiment has not turned cold, this token is weakening independently. The decline reflects capital outflows amid sector rotation. The funding rate of +0.0015% shows that longs are still paying to hold their positions. A short-term rebound is due, bu
post-image
GTC
GTC芝麻币
Gate.Fun
MC:$0.1Holders:1
0%
ALT+8.28%
hyperliquid:native is back at the 77–75 support area, the same zone that started the September rally.
A short-term bounce is around the corner. A break above the descending trendline would open the way back to 82–84.
Will this support hold again?
post-image
HYPE-2.69%
#DOGE #WCTCS9 Dogecoin May See Its First Major Daily Death Cross of 2026: Is a Potential Trend Reversal Coming?
A potential trend reversal could offset bearish pressure and invalidate the current pattern.
Dogecoin could see its first daily death cross of 2026 as moving averages suggest they will converge in the coming days. The daily 50-day moving average is currently trending downward, while the daily 200-day moving average is flattening, highlighting the potential for a death cross. Dogecoin saw its first daily golden cross since 2026 in October, but profit-taking in the crypto market drove
post-image
ThisIsTranslateContent:
#DOGE #WCTCS9 Dogecoin may see its first major daily death cross of 2026: Is a potential trend shift approaching?
A potential trend shift could counter bearish pressure and invalidate the current setup.
Dogecoin could see its first daily death cross of 2026, as moving averages point to convergence in the coming days. The daily 50-day moving average is currently sloping downward, while the daily 200-day moving average is flattening, highlighting the potential for a death cross. Dogecoin saw its first daily golden cross of 2026 in October, but profit-taking in the crypto market drove its price down to a low of $0.077. Bears seem to be making an aggressive effort to negate this bullish signal, with the possibility of a death cross drawing near.
The timing of a death cross remains uncertain, as a trend shift could counter the bears’ push and invalidate the current pattern. At the time of writing, Dogecoin was up 3.19% over the past 24 hours to $0.081, after briefly selling off as investors weighed higher-than-expected inflation data and the latest remarks on interest rates from Fed Chair Kevin Warsh.
Inflation data released this week was strong: the Producer Price Index released Thursday showed wholesale prices rose 6.3% year over year in September, the biggest increase since 2022. The Consumer Price Index also rose in data released Wednesday. Fed officials responded in September by approving the first rate hike in more than three years; markets expect the Fed to hold rates steady in October and hike again in December.
Could a trend shift be coming? The last time Dogecoin saw a death cross on the daily chart was in November 2025, followed by months of selling until a golden cross appeared recently. This has focused market attention on price action in case a death cross ultimately appears again.
Crypto analyst Ali recently posted a contrarian take on X, sharing three reasons to be bullish on Dogecoin.
First, the TD Sequential indicator has previously marked potential turning points for Dogecoin several times, and this time it issued a buy signal on the daily chart as the price neared $0.081.
Second, URPD data shows that about 36 billion DOGE previously traded near $0.081.
Third, whales appear to be buying near this support level, having accumulated 600 million DOGE since October 12.
If $0.081 holds and Dogecoin rebounds, Ali identifies the $0.16 to $0.17 range as a potential profit-taking zone. $DOGE
repost-content-media
DOGE-2.52%
#WarshIMFSpeech 📊 100% Win! Gate Square “Share Weekly” Special Topic is Ongoing!........
Post with hashtags for red packets, Up to 100 USDT weekly !
How to Join.......
1️⃣ Register: https://www.gate.com/campaigns/6244......
2️⃣ Post with #ShareWeekly and WarshIMFSpeech......
💬 Topic
Fed Chair Kevin Warsh speaks at an IMF fireside chat today. With inflation pressures rising, markets are watching for policy signals and their impact on the USD, stocks, and BTC.
💡 Discussion
1️⃣ Will Warsh sound hawkish or dovish? Could the Fed hike rates again?
2️⃣ How will his remarks impact BTC? Rally or pul
TSLA-2.17%
Something doesn't look right. $AVA is currently at 0.3957, up 34.73% in 24 hours, but look at this candle—the low was 0.2810, the high was 0.4226, a 50% swing, with $72.9M in trading volume. This isn't normal turnover; someone's aggressively sweeping up.
Three possibilities: first, someone positioned early in the derivatives market, with spot buying helping push the price up; second, low-priced holders have finished rotating their positions, and the whales are testing the selling pressure above; third, it's a pure sentiment-driven short squeeze, with 24-hour volume piling above $70M as short-
AVA+34.99%
$APR Down 16% in a day, plunging straight from 0.0478 to 0.0380. It’s now at 0.0399, with 13.7M in trading volume—this isn’t a pullback; someone’s moving out overnight. Here’s the dilemma: is this a golden opportunity or catching a falling knife?
The bullish case: First, the 24-hour low of 0.0380 has been tested twice without breaking, showing signs of short-term support; second, 13.7M in trading volume means liquidity is still there—it’s not a stagnant pool, so you can get in or out; third, after dropping 20% from 0.0478 to 0.0380, most of the short-term panic has likely played out, making a
APR-13.00%
Load More

Join 40 M users in our growing community

⚡️ Join 40 M users in the crypto craze discussion

💬 Engage with your favorite top creators

👍 See what interests you

Trending Topics

USSeptemberPPIBeatsExpectations

91.35k Views1.93k Discussing

US September PPI came in at 6.3% YoY, well above the 5.3% market expectation, pointing to renewed producer-side inflation pressure. Weekly jobless claims were 199K, broadly in line with forecasts. Could hotter inflation further reduce room for rate cuts, and what does it mean for $BTC, US stocks, and gold?

GateWCTCS9GlobalTradingCompetition

37.87k Views6.67k Discussing

GateBTCAndETHFuturesVolumeRanksTop3

53.8k Views1.81k Discussing

View More