

Square
Following
Hot
News
Profile
Share your thoughts
placeholder
Article
US CPI rose 3.7% year-on-year in September, above the market expectation of 3.6%, while core CPI at 2.6% also exceeded the expected 2.5%; a 9.1% monthly increase in gasoline prices was the main driver. After the data release, the market repriced the tightening path, with traders betting that the Federal Reserve may raise rates three more times by the end of 2027, weighing on risk assets; this was the core macro catalyst for the current ETH pullback and the backdrop for the technical rebound within the 15-minute window.
post-image
ETH-3.65%
  • 1
Which one is your favorite?
A lot cannot release 😂
post-image
#ASMLTSMCQ3EarningsSoon
Both semiconductor giants represent critical bottlenecks in the modern AI and advanced chip supply chains; however, TSMC holds a fundamentally stronger position and offers a more distinct catalyst for near-term earnings.
Following ASML's earnings release and ahead of TSMC's upcoming earnings call, here is a comparison of the two companies' profiles:
1.ASML
ASML announced its third-quarter earnings on October 14, setting a new benchmark for lithography equipment demand.
Q3 Results and Highlights
* Earnings Beat: Earnings per share came in at $14.65 (market expectation
TSMC
TSMCTSMC
Pump.Fun
MC:$2.59KHolders:1
3.24%
ASML-3.40%
TSM-3.35%
AMD-5.74%
  • 3
Which #Crypto Should I Add To My Bag_?
post-image
10.15 Intraday Strategy: Rate Hike Uncertainty, Excessive Pricing-In, Overblown Panic, Grid-Based Buying at Low Levels
The market absorbs all information. Both positive and negative factors are priced in, often excessively, resulting in periods of extreme euphoria or extreme panic.
ETH has once again dipped to around 2400, falling 100 points from 2500. The trigger for the decline was market concern over a rate hike, but core inflation in September was not higher than in August (both were 0.3%, with no deterioration). It was only slightly above market expectations, while Federal Reserve officia
ETH-3.68%
$ZEC —this trend is a textbook breakdown with no turnaround.
Down 6.44%, while the funding rate is still +0.01%.
Longs haven’t received a single cent in overnight fees.
So who’s dumping this wave?
It’s not leverage liquidations; if it were, the liquidations would have already driven the funding rate negative.
1285.14, at 9 a.m. yesterday.
1123, at 6 a.m. today.
162.14 wiped out in 21 hours, with buyers staying quieter than the last.
Now at 1147.16.
Only 2.11% left to fall to 1123.
It needs to climb 3.7% to reach that 20-day moving average.
1.76 to 1—what am I getting out of it?
(Not investment
post-image
ZEC-7.94%
Real-Time CPI Monitoring
live-cover
LIVE992
Gold on 10/15:
On the daily chart, the price stabilized around the low of 4066. The current price is between the lower and middle Bollinger Bands, consolidating sideways at low levels, with resistance from the middle Bollinger Band above.
The three KDJ lines are turning upward and are about to form a golden cross, indicating short-term recovery momentum, but key resistance has not yet been broken, and the larger-cycle downtrend structure remains unchanged.
Trading advice:
Short from 4170-4150, target 4030-4000, stop-loss at 4180
(For reference only; actual trading conditions shall prevail!)
post-image
GLDX-0.93%
PAXG-0.37%
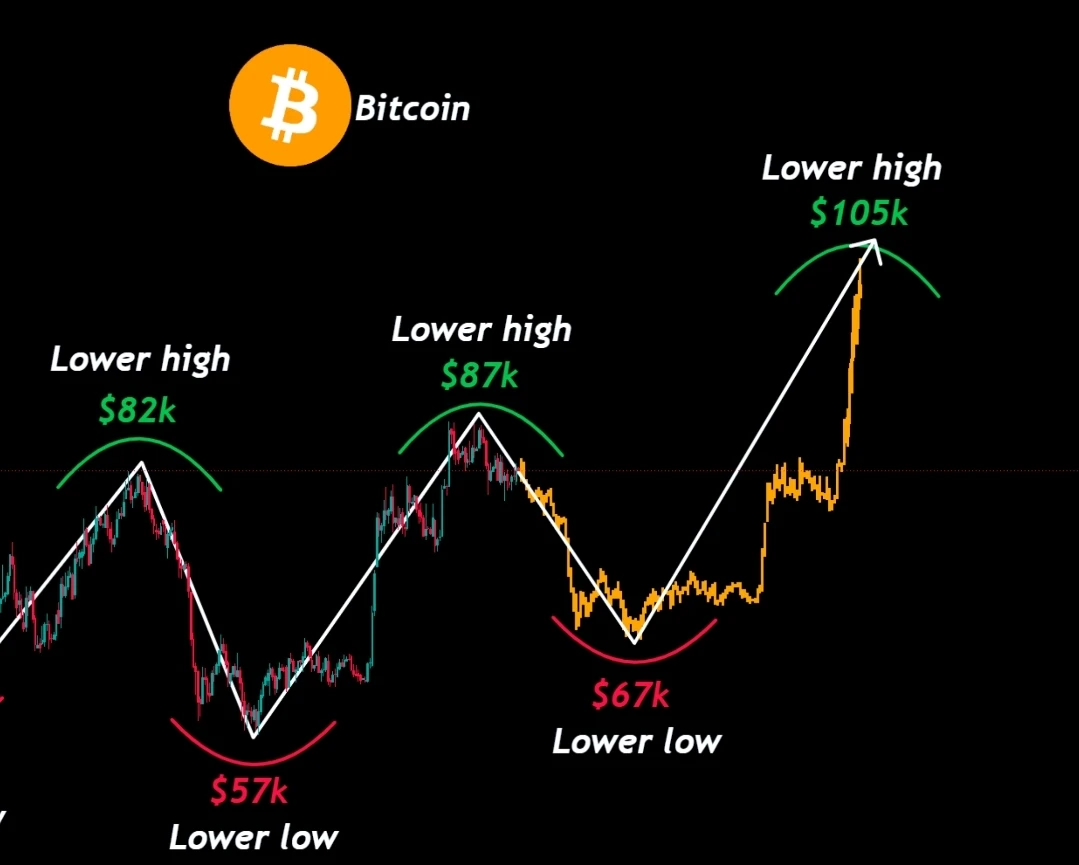
BITCOIN $BTC RECLAIMING MOVING AVERAGE SUPPORT FOR A BULLISH CONTINUATION REBOUND ARE BULLS TARGETING $84,028.90 NEXT?
Pair: $BTC /USDT
Direction: LONG
Entry Price: 81,787.10
Target Levels (Take Profit)
TP 1: 82,627.80 +1.03%
TP 2: 83,188.20 +1.71%
TP 3: 84,028.90 +2.74%
Stop Loss
🛑 SL: 80,666.20
Technical Breakdown
BTC ($81,787) executed an impulsive bounce following a sharp downward extension, printing a reversal green candle that reclaimed local support. This behavior reflects healthy buyer absorption and prepares the asset for a structural continuation toward overhead targets.
Price
BTC-2.27%
This is a BIGG UPDATE by NADRA!!
Now you can change your photo on CNIC, if you don't like it, just like your DP.
Pakistanis can now update their Computerised National Identity Card (CNIC) photographs and permanent addresses from home through NADRA’s Pak ID mobile application.
Esa na ho kuch loug har haftay apni photo badal rahay houn ID card pe!
By tajasus
post-image
$PI Why is it still falling despite large capital inflows? There is only one reason: the price is being suppressed for accumulation. Under normal market conditions, more inflows should mean a price increase, while more outflows should mean a price decline.
post-image
PI-1.92%
🚨 Is Wall Street preparing to kick Ethereum out? Nearly $800 million withdrawn in 10 days—something really seems off with ETH this time!
Let me say something that may offend ETH diehards: What Ethereum lacks most right now is not positive news, but real buying pressure!
From September 29 to October 12, the U.S. spot Ethereum ETFs saw net outflows for 10 consecutive trading days, totaling approximately $783 million! On October 12 alone, $85.4 million flowed out, with BlackRock's ETHA accounting for approximately $75.1 million of that.
What does this mean? Everyone is verbally calling for insti
post-image
ETH-3.65%
$SOXS Something is off with this data. Trading volume was 474.7M, and the price surged from 36.57 to 44.55, up 19.26% over 24 hours, closing at 44.40. This isn't an ordinary rebound—someone is aggressively accumulating.
I entered my first batch at 38.2 yesterday, using 30% of my position. The reason was simple: semiconductors had fallen for four straight days, and SOXS, as a 3x inverse semiconductor ETF, showed heavy volume without breaking lower near its previous low. Then the volume exploded overnight. I watched the order book for an hour, and buy orders kept stacking higher as if money were
SOXS+13.48%
There's $150 in BloFin position vouchers up for grabs, and it's only for new accounts.
Sign up through my link and you get a shot at a share of the drop. It's exclusive to my community, guys.
What would you do with $150???
post-image
  • 1
$MU I stared at this chart for nearly half an hour, and reached for a trade twice.
1. Current price: 896.27, down 6.92% over 24h.
2. 889.45 is the dip formed at exactly 7 a.m., just 0.76% away.
3. The 20-day moving average above is still 3.51% higher.
4. The range high is more than 8% away, leaving a large gap in between.
A 3.51% upside versus 0.76% downside works out to 4.6 to 1.
The numbers look attractive, I admit my hand got itchy again.
But this is the middle of a decline, not the bottom.
If I do make a move, I’ll wait for it to reclaim the moving average on its own.
(Not investment advi
post-image
MU-7.04%
Still long on $ETH To Be Clear
Just using another account to facilitate the trade.
Im not going to miss out on gains! 😉
Copy trading now available on AlphaX!
Will look into to this further tomorrow.
FN Everyone!
🔥🐶🔥
ETH-3.65%
Layout: Bitcoin, Ethereum, Dogecoin
live-cover
LIVE880
  • 4
10.15 Day 2
Yesterday’s 100u task has been completed
Today, continue on the road to growing the account $XAUUSD
post-image
XAUUSD+0.86%
Load More

Join 40 M users in our growing community

⚡️ Join 40 M users in the crypto craze discussion

💬 Engage with your favorite top creators

👍 See what interests you

Trending Topics

USSeptemberCPITopsEstimates

35.86k Views2.28k Discussing

US September CPI rose 3.7% YoY, above the 3.6% estimate; core CPI rose 2.6%, also above the 2.5% estimate. With inflation topping forecasts across the board, how will rate hike expectations shift? How will BTC react? Share your view.

DrLinHanSpeaksAtOxfordUnion

135.19k Views1.85k Discussing

GateWCTCS9GlobalTradingCompetition

37.49k Views6.15k Discussing

View More