









#ANTPreMarketFuturesNowLive
$ANT Pre-Market Futures Near $96.90: Are Expectations Already Priced In, or Does Real Price Discovery Begin on Nasdaq?
As of November 17, 2026, anticipation surrounding Anthropic’s historic public debut has moved directly into live price action. With Anthropic scheduled to set its final offering price tomorrow evening, Wednesday, November 18, and begin trading on the Nasdaq Global Select Market on Thursday, November 19 under the ticker $ANT, pre-market futures are already giving traders an early look at market sentiment currently trading near $96.90.
Sitting roughly 24% to 38% above Anthropic’s official preliminary S-1 marketed range of $70.00 to $78.00 per share, $96.90 raises a critical question for active traders: are pre-market futures already pricing in peak IPO euphoria, or will true institutional price discovery only begin once Nasdaq order books open on November 19?
What $96.90 Pre-Market Futures Tell Us Right Now
The premium embedded in $96.90 reflects extraordinary institutional appetite ahead of Wednesday’s pricing:
• Massive Oversubscription: Institutional orders for Anthropic’s 825 million Class A share offering have reportedly reached nearly 6x to 7x oversubscribed, fueled by anchor interest including a reported $5 billion order from Altimeter and discussions among underwriters about potentially pricing at or even above the top end of the $70–$78 range.
• Implied Valuation Gap: While the $70–$78 range values Anthropic at $916 billion to $1.02 trillion on basic shares (and up to $1.40 trillion fully diluted), a $96.90 pre-market futures price extrapolates an implied valuation closer to $1.27 trillion on issued shares and roughly $1.74 trillion fully diluted—pricing in an immediate Day-1 listing pop before a single Nasdaq share has traded.
• Fundamental Backing: Traders bidding $96.90 are pointing to Anthropic’s $16.96 billion Q3 2026 revenue, $81 billion October annualized run-rate, and deep adoption across over 11,900 enterprise accounts generating $100K+ annually.
Why Pre-Market Futures Are Not the Final Verdict
Despite strong directional signals, pre-market perpetual futures are synthetic derivatives with relatively thin liquidity compared to primary U.S. equity markets. History including major 2026 tech listings shows why real price discovery begins only after the Nasdaq opening bell:
• True Institutional Float & Lock-Up Dynamics: Once $ANT lists on November 19, billions of dollars in mutual fund, pension, and passive index capital enter the real order book, alongside roughly 316 million employee and non-founder insider shares eligible for partial Day-1 liquidity and $26 billion in unrestricted strategic partner shares.
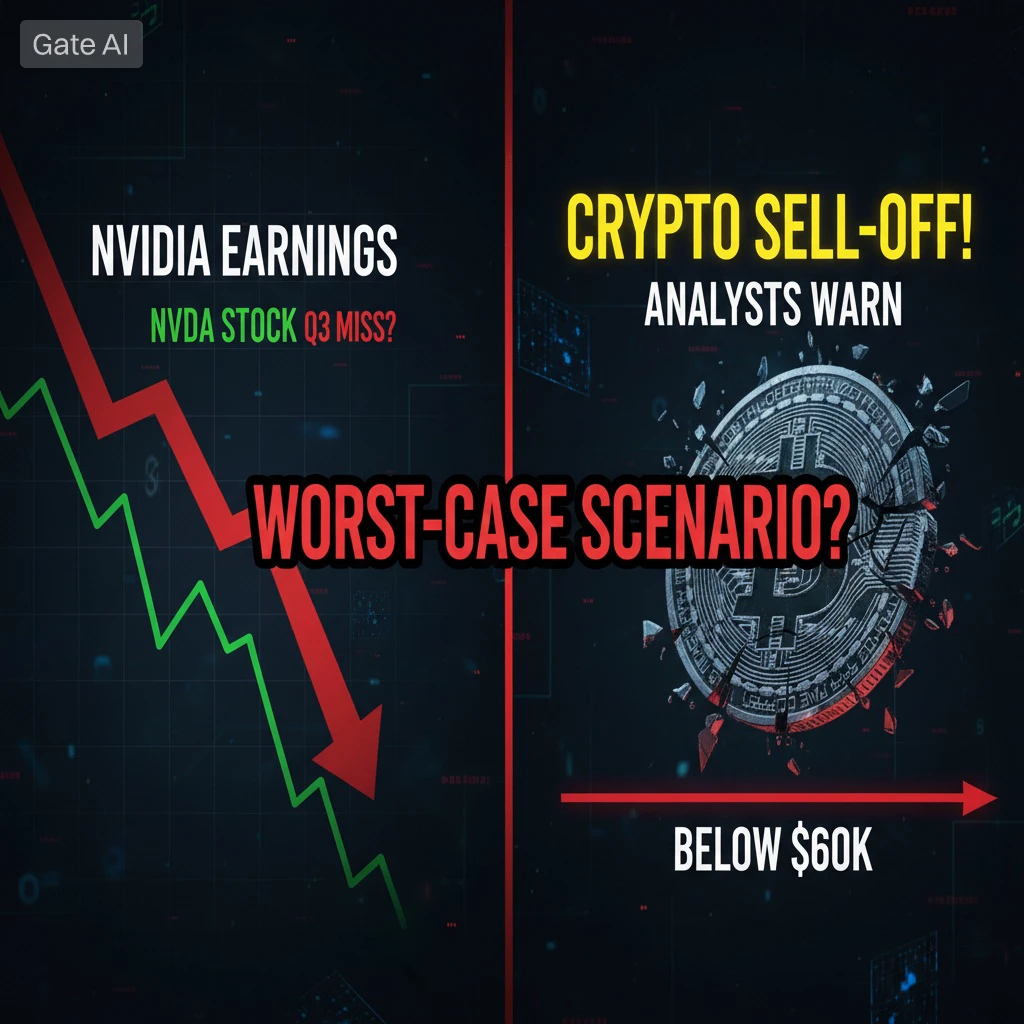
• The NVIDIA Catalyst Tonight: Before Anthropic even prices tomorrow evening, NVIDIA reports Q3 FY2027 earnings after today’s U.S. close. Any surprise in AI compute demand or forward guidance will immediately ripple through $ANT pre-market pricing overnight.
• Convergence Risk: Pre-market futures carry funding-rate costs and can swing violently if the final IPO price lands strictly inside the $70–$78 range rather than above it.
The Bottom Line
At $96.90, $ANT pre-market futures are already pricing in a strong Day-1 listing premium and heavy institutional oversubscription. While futures serve as a valuable real-time sentiment gauge ahead of tomorrow’s pricing decision, genuine two-way price discovery backed by deep institutional volume and post-listing fundamentals only begins when $ANT opens on Nasdaq on November 19. Managing leverage carefully around $96.90 is essential as synthetic expectations prepare to meet real equity liquidity. @Gate_Square
$ANT Pre-Market Futures Near $96.90: Are Expectations Already Priced In, or Does Real Price Discovery Begin on Nasdaq?
As of November 17, 2026, anticipation surrounding Anthropic’s historic public debut has moved directly into live price action. With Anthropic scheduled to set its final offering price tomorrow evening, Wednesday, November 18, and begin trading on the Nasdaq Global Select Market on Thursday, November 19 under the ticker $ANT, pre-market futures are already giving traders an early look at market sentiment currently trading near $96.90.
Sitting roughly 24% to 38% above Anthropic’s official preliminary S-1 marketed range of $70.00 to $78.00 per share, $96.90 raises a critical question for active traders: are pre-market futures already pricing in peak IPO euphoria, or will true institutional price discovery only begin once Nasdaq order books open on November 19?
What $96.90 Pre-Market Futures Tell Us Right Now
The premium embedded in $96.90 reflects extraordinary institutional appetite ahead of Wednesday’s pricing:
• Massive Oversubscription: Institutional orders for Anthropic’s 825 million Class A share offering have reportedly reached nearly 6x to 7x oversubscribed, fueled by anchor interest including a reported $5 billion order from Altimeter and discussions among underwriters about potentially pricing at or even above the top end of the $70–$78 range.
• Implied Valuation Gap: While the $70–$78 range values Anthropic at $916 billion to $1.02 trillion on basic shares (and up to $1.40 trillion fully diluted), a $96.90 pre-market futures price extrapolates an implied valuation closer to $1.27 trillion on issued shares and roughly $1.74 trillion fully diluted—pricing in an immediate Day-1 listing pop before a single Nasdaq share has traded.
• Fundamental Backing: Traders bidding $96.90 are pointing to Anthropic’s $16.96 billion Q3 2026 revenue, $81 billion October annualized run-rate, and deep adoption across over 11,900 enterprise accounts generating $100K+ annually.
Why Pre-Market Futures Are Not the Final Verdict
Despite strong directional signals, pre-market perpetual futures are synthetic derivatives with relatively thin liquidity compared to primary U.S. equity markets. History including major 2026 tech listings shows why real price discovery begins only after the Nasdaq opening bell:
• True Institutional Float & Lock-Up Dynamics: Once $ANT lists on November 19, billions of dollars in mutual fund, pension, and passive index capital enter the real order book, alongside roughly 316 million employee and non-founder insider shares eligible for partial Day-1 liquidity and $26 billion in unrestricted strategic partner shares.
• The NVIDIA Catalyst Tonight: Before Anthropic even prices tomorrow evening, NVIDIA reports Q3 FY2027 earnings after today’s U.S. close. Any surprise in AI compute demand or forward guidance will immediately ripple through $ANT pre-market pricing overnight.
• Convergence Risk: Pre-market futures carry funding-rate costs and can swing violently if the final IPO price lands strictly inside the $70–$78 range rather than above it.
The Bottom Line
At $96.90, $ANT pre-market futures are already pricing in a strong Day-1 listing premium and heavy institutional oversubscription. While futures serve as a valuable real-time sentiment gauge ahead of tomorrow’s pricing decision, genuine two-way price discovery backed by deep institutional volume and post-listing fundamentals only begins when $ANT opens on Nasdaq on November 19. Managing leverage carefully around $96.90 is essential as synthetic expectations prepare to meet real equity liquidity. @Gate_Square