




Share your thoughts
placeholder
Article
CRYPTO THINGS YOU MAY HAVE MISSED — LAST 24 HOURS | 5 SEPTEMBER 2026
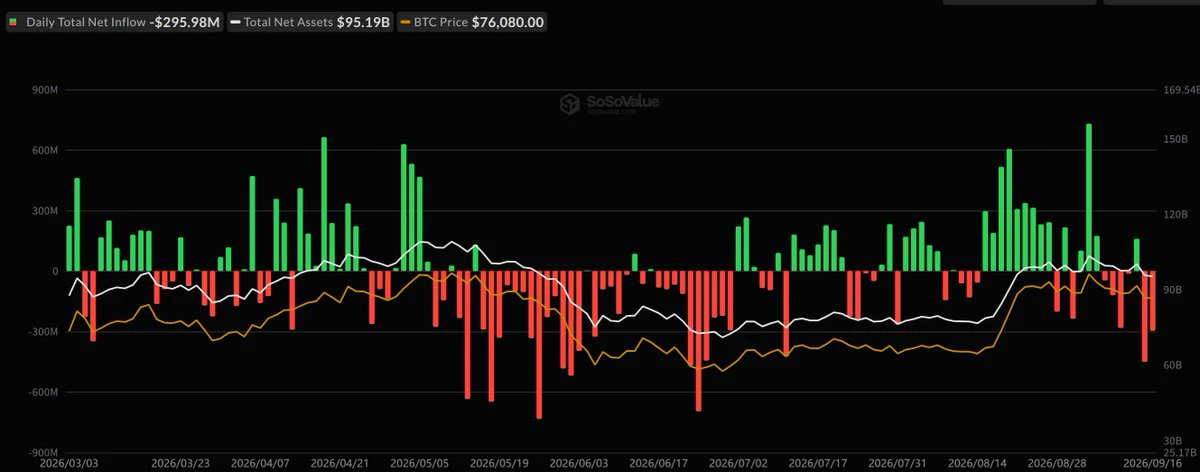
The market looked weak—but institutions quietly poured more than $1.2B into bitcoin:native and $ETH funds last week.
The price and capital flows are telling different stories.
🧵👇
1/2 — ETF DEMAND SURVIVED THE MACRO SHOCK
US spot ETFs recorded approximately:
🟢 bitcoin:native: $986.7M weekly net inflow
🟢 $ETH: $215.3M weekly net inflow
🟢 Combined: $1.20B
Friday alone added $174.6M to Bitcoin funds and $25.9M to Ethereum funds—even after the stronger payroll report increased Fed-hike risk.
Investor takeaway: institutions co
post-image
BTC-2.35%
ETH-2.49%
HBAR+2.14%
XLM+2.87%
XDC+1.44%
A few days ago, $ARB broke out on heavy volume and held above the moving averages. I reminded myself not to hesitate and added to my long position with the trend. But the wicks early in the breakout were genuinely frightening, and my unrealized profit briefly shrank by more than half.
After the price strengthened again, I closed 70% of the position first and placed a trailing stop on the remaining 30%. Some people prefer to exit all at once, but taking profits in batches suits me better. Even if the price continues to surge on momentum later, I still have a position to participate with and won
post-image
ARB+41.58%
ZEC+1.59%
BNB+6.59%
Your conviction is being tested on $NET here. When $PONS had multiple -60% drawbacks the holders that believed it would hit $1b did not question it during the rough times. Same thing for $NET, it will eventually hit $1b and we do not question but enjoy the process. The big bounce is coming, patience.
post-image
NET-2.00%
PONS+26.57%
Crypto Signals and Trding Insights
live-cover
LIVE1,372
Everyone’s staring at ADA’s range—but the 4H just whispered a secret that most will ignore.

$ADA /USDT - SHORT

Trade Plan:
Entry: 0.2187 – 0.2199
SL: 0.2249
TP1: 0.2151
TP2: 0.2122
TP3: 0.2080

Why this setup?
- ADA/USDT is coiling at 0.2193 with a 55% short bias, but the 1D is still "range"—not a breakout.
- RSI 15m at 51.19 = zero momentum; ATR 1H shows a tight 0.0023 squeeze—volatility is loading.
- Why now? The 4H structure says the path of least resistance is down to TP1 0.2151, yet the invalidation at 0.2110 is a trap door for late shorts.
- If price rejects 0.2199 (entry high
ADA+3.65%
This trend doesn’t even require me to think—the account is out there dancing on its own.

During the repeated intraday fluctuations, $BTR surged to 0.17647. It looked like a breakout on the surface, but the volume didn’t follow, so there was simply no one buying up there. I opened a short position directly at that level, waiting for the false breakout to reverse on its own.

I took another look before the close, and 0.04843 had already returned to my expected range, putting +1428.51% in my pocket. I held the short without letting go, trusting this resistance level. I didn’t make a rash move
post-image
BTR-2.78%
BNB+6.59%
DOGE+6.34%
$907,000 A certain trader made two FOMO trades i, resulting in a total loss of $907,000
live-cover
LIVE1,596
Move to Hawaii they said.
It’s paradise they said.
So far, wild fires, tsunami, and now this.
Stay safe everyone.
post-image
Why is everyone long MU/USDT while the 4h timeframe is screaming SHORT with 84% confidence?

MU/USDT - SHORT

Trade Plan:
Entry: 1015.27 – 1016.89
SL: 1026.20
TP1: 1008.49
TP2: 1003.43
TP3: 995.84

Why this setup?
- The 1D trend is bullish, but the 4h setup just armed a SHORT at 1016.08 — that’s a classic higher-timeframe pullback trap.
- RSI on 15m is at 47.64, showing zero momentum for a bounce — sellers are in control of the micro-move.
- ATR 1h at 3.24 means the expected move is tight, but TP1 at 1008.49 is only 0.75% away — low risk, high probability.
- Why now? The entry zone (1
MU+0.28%
$FHE Signal】long: 1H volume-backed dip and support + 4H high-level consolidation
$FHE Current price 0.1172. After rising to 0.1408 on the 4H chart, the price pulled back, interrupting the bulls’ proactive advance. The 1H MACD bearish histogram is expanding, indicating short-term selling pressure is being released. Buy orders are densely stacked around 0.1160, while the 1H Bollinger lower band is at 0.0990. The latest candle closed with a lower wick, with clear wick-buying action appearing around 0.1155.
🎯Direction: long
⚡Entry/limit order: 0.116848 - 0.117200
🛑Stop-loss: 0.116028
🚀Target
FHE+11.86%
BTC+0.29%
ETH+1.17%
SOL+1.56%
Most traders are staring at SNDK wrong—this 4h signal says the range is about to break ugly.

$SNDK /USDT - SHORT

Trade Plan:
Entry: 1760.48 – 1765.58
SL: 1794.81
TP1: 1739.20
TP2: 1723.31
TP3: 1699.48

Why this setup?
Why now?
- Price pinned at 1763 with RSI (15m) at 43.65—momentum is fading, not building.
- 1D trend is *range*, but SHORT bias at 77% confidence means the floor is cracking.
- Targets are stacked: TP1 1739 → TP2 1723 → TP3 1699—that’s a 3.6% drop from entry, with ATR (1h) at 10.18 confirming room to run.
- If longs can’t hold 1765.58, the trap door opens. This is a
SNDK+1.83%
📊 $CRV looking interesting.
The level to watch is $0.40–$0.45 on the weekly.
• Flip + hold ✓ → 1W 200EMA next
And if $CRV flips the 1W 200EMA into support, then $1.0–$1.4 comes into play for the med term. 📈✍️
#CRV #CRVUSDT #Curve #Alts #Crypto
post-image
CRV+8.93%
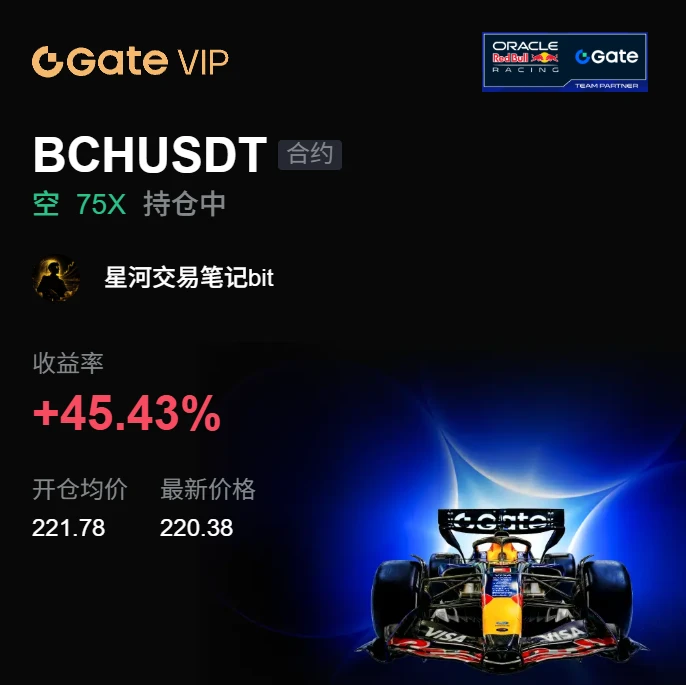
I originally wanted to cut my losses and sacrifice the meat to the heavens, but the ritual failed—the meat roasted itself. 🔥 While everyone else was running, I took another look at the order book.
At the time, the screen was filled with panic, but the bottom held steady, funds quietly entered, and the volume-price action was not bad. I judged that this was just a fake drop, so I opened a long position around 216.97 without hesitating for too long. The market has now reached 231.06, with a +604.09% return. Nailed it.
The early phase was truly sluggish, but the breakout feels just as rewarding.
post-image
LAB+0.51%
ZEC+1.59%
It was down 6% yesterday, then exploded higher today! Has SoftBank boarded the AI roller coaster?
SoftBank's recent stock performance has made the meaning of “high volatility” crystal clear.
SoftBank fell 6.42% on September 2, but by September 4, its stock had surged 11.78%, closing at 5,590 yen.
Behind this move, on the one hand, is the rapid recovery in market risk appetite, and on the other, the renewed strength of the AI sector. Japan and South Korea's markets have recently been clearly driven by the semiconductor and AI supply chains, with Samsung Electronics and SK Hynix in South Korea,
post-image
SK Hynix+3.19%
  • 41
I originally just wanted to freeload a breakfast, but the market ended up wrapping me in dumplings for half a year.
During the repeated intraday oscillations, the bottom never broke down. Someone stepped in to buy every pullback, while capital quietly entered the market. I judged that the bottoming process was nearly over, so I directly opened a long near 833.19.
The price has now climbed to 1018.4, $ZEC this move really delivered the answer, with the return on the position reaching +1578.39%. Those who stayed on board should be grinning in their sleep. It was truly sluggish at first, but the
post-image
ZEC+1.59%
ADA+3.65%
ETH+1.21%
Is HYPE’s new all-time high just the beginning? The real test comes after $88!
HYPE broke through $88 and set a new all-time high, and this kind of move is most likely to ignite market sentiment.
Why does a new high matter? Because once the price breaks above all previous highs, the pressure from holders trapped at higher levels is significantly reduced, and the market begins to enter a new phase of “price discovery.” At this point, the market’s focus also shifts from “Can it break through?” to “Where is the next stop?”
But the stronger the rally, the less you should focus solely on the gains.
HYPE+1.10%
  • 48
Everyone’s staring at the 1D range, but the 4h clock just struck midnight for $MU /USDT.

$MU /USDT - SHORT

Trade Plan:
Entry: 1015.04 – 1016.60
SL: 1025.51
TP1: 1008.56
TP2: 1003.71
TP3: 996.45

Why this setup?
- RSI on the 15m is already at 45.18—that’s not oversold, that’s a bull trap losing its breath.
- With ATR at 3.10 on the 1h, the move down from 1015.82 to TP1 (1008.56) is just 2.3x the average hourly range—easy prey.
- The “Armed” status means the trigger is live; we don’t need a trend flip, just a range rejection.
- Why now? Because the 1D is sideways, and sideways always
MU+0.28%
#Bots I'm trading MEMECOINUSDT with the Futures Grid bot on Gate. Join me!
post-image
Many people are focused on the key levels above, while overlooking the key levels below slowly moving higher. $BULLA After this move was pushed up from around 0.028584, the floating profit on my long position once reached +1949.58%, but I never chose to exit everything at once.
Because in trading, taking profits and letting profits run are inherently contradictory. My approach is simple: first turn 70% into real cash, move the take-profit level for the remaining 20% above the entry price, give the market some room, and leave myself a way out.
The price is currently consolidating repeatedly aro
post-image
BULLA+195.87%
XRP+1.07%
BNB+6.59%
Load More

Join 40 M users in our growing community

⚡️ Join 40 M users in the crypto craze discussion

💬 Engage with your favorite top creators

👍 See what interests you

View More