Square
Following
Hot
News
Profile
Share your thoughts
placeholder
Article
#BTCBackAbove80K
Bitcoin's recovery above $80,000 puts the market at a critical turning point
Bitcoin is trading around $80,500 on November 5, following a strong recovery from the $75,600 area. BTC has gained approximately 4.2% over the past 24 hours, with the latest reported trading range extending from roughly $75,627 to $81,079. The market capitalization is approaching $1.62 trillion, while daily trading volume is around $40 billion.
The important development is not simply that Bitcoin has reclaimed $80,000. It is how quickly buyers returned after the recent decline and how price responded
post-image
BTC-0.67%
  • 9
  • 2
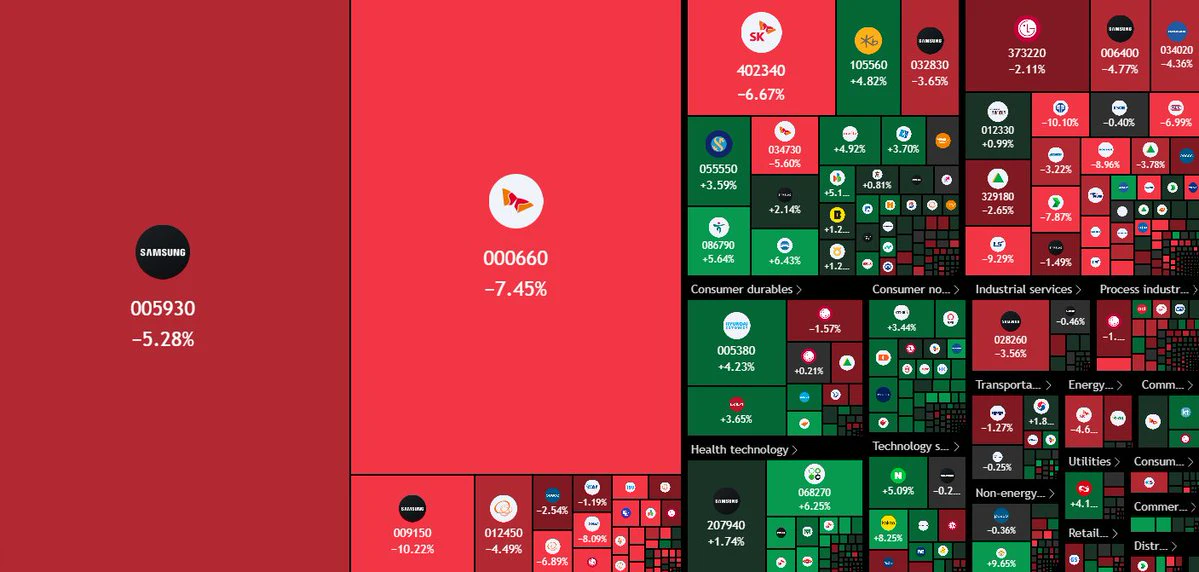
🇰🇷 NOW: Over $100,000,000,000 wiped from Samsung and SK Hynix within the FIRST HOUR of trading.
South Korea’s KOSPI falls 3.5% as chip stocks lead the selloff, while Japan and Australia trade higher.
SK Hynix is down 7.4% and Samsung is down 5.3%.
post-image
SK Hynix-7.02%
Trenches
ZIG
Z
bade
b
ZIG
0x8c...1145
Market Cap
$.
Change
.
24h Vol
$.
Holders
.
BTC
B
bade
b
BTC
C5xp...pump
Market Cap
$.
Change
.
24h Vol
$.
Holders
.
HIGH
H
bade
b
HIGH
7ymF...high
Market Cap
$.
Change
.
24h Vol
$.
Holders
.
STONK
S
bade
b
STONK
6GmA...UNgx
Market Cap
$.
Change
.
24h Vol
$.
Holders
.
AMD
A
bade
b
AMD
DDmG...pump
Market Cap
$.
Change
.
24h Vol
$.
Holders
.
$SNXX Down 15% in a day, dropping from 6.69 to 4.93, with a surge in trading volume to 495 million—this pattern is all too familiar. I’ve been through this “deep squat in a bull market” several times during the previous three halving cycles. Let’s go straight to the data: at 5.12, the price is only 3.8% above the 24-hour low, while the median correction during months 6–9 after the previous three halvings was -22% to -31%, followed by an average rebound of 18%–25% within 30 days. This time, the drop from 6.69 has already reached 23.4%, right in the second historical correction range, and the ti
  • 7
  • 2
🚀 Market Pulse: Catching the Strongest Momentum Plays Today
Looking at today's active gainers, capital is aggressively rotating into high-momentum tokens and breakout assets. Here is my breakdown of what's driving the action:
* $ELSA (ELSAUSDT): Leading the pack with a powerful +59.81% surge, currently holding strong at $0.10127.
* $APP (APPUSDT): Applovin Corporation continuing its impressive push, up +36.14% to $327.7.
* $JCT (JCTUSDT): Building solid continuation momentum with a +35.12% gain at $0.005536.
* $MONITOR (MONITORUSDT): Showing strong speculative volume, pushing up +34.02% t
ELSA+5.82%
APP+0.12%
JCT-3.26%
MONITOR+4.06%
PTB-13.00%
  • 1
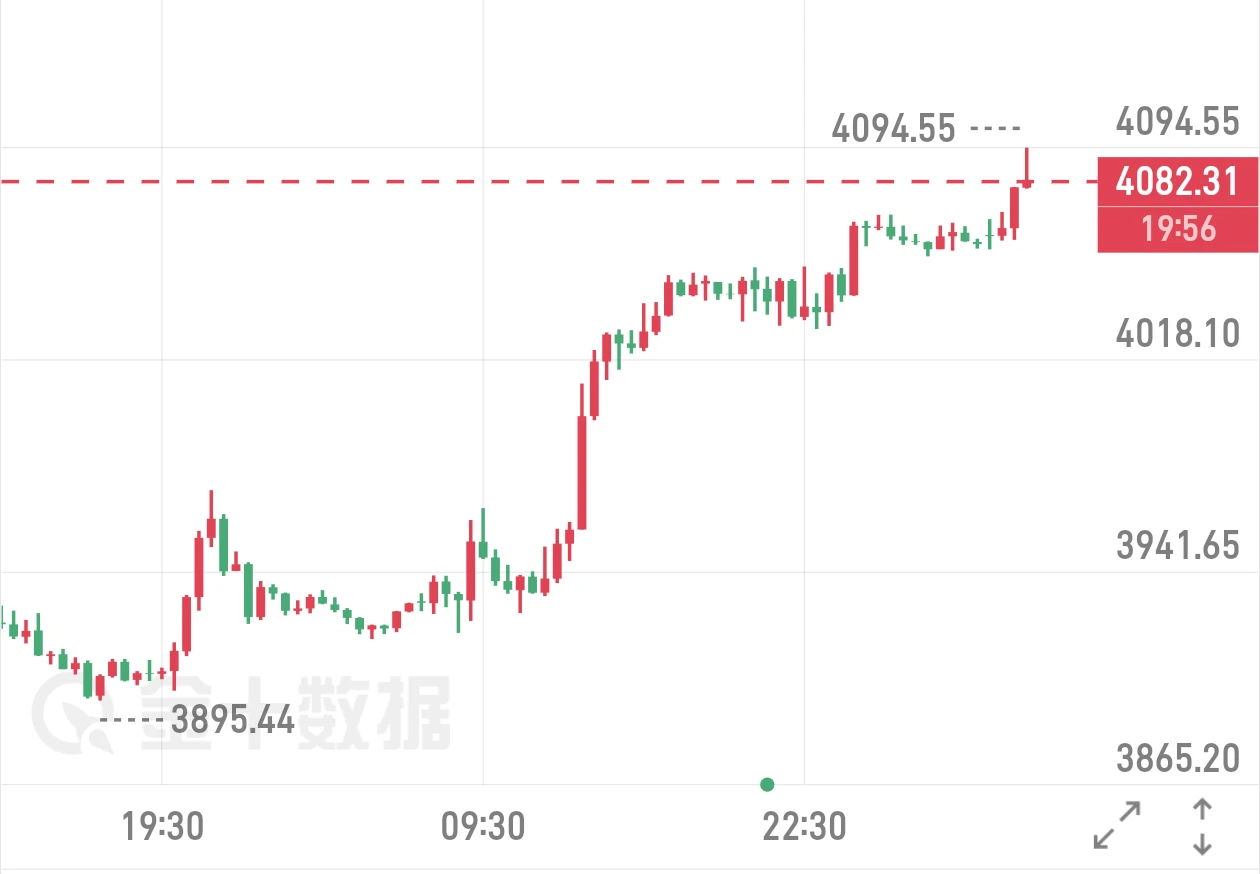
$XAUT 11.5 Gold Outlook
The 4074 resistance level we were watching yesterday has been broken; from here, the focus can shift to buying pullbacks
Looking at the chart, although the weekly trend was previously downward, gold has stabilized and rebounded from its lows in this move; prices are gradually climbing on the daily chart, short-term momentum continues to improve, forming a clear upward recovery structure
Trade reference: Go long in the 4045-4060 range, targeting 4095 and 4140
post-image
XAUT+0.30%
New streamer bts market
live-cover
LIVE1,535
#BTCBreaksPastMidtermBearishPattern #ShareWeekly
BTC Breaks the Historical Midterm Election Pattern: Is Bitcoin Preparing for Its Next Major Move?
Bitcoin is showing renewed strength, and the latest price action is making the market rethink one of its long-standing historical patterns. Historically, Bitcoin has often experienced bearish conditions around U.S. midterm election periods. However, the current cycle is presenting a different picture. BTC has recovered strongly, moved back above $80,000, and is approaching a critical resistance zone that could determine its next major direction.
As
BTC-0.67%
  • 2
#闪迪# On August 30, I gave a wealth growth target of 1153, which was achieved. On October 30, I gave a wealth growth target of 955, and it's getting close. Today, wealth growth is up 7.9% to 1014. I share my thoughts in image 2. ​​​$SNDK ‌
SNDK-0.18%
$PNUT Aggressively short now, then buy at $0.00320. Entry price: 0.0367–0.0373; stop-loss: 0.04384. Short $PNUT 👇
post-image
PNUT-1.27%
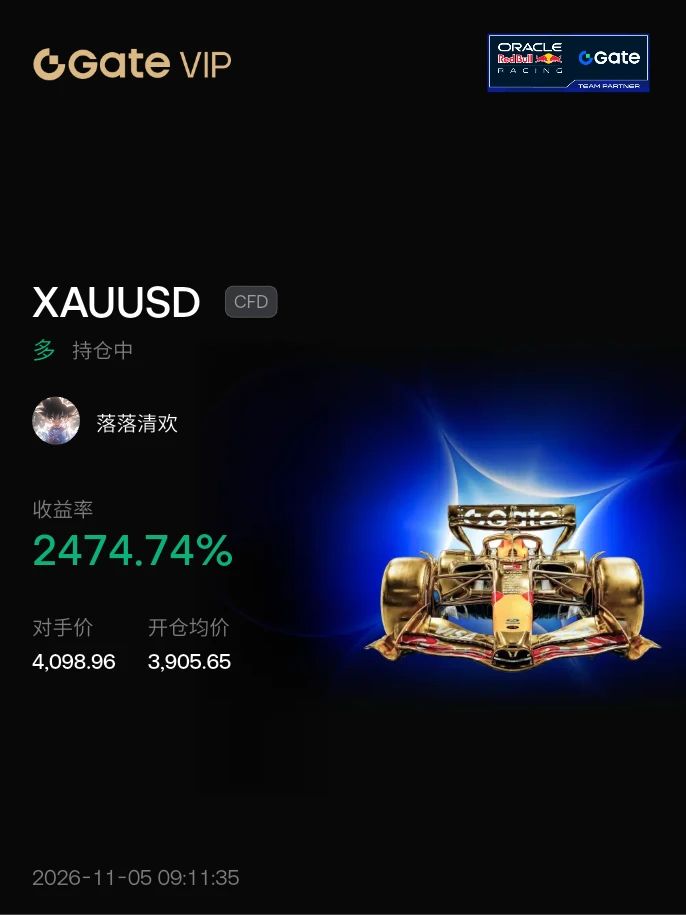
#晒出我的持仓收益 Guys, are you still holding?
post-image
  • 1
11.05 Qiqi on Gold Morning Commentary: Strong Early-Morning Rally; Focus on Buying Dips With the Trend!
ADP's bearish surprise overnight briefly pressured gold prices, but support held firm after a quick pullback. Bulls made another push this morning, driving the price to a high of 4096; it is now at 4091, pausing for a slight consolidation. After yesterday's shakeout, the bullish trend is clear. Initial jobless claims data are due tonight, leaving room for further gains.
Short-term moving averages are all spreading upward, and the MACD red bars continue to expand, keeping upward momentum inta
post-image
XAU+0.38%
  • 2
KOR Launchpool: Stake USDT, GT, or KOR to Earn a Share of 36,000,000 KOR
https://www.gate.com/share/act/1581ee1b
post-image
GT-2.41%
  • 5
  • 2
mubarak:native
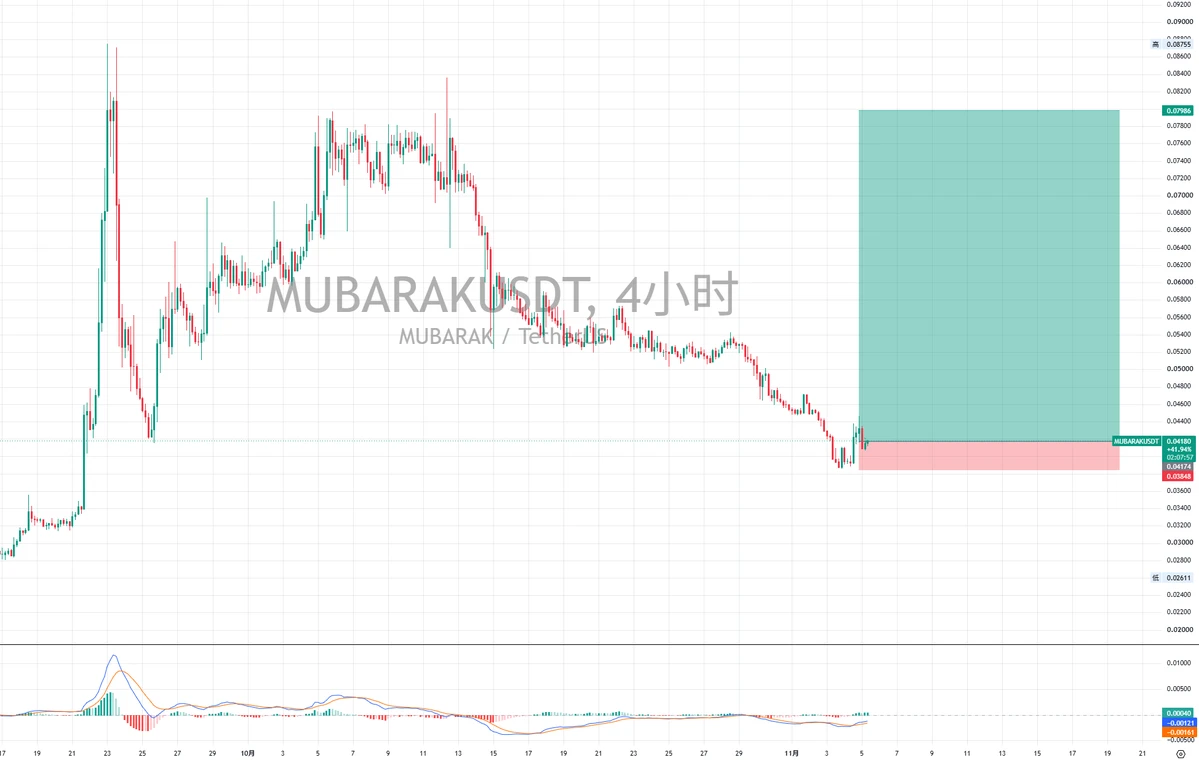
This market is going crazy. Is the bull run back?
mubarak Open a small long position at the current price, with a stop-loss at a new low on the lower timeframe, 0.0385, and a target of 0.08!
After having so many assets stolen, shouldn’t they find a way to make it back? The best way is to pump the price, collect funding fees, and trigger liquidations!
post-image
MUBARAK+0.17%
🪙 ETH | The Short Battle Rages On, While the Bulls Are Running Out of Steam
$BTC That short yesterday was indeed mistimed. Shorting hard at the breakout level was like handing a knife to the liquidation army. I got the direction wrong, and I have to own it.
$ETH Bullish sentiment here has already reached a boiling point. The daily chart is in overbought territory, and the 4-hour chart is under so much pressure it can barely breathe, hanging on by its last thread.
Overbought markets are best at sudden wick attacks, specifically taking out people who can’t hold onto their positions. At its co
post-image
BTC-0.67%
ETH-1.26%
November 5 BTC/ETH Mi Shen Strategy
Yesterday’s strategy already told everyone that midterm elections have historically resulted in seat losses, so there’s no need to be overly pessimistic. Instead, we should think, “When others are fearful, I am greedy.” Last night’s sharp rally confirmed that Mi Shen’s call was spot on. Let’s keep pace and take a look at today’s Mi Shen strategy:
BTC: Last night’s rally brought price back near the upper boundary of the 78500-81700 range. Today, watch whether price can challenge resistance at 81700. On the first spike into this area, you can consider an early
ETH-1.23%
  • 1
  • 1
Democrats Continue Pushing the CLARITY Act! With the SEC Potentially Gaining More Authority, Is U.S.
live-cover
LIVE1,873
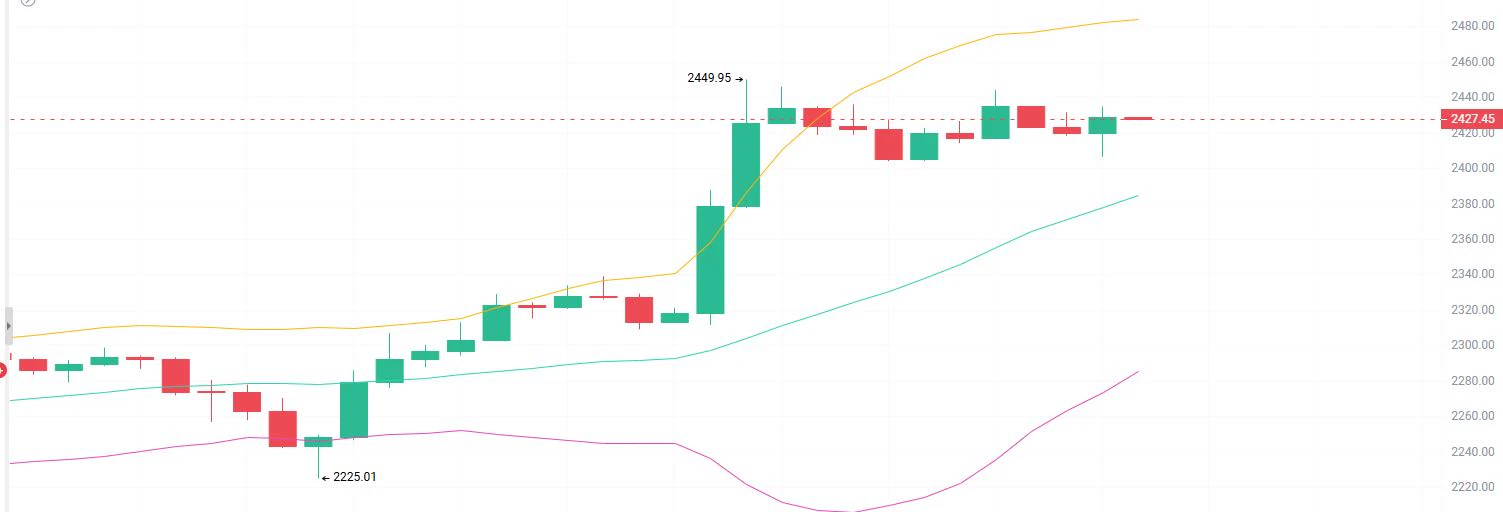
11.5 ETH Analysis
Analysis: Go long on a pullback to around 2390–2410, with a stop at 2375. First target: 2450; second target: 2480.
The 1H chart shows a strong rebound starting from the low of 2225.01, with consecutive rallies reaching a swing high of 2449.95. The current price is 2430.85. Short-term moving averages are aligned bullishly and trending upward, providing support, while price has consistently remained above them. Bullish momentum has been fully unleashed, and the uptrend structure remains intact. The support zone has attracted strong buying on pullbacks, keeping the overall trend
post-image
ETH-1.26%
Money is transferred from impatient people
to the pockets of patient people
So, long live patience!
post-image
Load More

Join 40 M users in our growing community

⚡️ Join 40 M users in the crypto craze discussion

💬 Engage with your favorite top creators

👍 See what interests you

Trending Topics

BTCBackAbove80K

10.46k Views41.05k Discussing

After a sharp dip, Bitcoin climbed back above $80,000 on May 9 and is currently trading around $80,200. Over 50,000 traders were liquidated in the past 24 hours amid fierce long-short battles. The recurring Iran-U.S. tensions remain the primary short-term variable. Following U.S. airstrikes, Iran\'s Revolutionary Guard claimed to have breached the Strait of Hormuz defense line, leaving the ceasefire outlook uncertain. On the technical side, the daily SMA20 ,$77,970 serves as key support, with the RSI recovering from oversold levels to 43. The $80,000 level is both a psychological barrier and a bull-bear dividing line.Holding above it could lead to a challenge at $85,000, while a break may trigger a retest of the $77,000 area.

DemocratsWinBothChambers

15k Views403 Discussing

GateLaunchesTaiwanStockTrading

13.42k Views261 Discussing

View More