Share your thoughts
placeholder
Article
A subscriber asked me: Why are there so many NPDs among Chinese women? In many cases, it is not that women are inherently more likely to become NPDs, but that a personality and power structure is continuously reinforced by everything from family education and dating culture to the division of labor in marriage and social system design. Many girls are raised from an early age with messages such as “raise daughters in affluence,” “you deserve better,” and “you must find a more outstanding man in the future.” The emphasis is repeatedly placed on raising their standards for a partner, while they a
post-image
$UAI was still at 0.51 an hour ago, but has now plunged straight back to 0.45, with $107 million in 24-hour trading volume. The volatility of this kind of meme coin is more intense than SOL’s entire week. Don’t stare at the candlestick chart asking why: the Fed’s hawkish March meeting minutes were released early today, sending the probability of a June rate cut from 73% down to 61%, while the 2-year U.S. Treasury yield surged to 4.8% and Nasdaq futures plunged. AI-sector coins were hit the hardest because these high-beta assets are the first to be drained of liquidity.
I ran a correlation bac
UAI+26.90%
SOL-1.53%
NAS100-0.44%
BTC-1.43%
USIDX+0.15%
The more sharply $PONS rises, the harder it falls—by ten times as much.
post-image
PONS-3.04%
9.5, BTC, morning view

Good morning, have a great weekend!

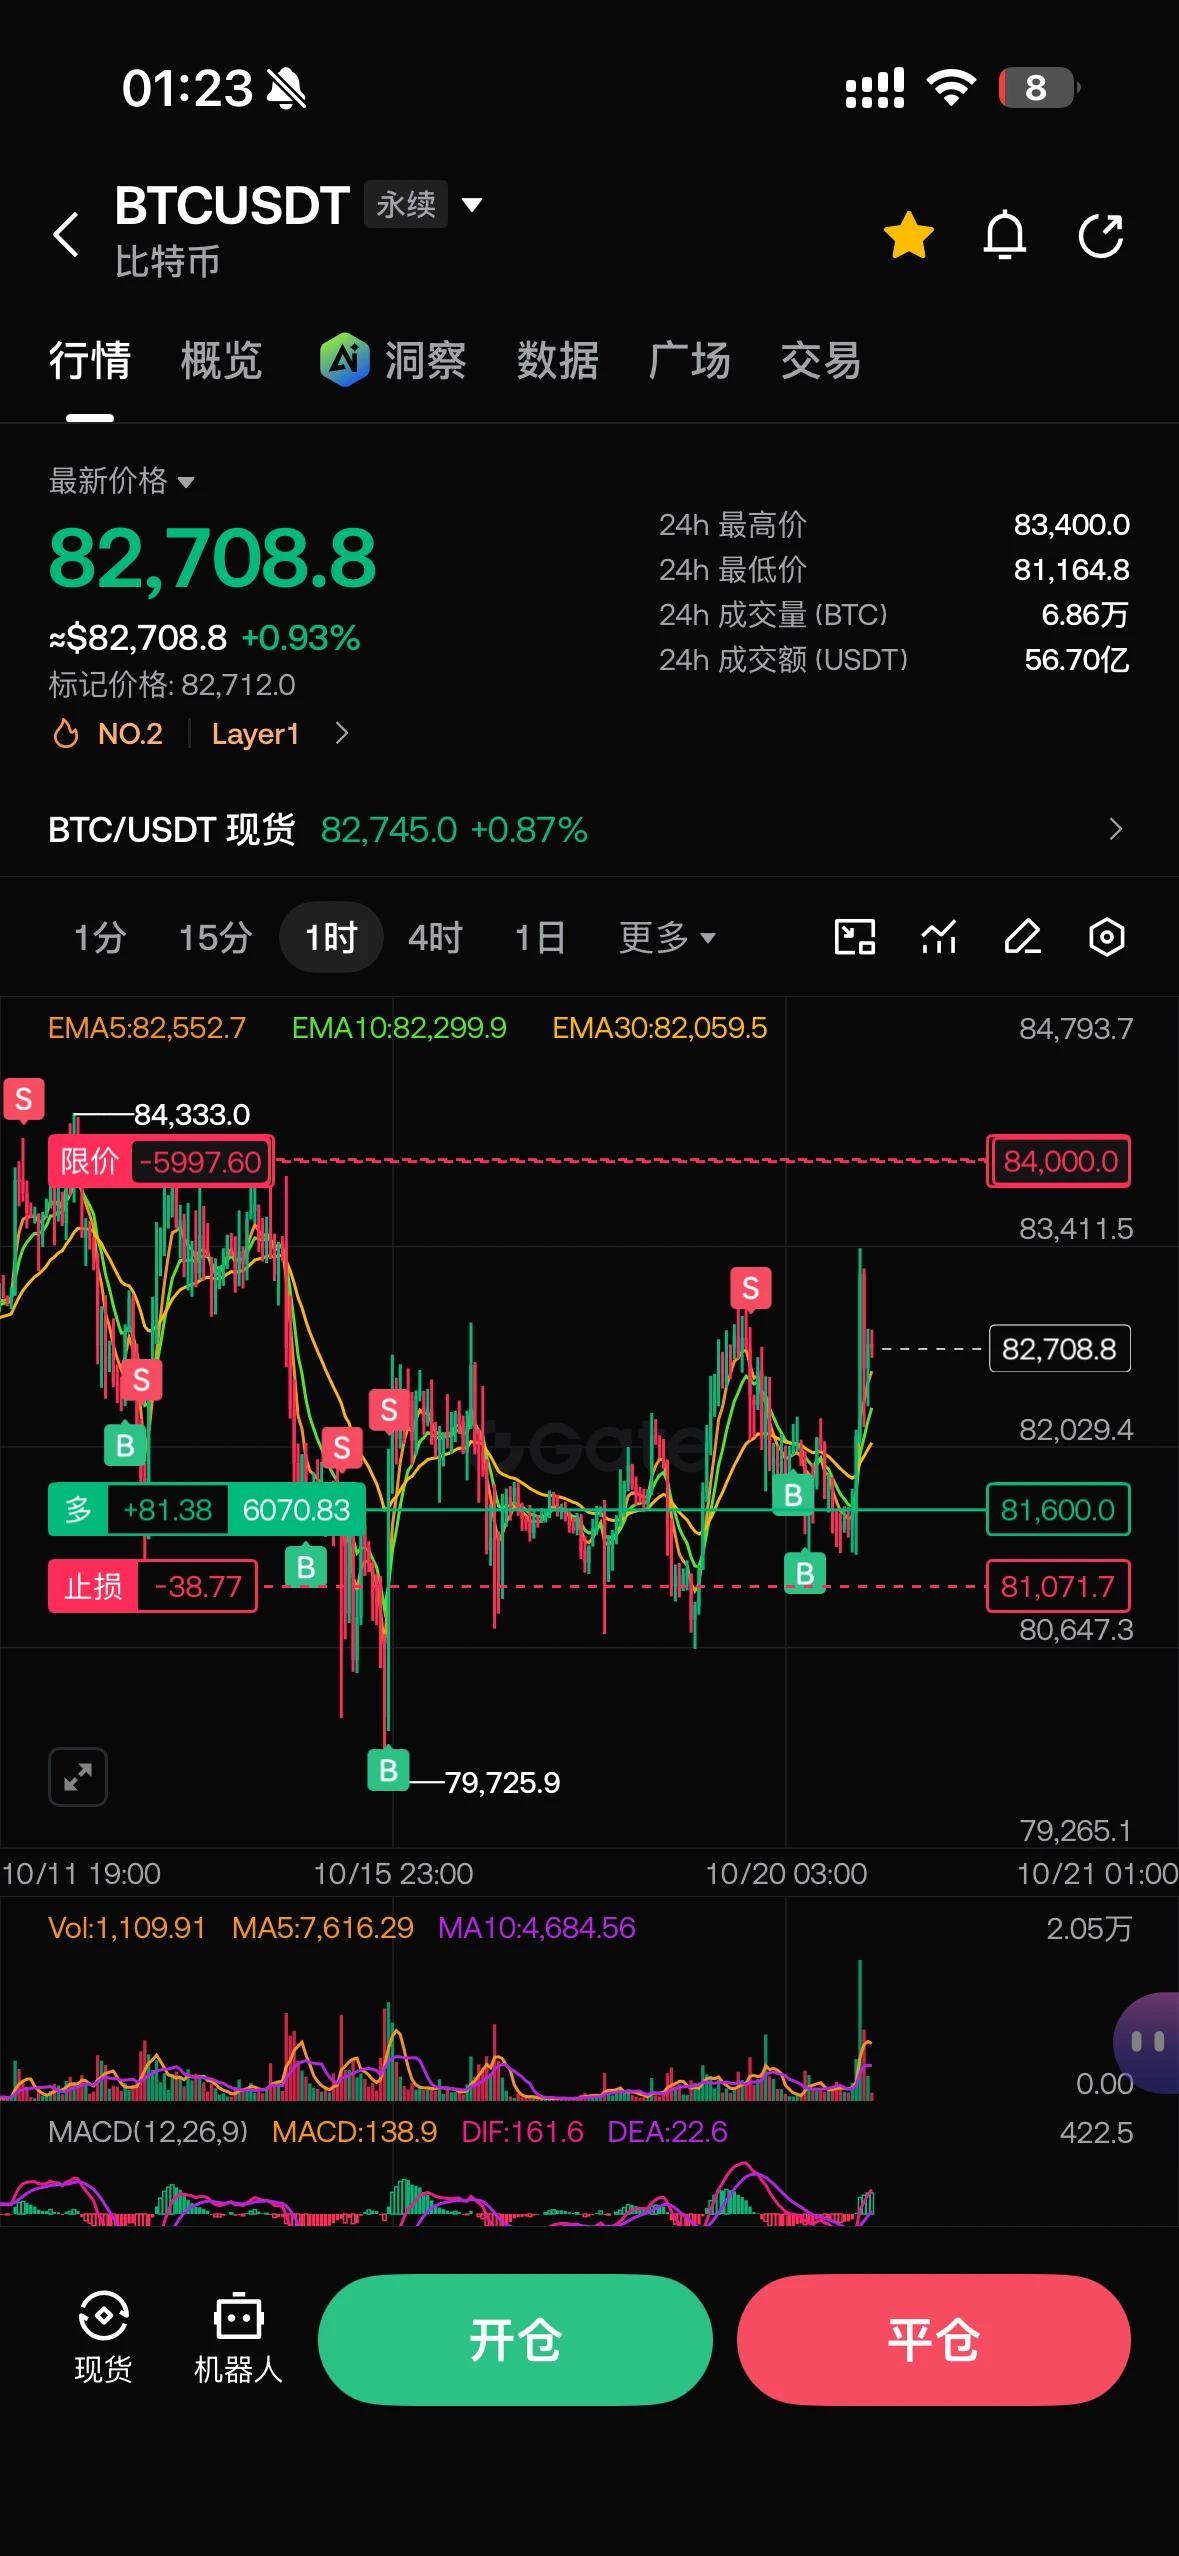
Friday’s nonfarm payrolls data came as a major surprise, with employment data far exceeding expectations. BTC was sold off sharply from the high of 81,350, dipping as low as 78,600. After the data was released, it did not continue moving unilaterally downward, instead staging a short-term consolidation recovery. It is currently grinding around 79,590.

This previous rally was driven by sentiment and a short squeeze. Once the bearish nonfarm payrolls data came out, most of the earlier gains were immediately retraced. The broader en
post-image
BTC-1.43%
A few days ago, I set a stop-loss before going to bed, and woke up laughing this morning. Before the market had fully started moving, I noticed that $CYS was behaving strangely. Volume hadn’t followed through, and selling pressure was strong—clearly, the bears were positioning themselves. Sure enough, the downpour started afterward.
Shorted at 0.4651, now at 0.2466, +466.37%. Although it didn’t reach the ideal target, any meat you can take is good meat. I initially thought the profit on this trade would be as thin as paper, but after that move, even paper can buy quite a few vegetables.
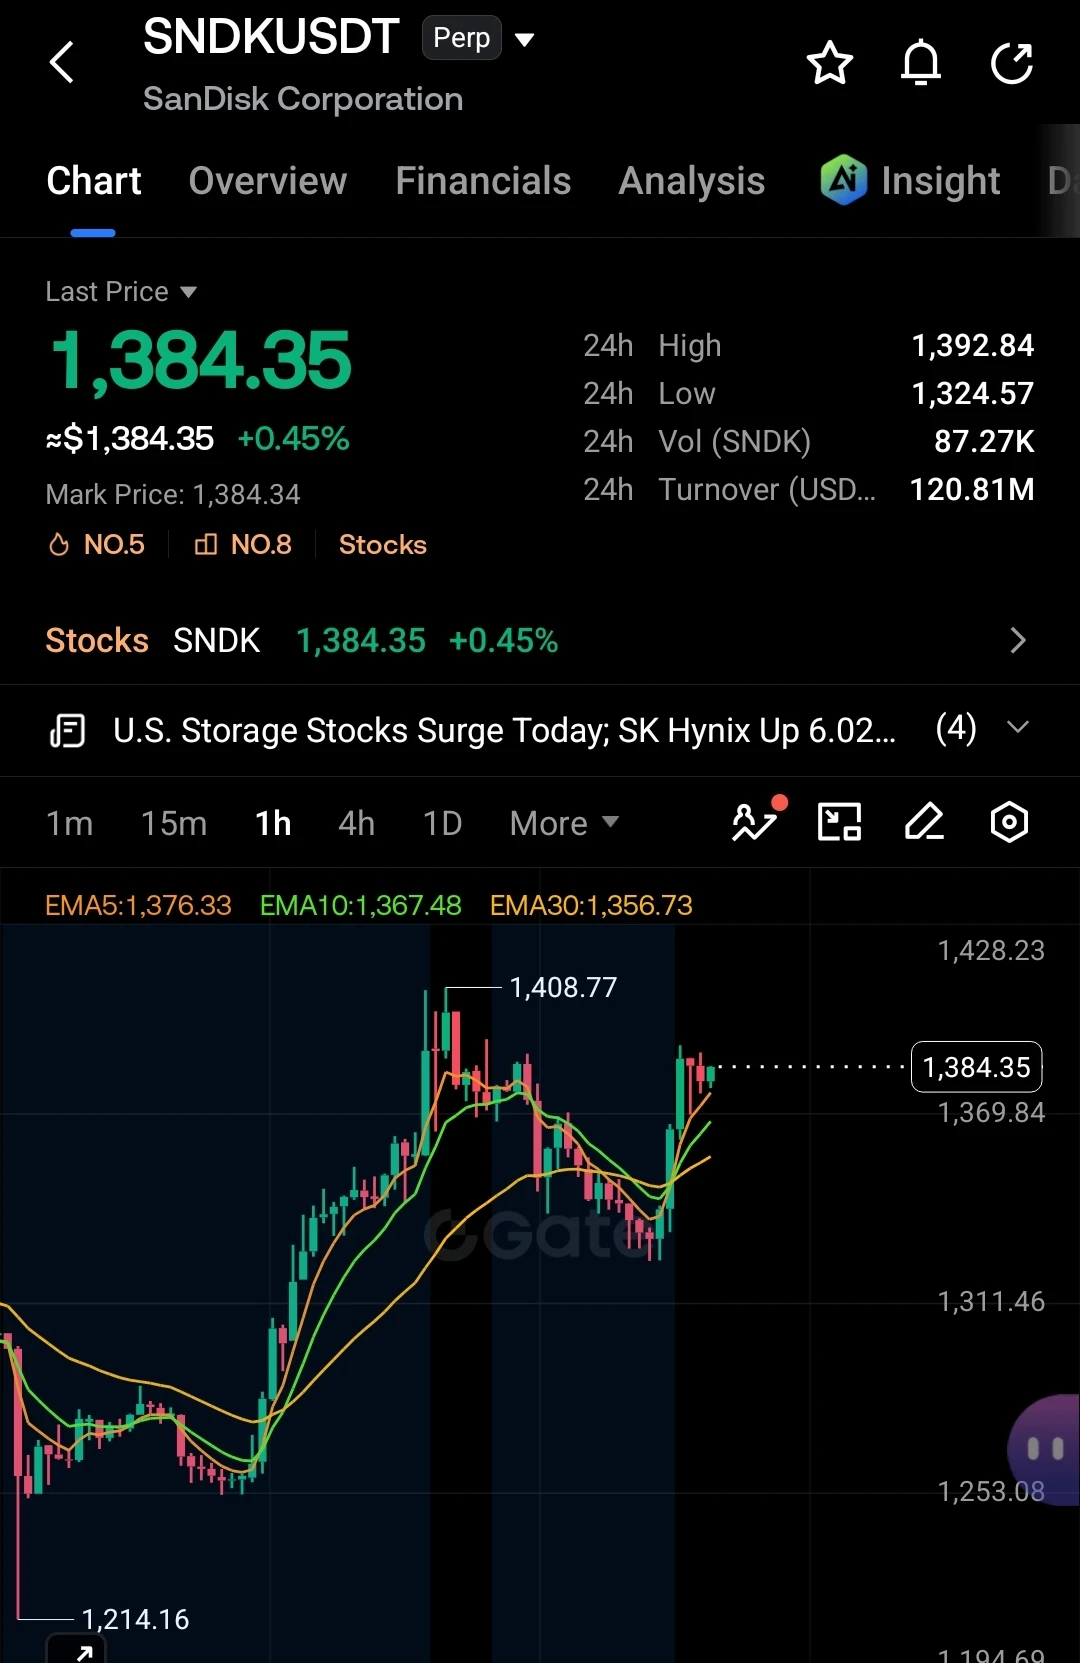
Take 8
post-image
CYS-2.32%
LAB+0.58%
SNDK+12.52%
gate and gate all team thank you
Nvidia Earnings Week Creator Leaderboard Revealed!
From earnings previews to after-hours recaps, streamers shared their insights and broke down market trends through livestreams, allowing more perspectives to be heard in real time.
👑 TOP 1: KatyPaty|0.5 NVDA
🥈 TOP 2: Luzhou Wanderer|0.2 NVDA
🥉 TOP 3: Luna_Star|0.2 NVDA
🍀 Copy-Trading Lucky Winner: GateUser-3d5f71ca|0.5 NVDA
See the poster for the list of winners ranked TOP 4—10 and TOP 11—40. Congratulations to all the winning streamers and creators!
🚀 Event details: https://www.gate.com/zh/campaigns/601
NVDA-0.21%
  • 10
  • 1
Please don't #FOMO!
This trader made 2 #FOMO trades in one day and lost $907K.
He spent $916.5K to buy 7.28M $MEME at $0.126, then sold for $353K, losing $563K(-61.45%).
He then spent $356K to buy 8.93M $SLINK at $0.04 and sold for only $12K, losing $344K(-96.62%).
MEME+3.17%
Nobody sees the 95% conviction short on $HOME /USDT — but the 4h chart is already screaming.

$HOME /USDT - SHORT

Trade Plan:
Entry: 0.00600 – 0.00602
SL: 0.00615
TP1: 0.00590
TP2: 0.00583
TP3: 0.00573

Why this setup?
Why now? The daily trend is bearish, and price is stalling at 0.00601 with a tight 1h ATR of 0.000059 — that’s compression before a drop. RSI on 15m sits at 49.47, neutral, giving room to fall, not bounce. Targets are stacked: TP1 at 0.00590, TP2 at 0.00583, TP3 at 0.00573. Invalidation is clear at 0.00617 — if we lose that, the short thesis dies. But with 95% confidence and
HOME0.00%
I had just switched the app to the background when it suddenly pumped—are you playing hide-and-seek with me?
It was still grinding around the open, and I had already gotten too lazy to keep watching. When I came back, I saw $UNI retesting and holding around 4.828, with volume gradually recovering, so I decisively opened a long position. My thinking was clear at the time: it couldn’t fall far on declining volume, and it wasn’t dumping even as volume increased, so the only direction left was up.
The price has now touched 6.178, and my position shows +1982.51% in profit. I checked several times t
post-image
UNI-2.08%
XRP-2.99%
DOGE-2.20%
Bad Boy Watch, Update 2, 26.9.05 (UTC+8) 9:30
Figure 1: RKLB daily chart
Little Rocket closed at 64.26 today, with an intraday high of 65.00, a low of 63.20, and a gain of 0.71%.
Little Rocket was rejected at the 10-day moving average yesterday. It is easier to fall than rise, and Little Rocket’s real upside catalyst depends on the Neutron rocket. Expectations ahead of its unveiling could bring positive sentiment to the market. Seizing this opportunity should yield decent returns.
Figure 2: GT daily chart
GT is currently above the 8u level. As long as it does not fall below 8u, there should be
CryptoPlayerWithBadIntentions
Bad Boy Watch, Part 2 Update, 26.9.04 (UTC+8) 10:50
Figure 1: RKLB daily K-line
Little Rocket closed at 63.80 today, with an intraday high of 64.90 and a low of 62.36, up 1.13%.
For now, it still appears to be trading above the yearly moving average. Yesterday, I was hoping Little Rocket would follow with a big bullish candle—how did my jinx end up boosting Big Rocket instead? Your big brother rose, so why didn't you rise as well?
Let's see how it performs tonight. First, it needs to move above the 10-day moving average, followed by the 5-day moving average crossing above the 10-day moving average. Take it step by step.
Figure 2: GT daily K-line
gt now appears to have firmly held above $8, and is now eyeing the $10 round-number level.
repost-content-media
RKLB+0.70%
GT-0.82%
Financial News, Crypto Market Updates, Real Trading Strategies
live-cover
LIVE1,269
A Brief Analysis of BTC’s Short-Term Trend from Dow Theory, Chan Theory, Elliott Wave Theory, Volume-Price Relationships, Order Flow, and Price Action
I. Dow Theory
Primary trend (1-hour timeframe): The primary downtrend from the historical high of 82,814 on May 6 confirmed a trend reversal in mid-August. The price began a strong rebound from the August 14 low of 62,488. After forming a double bottom at 63,979 at 03:00 on August 18, the bulls launched an epic rally. The price surged from 63,979 to the August 28 high of 81,346.95, setting a new high for the current phase, for a cumulative gain
BTC-1.43%
$BTC ‌Bitcoin (BTC), the leading asset in the global cryptocurrency market, has entered a consolidation phase just below the psychological threshold of 80,000 USDT after its recent upward momentum. In current trading, the BTC/USDT spot pair is trading at 79,639.8 USDT with a limited correction of 1.96%, while the price in perpetual futures (Perp) contracts is stabilizing at 79,596.9 USDT.
Price Movement and Trading Volume Analysis
Intraday price movements and liquidity flow indicate a balance between short-term profit-taking and gradual buying demand in the market:
Daily Trading Range: The hi
BTC-1.43%
  • 1
$DASH Signal】1H breaks above the upper Bollinger Band, bullish momentum continues
$DASH RSI 1H 81.36, with the price at 64.26 breaking above the upper Bollinger Band at 62.88. MACD momentum is expanding across both timeframes, with the 4H histogram at 1.84. Bid depth dominates the order book, with a Bid/Ask ratio of 1.73, and the funding rate at 0.01% shows no signs of overheating. OI is stable, with no signs of short-side resistance.
🎯Direction: Long
⚡Entry/limit order: 64.0672 - 64.2600
🛑Stop-loss: 63.6174
🚀Target 1: 65.2239
🚀Target 2: 65.7059
🛡️Trade management:
- Execution strategy:
post-image
DASH+40.14%
After a rapid surge, heavy profit-taking has exited the market, releasing short-term selling pressure and sending the market into a pullback and consolidation phase.
The bulls’ upward momentum has clearly weakened, with risks accumulating at elevated levels. Chasing the rally to go long is not advisable at this time.
In the short term, the market will oscillate and pull back to digest gains. Even if there is a slight rebound, it will mostly be a brief technical recovery. A new rally will require time for a shakeout and for bullish momentum to build. Do not blindly chase highs at this stage; wa
post-image
BTC-1.43%
ETH-1.96%
JUST IN: Galaxy Digital and Wintermute are net-short on Hyperliquid, with combined shorts around $126M vs ~$11M in longs; 30-day losses highlight potential risk-off positioning among market makers. $HYPE RLIQID (if ticker applicable)
post-image
GLXY-0.60%
HYPE-3.62%
Everyone is staring at $HOME /USDT’s 0.0060 support, but the 4h tape just whispered a secret the crowd missed.

$HOME /USDT - SHORT

Trade Plan:
Entry: 0.00601 – 0.00603
SL: 0.00616
TP1: 0.00592
TP2: 0.00585
TP3: 0.00575

Why this setup?
Why now? The 95% confidence SHORT isn't noise—it’s a structural echo.
- 1D trend is **bearish**, and price is hugging the 0.00602 pivot like a trapdoor.
- RSI (15m) at 47.65 shows zero momentum to escape lower highs.
- ATR (1h) of 0.000057 means the squeeze is tight—targeting TP1 at 0.00592 is a 1.6% drop, but TP3 at 0.00575 is a 4.5% slide if the flo
HOME0.00%
I’m watching $DGAI /USDT closely here 👀 price is holding around 0.7837 after that sharp recovery from 0.76449. The 15M chart is getting tight, and a clean breakout could bring some serious momentum.
🔥 DGAI/USDT LONG SETUP
📍 Entry Zone: 0.7815 – 0.7845
🎯 TP1: 0.7890
🎯 TP2: 0.7950
🎯 TP3: 0.8000 – 0.8020
🛑 Stop Loss: 0.7760
The key is patience here. If DGAI holds the 0.7815–0.7845 area and volume starts expanding, I’d be watching for a push toward the recent 0.79829 high and potentially beyond it. ⚡
Don’t chase a candle after it pumps let the setup come to you. Manage risk and protect yo
post-image
DGAI+0.69%
🚀 🚀 🚀 𝐌𝐚𝐫𝐤𝐞𝐭 𝐀𝐧𝐚𝐥𝐲𝐬𝐢𝐬 | 𝐌𝐎𝐍/𝐔𝐒𝐃𝐓
Monad Protocol ($MON ) is consolidating within the $0.0248–$0.0260 range, testing key short-term dynamic moving average floors as price action builds a baseline. Buyers are looking to defend local support levels to prepare for a breakout attempt toward overhead supply zones.
📊 𝐊𝐞𝐲 𝐌𝐞𝐭𝐫𝐢𝐜𝐬
• Current Price: ~$0.0256
• 24H Range: $0.0247 – $0.0261
• Market Bias: Neutral / Consolidation 🐂
📈 𝐓𝐞𝐜𝐡𝐧𝐢𝐜𝐚𝐥 𝐇𝐢𝐠𝐡𝐥𝐢𝐠𝐡𝐭𝐬
• Moving Averages: Pressing against the 4H 20/50 EMA cluster ($0.0255–$0.0258), acting as the immed
MON-4.65%
Load More

Join 40 M users in our growing community

⚡️ Join 40 M users in the crypto craze discussion

💬 Engage with your favorite top creators

👍 See what interests you

View More