
Square
Following
Hot
News
Profile
Share your thoughts
placeholder
Article
BTC down 0.62% in 24 hours, $31.89 million dumped in the final hour
Gate spot BTC/USDT is currently quoted at 81285.5 USDT, down 0.62% over 24 hours, with a high of 81818.4 and a low of 80817.0. That 0.62% is almost negligible on the daily chart, but the final hourly candle was different: it opened at 81647.1, plunged to a low of 80817.0, and closed at 81124.9, with 31.89 million USDT in single-hour trading volume—more than three times the previous hour’s roughly 8.71 million.
What concerns me more is whether this drop was backed by volume. Looking at the latest 48 hourly candles, the volume p
post-image
BTC+0.03%
Why are you diving so fast, $BTW ? You were doing just fine a minute ago.TP: 2.23SL: 2.5683Also active:$AVA : Current Price 0.4065 - 24h Change: +38.59%$ETH : Current Price 2,400.35 - 24h Change: -0.83%
post-image
BTW+19.15%
AVA+33.23%
ETH-0.60%
Trenches
AGT
A
bade
b
AGT
0x5d...e274
Market Cap
$.
Change
.
24h Vol
$.
Holders
.
CNPY
C
bade
b
CNPY
0xc6...ddd2
Market Cap
$.
Change
.
24h Vol
$.
Holders
.
Q
Q
bade
b
Q
0xc0...0589
Market Cap
$.
Change
.
24h Vol
$.
Holders
.
Gato
G
bade
b
Gato
55A3...pump
Market Cap
$.
Change
.
24h Vol
$.
Holders
.
DOPE
D
bade
b
DOPE
0xf9...8899
Market Cap
$.
Change
.
24h Vol
$.
Holders
.
Layout: Bitcoin, Ethereum, Dogecoin
live-cover
LIVE880
  • 4
Find opportunities in $DOGE using price-volume confirmation; key levels and exit lines are here
What stands out most in this $DOGE chart is not the 2.33% 24-hour decline itself, but that the 1-hour and 4-hour charts are both weak yet haven’t delivered the same answer.
My view is that direction is taking shape for now, but low participation has reduced the credibility of this move.
$DOGE The current price is 0.07917, with a 24-hour range of 0.07702–0.08107. The 1-hour support is at 0.07702, with resistance at 0.08096; the two more distant 4-hour boundaries are 0.07702 and 0.08566. These numbers
post-image
DOGE-0.92%
$Q I'm rushing to short, rushing to get liquidated
post-image
Q+97.35%
Fees paid to apps on Filecoin rose 68.34% in the past 30 days to $111,353. GLIF, the network's largest app by fees, took in $91,398 of it, up 47.76% over the same window.
@Filecoin
FIL-6.61%
Good morning, $DOGE fam! 🤝🐕
Gm C X ☕️🌎
Happy weekend! ✌️🌦🍂
Dogecoin to the moon! 🚀🌑
post-image
DOGE-0.92%
$PI If you insist on holding and refuse to sell, capital will insist on staying out of the market. The price will keep fluctuating, wearing you down until you’re completely broke—then let’s see if you’ll finally cut your losses. Capitalists have plenty of money and no urgency. But you’re poor and need money for all sorts of things; you can’t wait.
Someone asked, “When will it go up?” A rise may only happen after all of you have sold the coins you’re holding.
post-image
PI-0.84%
  • 3
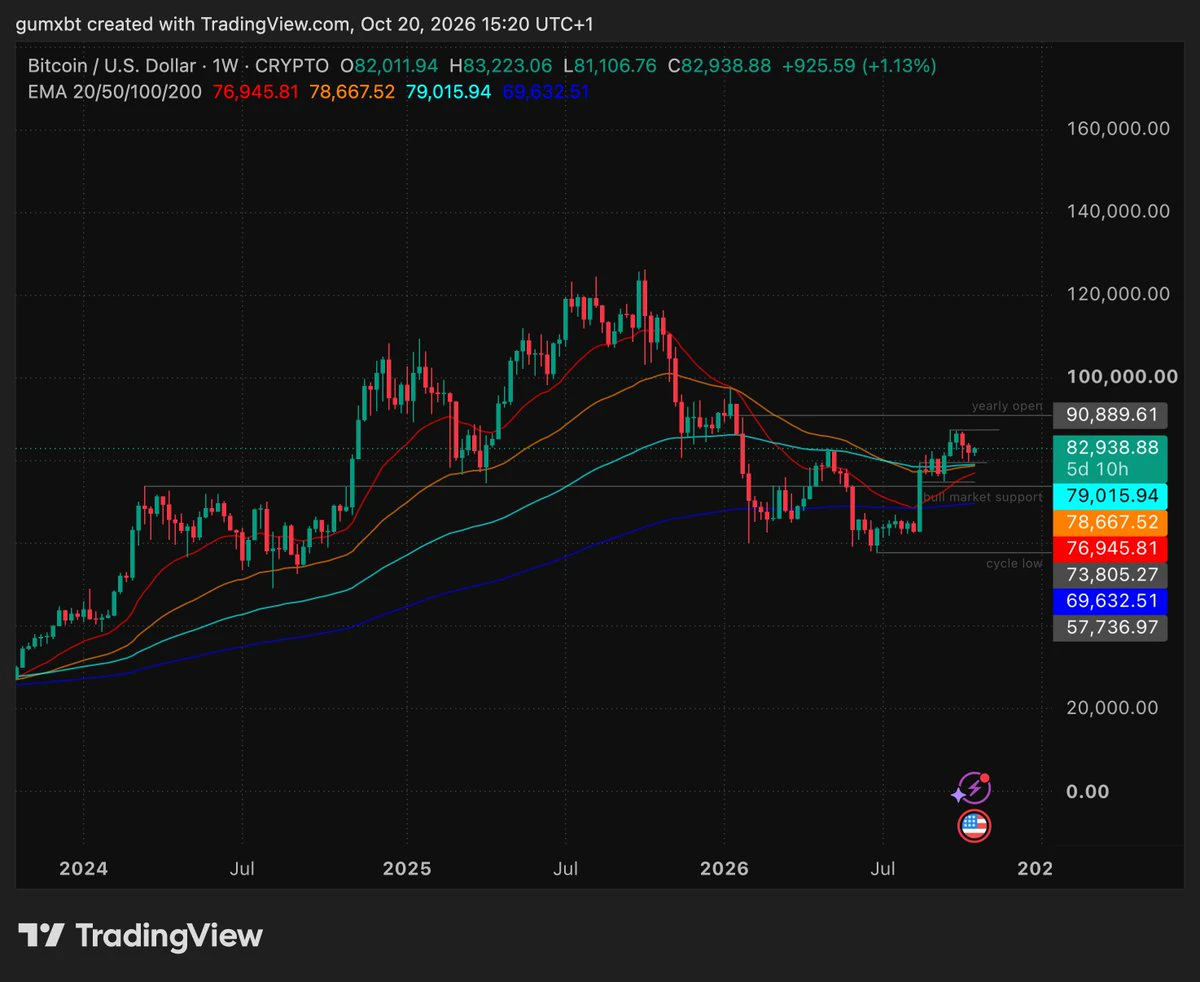
October 18 analysis: Bitcoin EMA is entering the early stages of a downtrend; the daily candle closed bearish. Support levels are 79,500 and 76,500, with 73,500 as the short-position defense level. Ethereum remains bearish, with support at 2,300 and 2,250$BTC $ETH #加密市场情绪转向贪婪
BTC+0.03%
ETH-0.60%
🚨 YOUR CRYPTO WALLET COULD BE TARGETED WITHOUT YOU CLICKING A SINGLE LINK.
Imagine waking up, checking your phone, and discovering that your crypto accounts may have been exposed — even though you never clicked a suspicious link or downloaded a strange app.
That is the danger of ZERO-CLICK SPYWARE. 🕵️
Most people think hackers need them to make a mistake before an attack can happen. Unfortunately, that is not always true.
⚠️ HOW DOES THIS THREAT CONNECT TO CRYPTO?
Zero-click spyware exploits vulnerabilities in a device's software to gain unauthorised access without requiring the victim to in
post-image
GT-3.00%
$BR Long setup... Buyers are back in force!
BR is currently trading around 0.453 after a sharp rebound. Buyers are trying to hold above the 0.44 support zone, creating the potential for further upside. Entry: 0.445–0.455 (long) Take-profit 1: 0.475 Take-profit 2: 0.495 Final target: 0.530 Stop-loss: 0.425 As long as BR holds above 0.44, the rebound could continue. A break above 0.475 could further strengthen momentum, pushing the price toward 0.50 and higher. Watch support closely and manage risk. $BR
post-image
BR+21.53%
Bitcoin Support and Resistance Levels
live-cover
LIVE585
‍#每周来晒 #WCTCS9
Preview of Next Week’s Major Financial Events
2026-10-19 (Monday)
10:00 China’s Q3 GDP, September industrial value added, fixed-asset investment, and total retail sales of consumer goods
22:00 US October NAHB Housing Market Index
2026-10-20 (Tuesday)
09:15 China’s October LPR quotation 17:00 Eurozone October ZEW Economic Sentiment Index 20:30 US September housing starts and building permits
22:00 US September pending home sales index MoM
NVIDIA GTC conference (10.20–10.22)
2026-10-21 (Wednesday)
16:00 UK September CPI YoY
22:30 US EIA crude oil inventories for the week ending O
post-image
NVDA-1.42%
TSLA-2.17%
SPGI+1.13%
#美股存储板块跌幅扩大
The core question is whether this represents a healthy correction following a rally driven by artificial intelligence (AI), or the beginning of a deeper repricing process within the storage sector. Rather than buying simply because prices have fallen, it would be more prudent to focus on earnings expectations, memory pricing, and whether each company can maintain its profit margins.
My perspectives on storage sector stocks:
* Micron (MU): Monitor demand for DRAM and HBM, memory growth linked to AI, and gross profit margin forecasts. Strong AI demand could bolster earnings, though
post-image
ybaser
#美股存储板块跌幅扩大
The core question is whether this represents a healthy correction following a rally driven by artificial intelligence (AI), or the beginning of a deeper repricing process within the storage sector. Rather than buying simply because prices have fallen, it would be more prudent to focus on earnings expectations, memory pricing, and whether each company can maintain its profit margins.
My perspectives on storage sector stocks:
* Micron (MU): Monitor demand for DRAM and HBM, memory growth linked to AI, and gross profit margin forecasts. Strong AI demand could bolster earnings, though these expectations may already be priced into the stock.
* SanDisk (SNDK): Focus on NAND flash pricing, demand for enterprise SSDs, and the sustainability of any earnings recovery. NAND supply and price cycles can make this stock particularly volatile.
* Western Digital (WDC): Evaluate "nearline" (high-capacity/accessible) HDD demand from AI data centers, cloud computing expenditures, and free cash flow. The factors influencing HDD demand differ from those affecting NAND and DRAM.
* Seagate (STX): As data center storage requirements grow, keep an eye on demand for high-capacity drives, pricing power, and profit margins.
* Track NAND market conditions, enterprise SSD adoption rates, and the company's valuation relative to earnings expectations.
What signs might justify rebuilding a position? I would look at the following three points:
* Stabilization of fundamental indicators: A halt in the deterioration of memory and NAND prices, company forecasts, and earnings estimates.
* Confirmation through price action: Stocks forming higher lows and reclaiming key moving averages, accompanied by stronger trading volume.
* Attractive valuation: Expected earnings growth that justifies the current price, even under less optimistic scenarios.
A decline in a stock price is not, by itself, a buy signal. If earnings estimates are falling faster than the stock price, the valuation may not have actually become cheaper.
Rather than buying the entire storage sector indiscriminately, I prefer to differentiate between individual companies. While AI demand serves as a long-term tailwind, memory, NAND flash, and hard disk drives each have their own unique supply cycles, competitive pressures, and profit margins.
An important distinction: A pullback driven by profit-taking is fundamentally different from one caused by weak forward guidance or falling memory prices. The latter scenario warrants a much more cautious approach. Which of these stocks—MU, SNDK, WDC, or STX—are you following most closely? I can help you compare their valuations, earnings outlooks, technical levels, and the potential factors that could support a recovery.
$MU ‌$SNDK ‌$WDC ‌$STX ‌
repost-content-media
MU-5.66%
SNDK-6.90%
  • 5
#DOGE DOGE ETF switches from consecutive net inflows to redemptions! Can the $0.08 support hold?
Dogecoin fever cools! ETF funds flee, with $0.08 becoming a crucial line in the sand🐶
Once wildly popular Dogecoin (DOGE) is now facing a subdued market atmosphere. Dogecoin ETFs had previously seen three consecutive weeks of inflows, but the trend completely reversed in October as institutional funds began to pull out, putting considerable pressure on the price.
📉ETF funds see $540k in outflows over two days.
According to SoSoValue data, spot Dogecoin ETF flows were virtually flat from October 1
post-image
ThisIsTranslateContent:
#DOGE DOGE ETFs switch from consecutive net inflows to redemptions! Can the $0.08 support hold?
Dogecoin hype cools! ETF funds flee, with $0.08 becoming a make-or-break line🐶
Dogecoin DOGE, once hugely popular, is now facing a subdued market atmosphere. Dogecoin ETFs had previously seen three consecutive weeks of inflows, but the trend completely reversed in October as institutional funds began to pull out, putting significant pressure on the price.
📉ETF funds see $540,000 in outflows over two days.
According to SoSoValue data, from October 1 to 9, flows in and out of Dogecoin spot ETFs were virtually flat, with no funds entering or leaving. Instead of a turnaround, a wave of redemptions followed. Around $400,000 flowed out on October 12, followed by another $138,600 on the 13th, bringing total outflows to $540,000 in just two days.
Fund net assets also shrank from nearly $17 million at the start of the month to $14.44 million. The retreat of institutional funds is a major headwind DOGE must now face.
📊The price continues to weaken, with bearish technical indicators.
DOGE is down 14% overall this month. It was still holding at $0.095 at the start of the month, but slid steadily after October 7 and is now trading at around $0.0800.
Although it briefly rebounded to a high of $0.088 on the 12th, the recovery was short-lived, and the price quickly fell again, touching a low of $0.08. Technical indicators are also unpromising: the RSI has fallen below its signal line, while the CMF money flow indicator briefly dropped to near -0.90 and has now recovered to -0.30, indicating that the overall trend of capital outflows remains unchanged.
⚖️Futures market sees a tug-of-war between bulls and bears, with bullish positions weakening.
Signals from the derivatives market are mixed. DOGE open interest first surged to $652 million, then fell to $598 million before edging back up to $609 million. The funding rate remains positive at 0.0088%, indicating that the market still retains some long positions, with bulls continuing to pay fees to bears. However, the overall decline in open interest means bullish momentum in the futures market is weakening.
📌Market Summary and Key Points to Watch
$0.08 is a key short-term support level for DOGE. If it breaks decisively below this level, pressure on bulls will intensify sharply, and the price could fall further. The market is currently weak overall, and the rebound lacks strength, so it is unwise to blindly buy the dip. Watch closely to see whether the $0.08 support holds.#WCTCS9
repost-content-media
DOGE-0.92%
#KOSPIJumps3.3% #ShareWeekly
KOSPI Rebounds After a 7.6% Crash: Is the Semiconductor Sell-Off Over, or Is More Volatility Ahead?
The Asian stock market experienced a dramatic shift on October 15–16, 2026, as semiconductor stocks came under heavy selling pressure before staging a partial recovery. South Korea’s KOSPI index suffered a sharp 7.6% decline on October 15, dropping to 5,554 points and triggering a circuit breaker. The index touched its lowest level since April, highlighting how quickly market sentiment can change when inflation concerns, interest-rate expectations, and uncertainty s
SK Hynix+0.79%
JPN225+0.29%
NAS100-0.48%
CXMT-1.27%
#CryptoMarketTurnsGreedy #ShareWeekly
CRYPTO MARKET SENTIMENT IS TURNING GREEDY: THE NEXT RALLY OPPORTUNITY OR A WARNING SIGN?
The cryptocurrency market is entering an interesting phase as sentiment shifts toward greed. After periods of uncertainty, growing optimism can encourage buyers to return, increase trading activity, and create fresh opportunities across Bitcoin, Ethereum, and the broader altcoin market. But there is one important question every trader should ask: Is this confidence supported by real market strength, or are emotions beginning to take control?
1. Understanding the Shift
BTC+0.03%
ETH-0.62%
PPI rises 6.3% year over year, highest since 2022; energy is “eating” the entire economy
Yesterday, when the PPI data came out, I was looking at Gate’s candlestick chart. The moment the numbers appeared, my first thought was, “I must be reading that wrong.”
September PPI rose 6.3% year over year, versus expectations of 5.4% and a previous reading of 5.4%. It rose 1.3% month over month, versus expectations of 0.6% and a previous reading of 0.4%. Core PPI rose 5.0% year over year, versus expectations of 4.4%. Core PPI rose 0.7% month over month, versus expectations of 0.3%. All figures significa
MU-5.66%
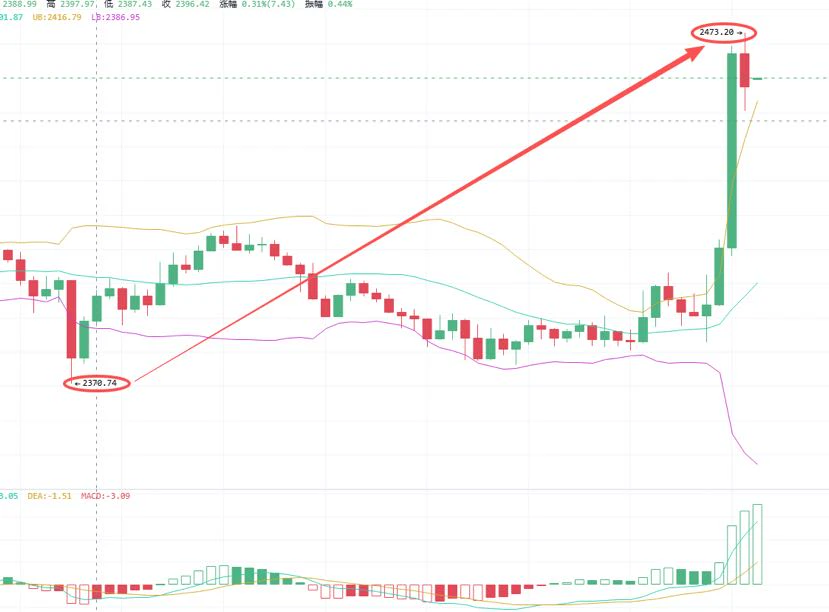
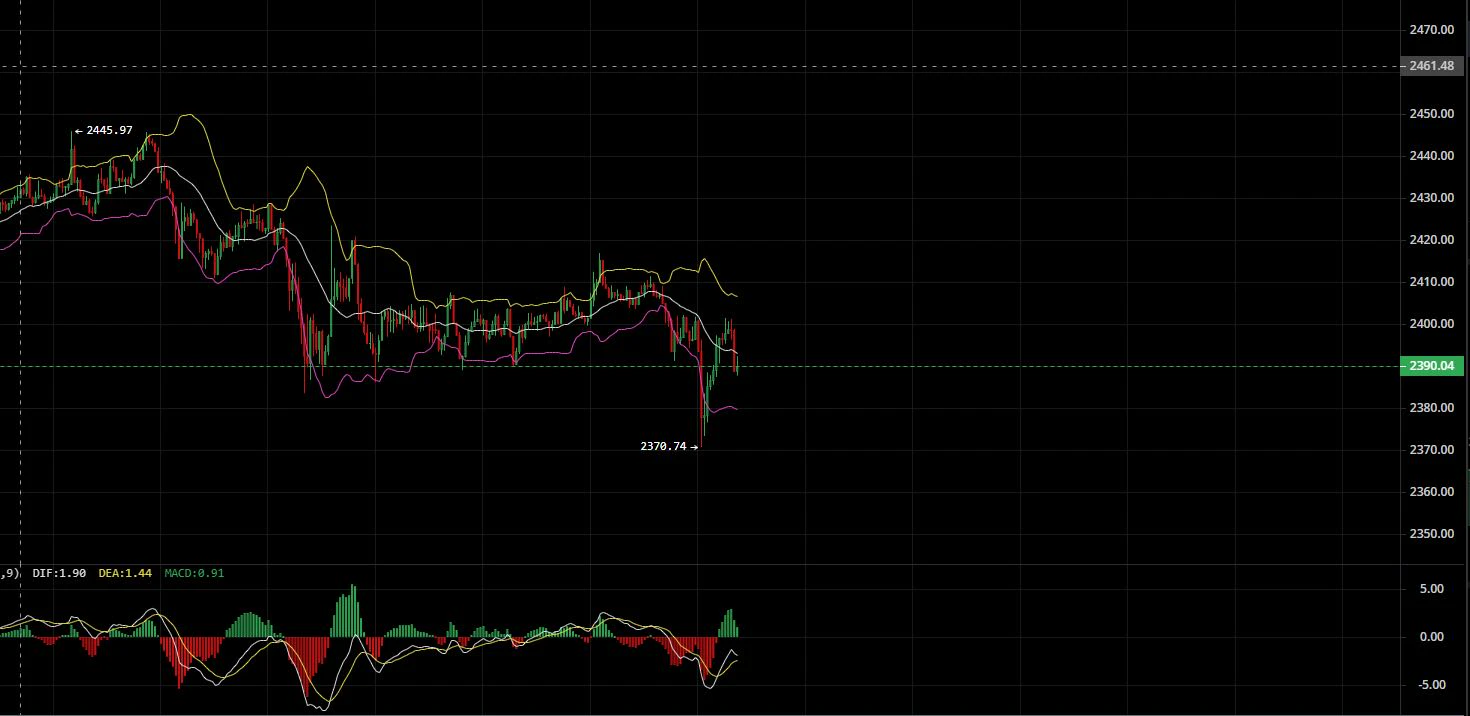
October 18 Strategy Plan Priority Ranking, For Followers Only
Current Best Assessment
At the current price of around 2396:
Do not chase longs
Do not chase shorts
Wait for the price to enter a key area
My priority ranking:
Short if rejected at 2403–2418
Go long if it holds near 2380
Go long after a breakout above 2405 and a confirmed retest
If it breaks below 2378 directly, wait for a failed rebound before considering a short
If it holds above 2428 convincingly, cancel the intraday bearish bias
$ETH
post-image
ETH-0.62%
Load More

Join 40 M users in our growing community

⚡️ Join 40 M users in the crypto craze discussion

💬 Engage with your favorite top creators

👍 See what interests you

Trending Topics

USSeptemberPPIBeatsExpectations

91.35k Views1.93k Discussing

US September PPI came in at 6.3% YoY, well above the 5.3% market expectation, pointing to renewed producer-side inflation pressure. Weekly jobless claims were 199K, broadly in line with forecasts. Could hotter inflation further reduce room for rate cuts, and what does it mean for $BTC, US stocks, and gold?

GateWCTCS9GlobalTradingCompetition

37.87k Views6.68k Discussing

GateBTCAndETHFuturesVolumeRanksTop3

53.8k Views1.82k Discussing

View More