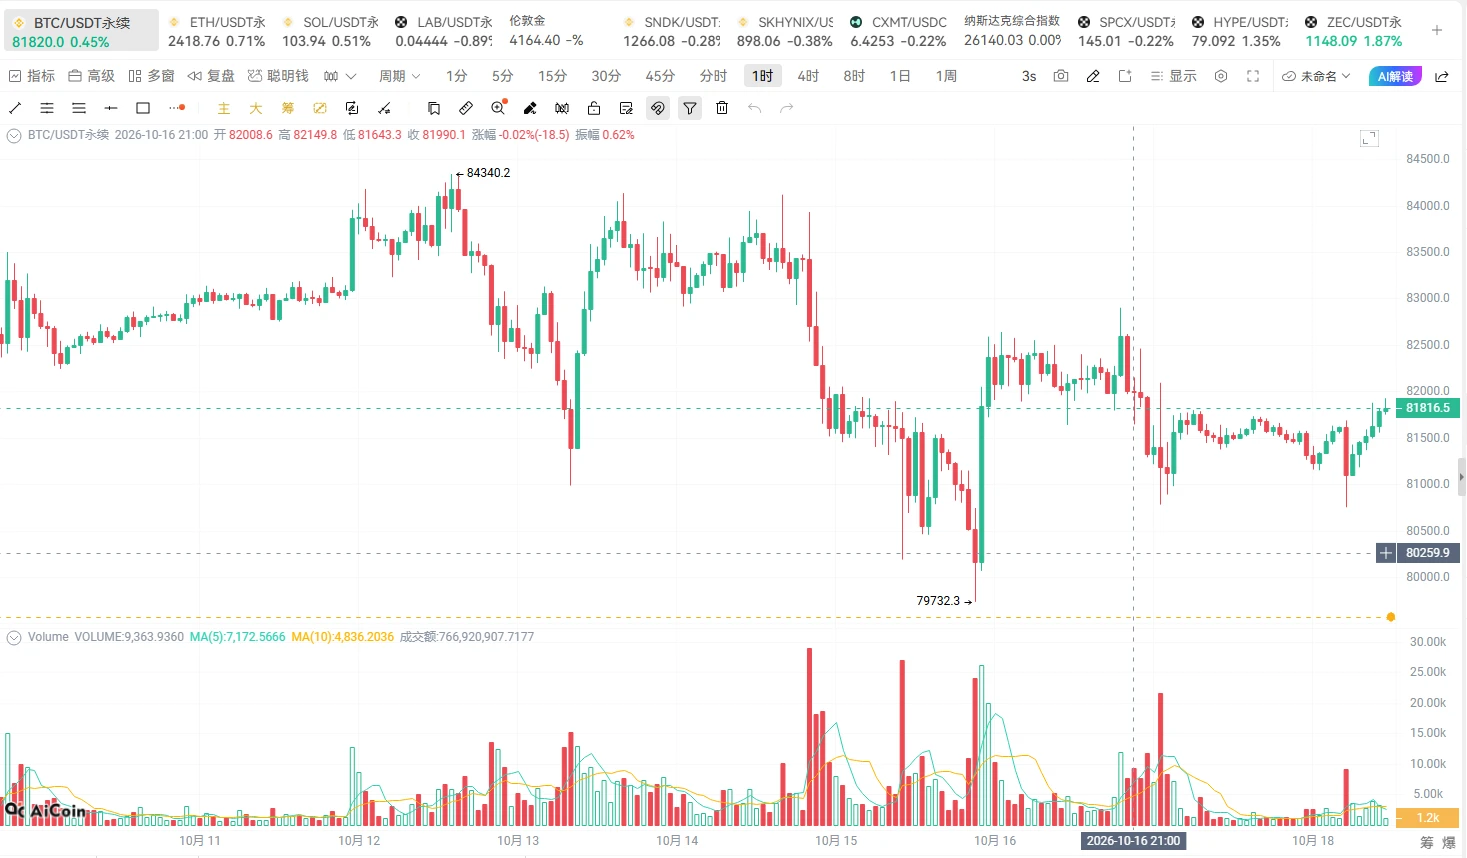









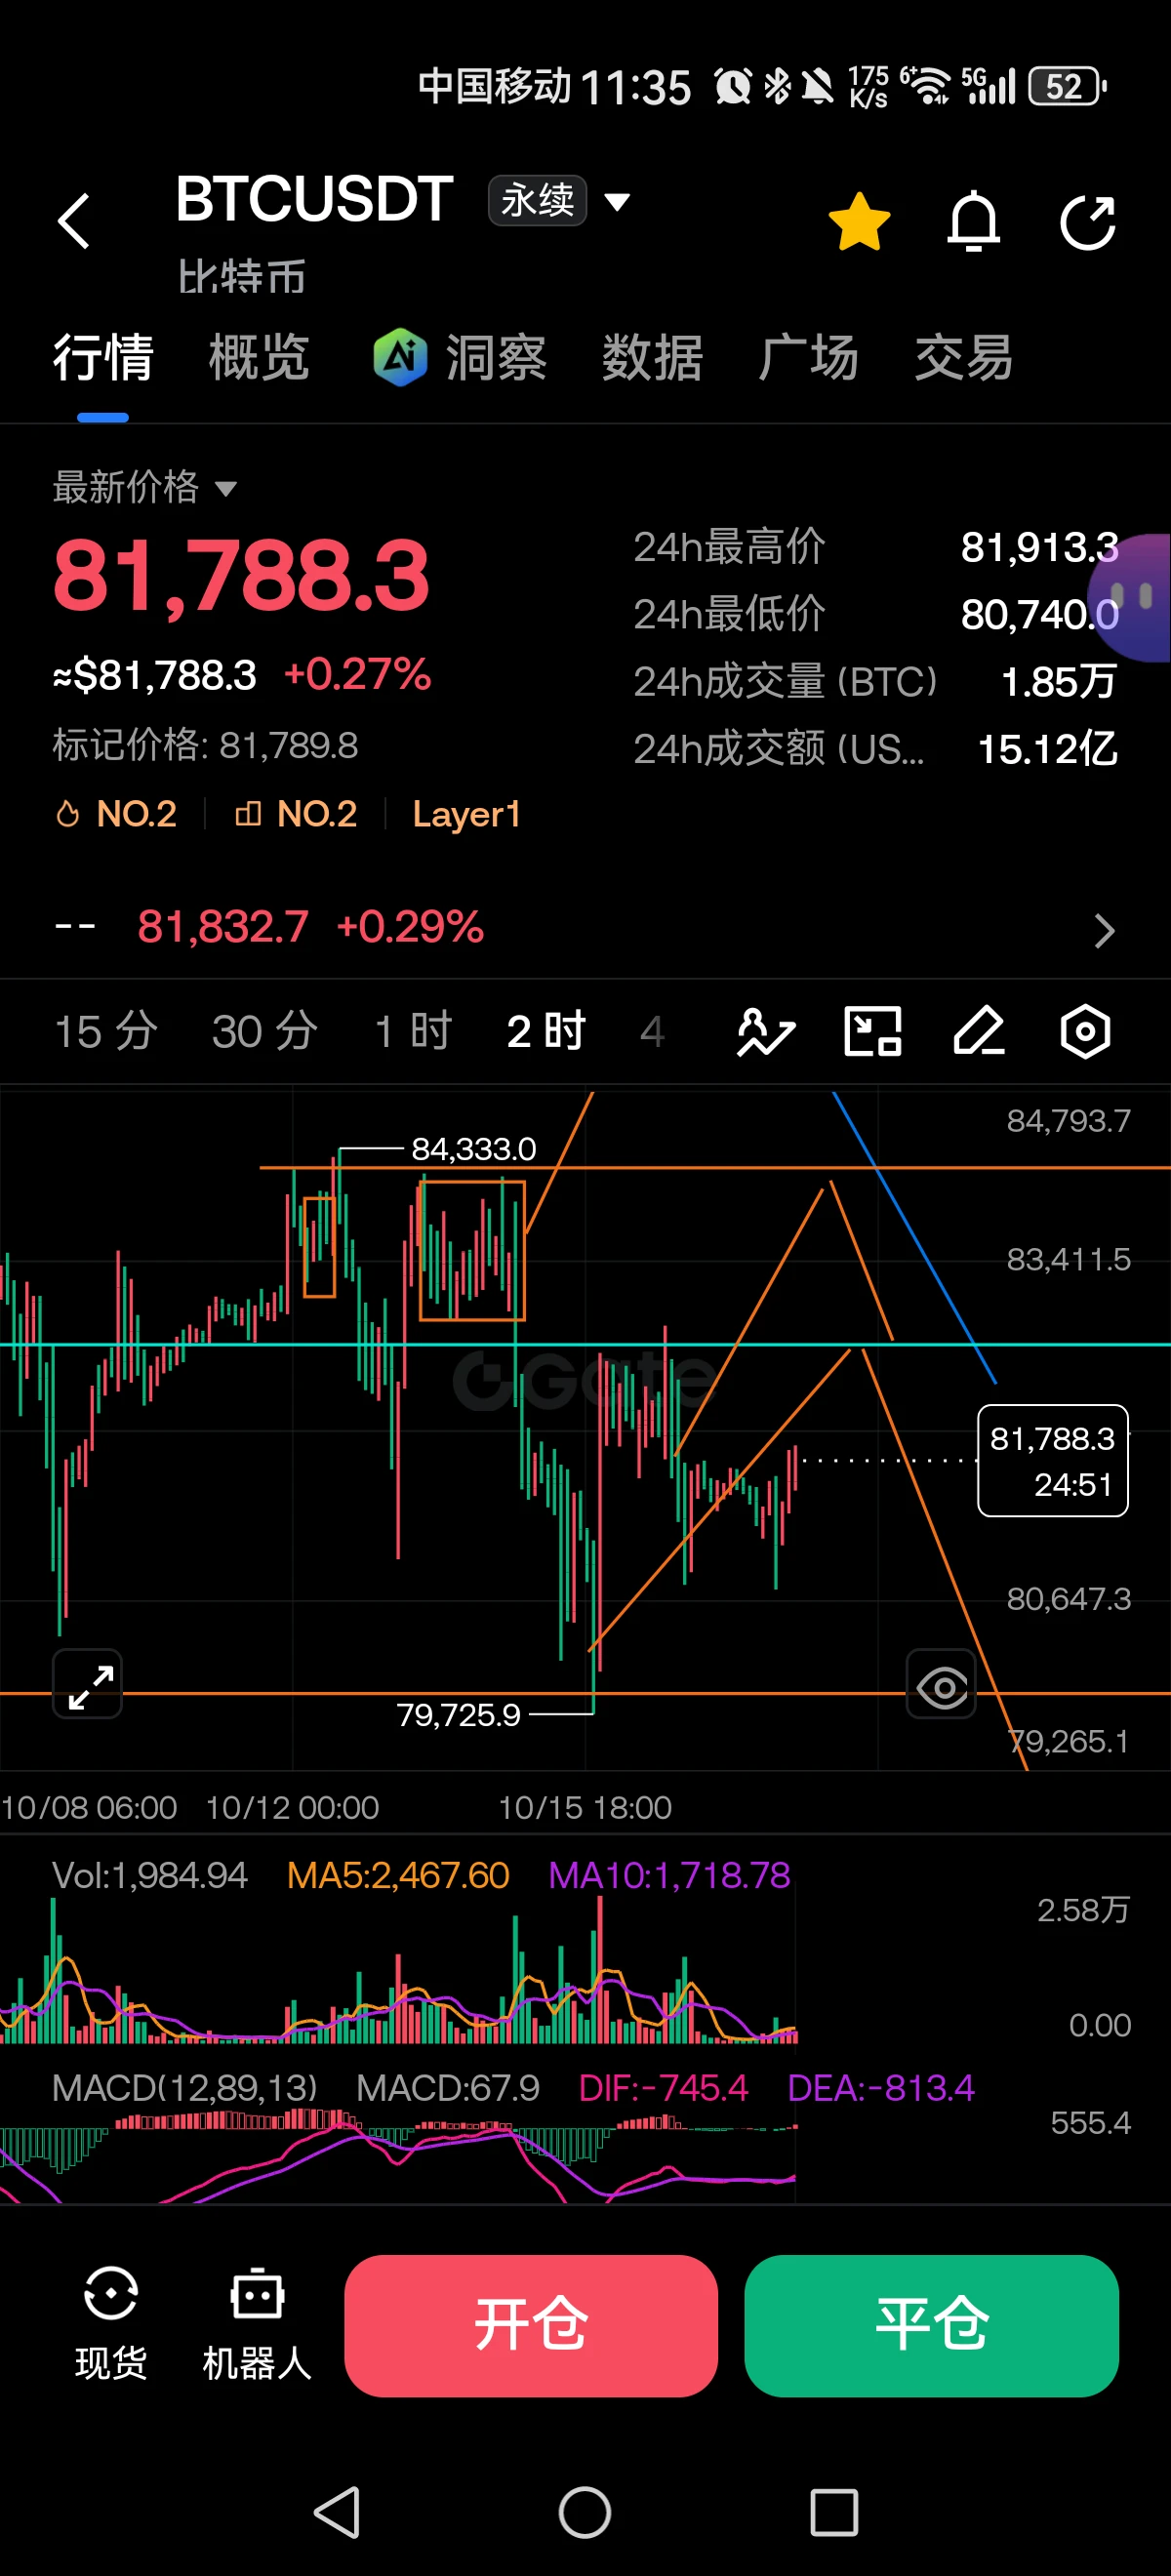
October 2026, nicknamed “Uptober” (traditionally a bullish month for digital assets), has plenty of surprises in store for investors this time around. Bitcoin is holding around $81,000 – $82,500, showing local resilience after a recent shock triggered by US macroeconomic data. A difficult year-long correction from last fall’s all-time high of $126,000 is now behind us, and the market is trying to find a solid bottom.
Here are the key events shaping the crypto news agenda today:
1. Inflation shock and “Red October”
The seasonal rally slowed after the release of fresh US Consumer Price Index (CPI) and Producer Price Index (PPI) reports. Inflation readings came in above analysts’ forecasts (CPI rose 3.7%), immediately strengthening expectations of another interest rate hike by the Federal Reserve (Fed) at its upcoming meeting on October 27–28.
Against this backdrop, a massive wave of margin liquidations hit the market, with nearly $1 billion worth of traders’ positions forcibly closed in a single day. Bitcoin briefly fell below $80,000, but buyers quickly bought the dip, bringing the asset back to current levels.
2. Ethereum struggles amid community optimism
Ethereum (ETH), the second-largest cryptocurrency by market capitalization, is going through a difficult period and trading around $2,400 – $2,480. The coin has lost about 10% of its value since the start of October, while US spot Ether ETFs have seen net outflows of more than $300 million.
Surprisingly, on-chain analysts at Santiment are recording unusually high bullish sentiment on social media: almost 59% of mentions of ETH remain positive. Experts warn that such blind crowd optimism during a downturn often signals that “panic selling” is not over yet, and the asset could set new local lows. Nevertheless, long-term forecasts from major players such as Arthur Hayes remain ambitious — up to $10,000 per ETH by the end of the cycle.
3. Institutional breakthrough: Deutsche Bank enters the arena
While retail traders debate charts, traditional financial giants continue to build infrastructure. Deutsche Bank is reportedly just weeks away from launching its own digital asset custody service in Germany.
The head of corporate banking at Germany’s largest lender, Gerald Podobnik, confirmed that after launching in Europe, the platform will quickly expand into Asian financial centers. This is a crucial signal that major European capital is no longer afraid of volatility and is preparing to fully embrace the Web3 industry.
4. Tokenization and new laws: crypto instead of a mortgage?
The world of cryptocurrency regulation and real-world applications is changing before our eyes:
• Crypto mortgages in the US: Federal Housing Finance Agency (FHFA) Director William J. Pulte has instructed mortgage giants Fannie Mae and Freddie Mac to develop mechanisms for considering cryptocurrency assets when assessing borrowers for mortgages. Major players such as Better and Coinbase are already testing the first mortgage products backed by digital coins.
• Global stablecoin: Samsung Corporation announced that it will integrate cross-border USDC stablecoin transfers directly into Samsung Wallet for 82 million Galaxy devices worldwide, starting at the end of October.
• Regulation in Russia: We remind you that new legislation recognizing cryptocurrency as property has come into force in Russia. At the same time, according to clarifications from the Central Bank, the regulator is laying the groundwork for a ban on direct P2P transactions between individuals, which is planned to be fully introduced by summer 2027.
Bottom line: The market is in an accumulation phase and heavily dependent on the US macroeconomic backdrop. Speculative fervor has eased somewhat, but fundamental developments — from the arrival of European banks to crypto’s integration into the real economy and real estate — prove that digital assets have become firmly established in the global financial system.
Here are the key events shaping the crypto news agenda today:
1. Inflation shock and “Red October”
The seasonal rally slowed after the release of fresh US Consumer Price Index (CPI) and Producer Price Index (PPI) reports. Inflation readings came in above analysts’ forecasts (CPI rose 3.7%), immediately strengthening expectations of another interest rate hike by the Federal Reserve (Fed) at its upcoming meeting on October 27–28.
Against this backdrop, a massive wave of margin liquidations hit the market, with nearly $1 billion worth of traders’ positions forcibly closed in a single day. Bitcoin briefly fell below $80,000, but buyers quickly bought the dip, bringing the asset back to current levels.
2. Ethereum struggles amid community optimism
Ethereum (ETH), the second-largest cryptocurrency by market capitalization, is going through a difficult period and trading around $2,400 – $2,480. The coin has lost about 10% of its value since the start of October, while US spot Ether ETFs have seen net outflows of more than $300 million.
Surprisingly, on-chain analysts at Santiment are recording unusually high bullish sentiment on social media: almost 59% of mentions of ETH remain positive. Experts warn that such blind crowd optimism during a downturn often signals that “panic selling” is not over yet, and the asset could set new local lows. Nevertheless, long-term forecasts from major players such as Arthur Hayes remain ambitious — up to $10,000 per ETH by the end of the cycle.
3. Institutional breakthrough: Deutsche Bank enters the arena
While retail traders debate charts, traditional financial giants continue to build infrastructure. Deutsche Bank is reportedly just weeks away from launching its own digital asset custody service in Germany.
The head of corporate banking at Germany’s largest lender, Gerald Podobnik, confirmed that after launching in Europe, the platform will quickly expand into Asian financial centers. This is a crucial signal that major European capital is no longer afraid of volatility and is preparing to fully embrace the Web3 industry.
4. Tokenization and new laws: crypto instead of a mortgage?
The world of cryptocurrency regulation and real-world applications is changing before our eyes:
• Crypto mortgages in the US: Federal Housing Finance Agency (FHFA) Director William J. Pulte has instructed mortgage giants Fannie Mae and Freddie Mac to develop mechanisms for considering cryptocurrency assets when assessing borrowers for mortgages. Major players such as Better and Coinbase are already testing the first mortgage products backed by digital coins.
• Global stablecoin: Samsung Corporation announced that it will integrate cross-border USDC stablecoin transfers directly into Samsung Wallet for 82 million Galaxy devices worldwide, starting at the end of October.
• Regulation in Russia: We remind you that new legislation recognizing cryptocurrency as property has come into force in Russia. At the same time, according to clarifications from the Central Bank, the regulator is laying the groundwork for a ban on direct P2P transactions between individuals, which is planned to be fully introduced by summer 2027.
Bottom line: The market is in an accumulation phase and heavily dependent on the US macroeconomic backdrop. Speculative fervor has eased somewhat, but fundamental developments — from the arrival of European banks to crypto’s integration into the real economy and real estate — prove that digital assets have become firmly established in the global financial system.