Square
Following
Hot
News
Notifications
Profile
Share your thoughts
placeholder
Article
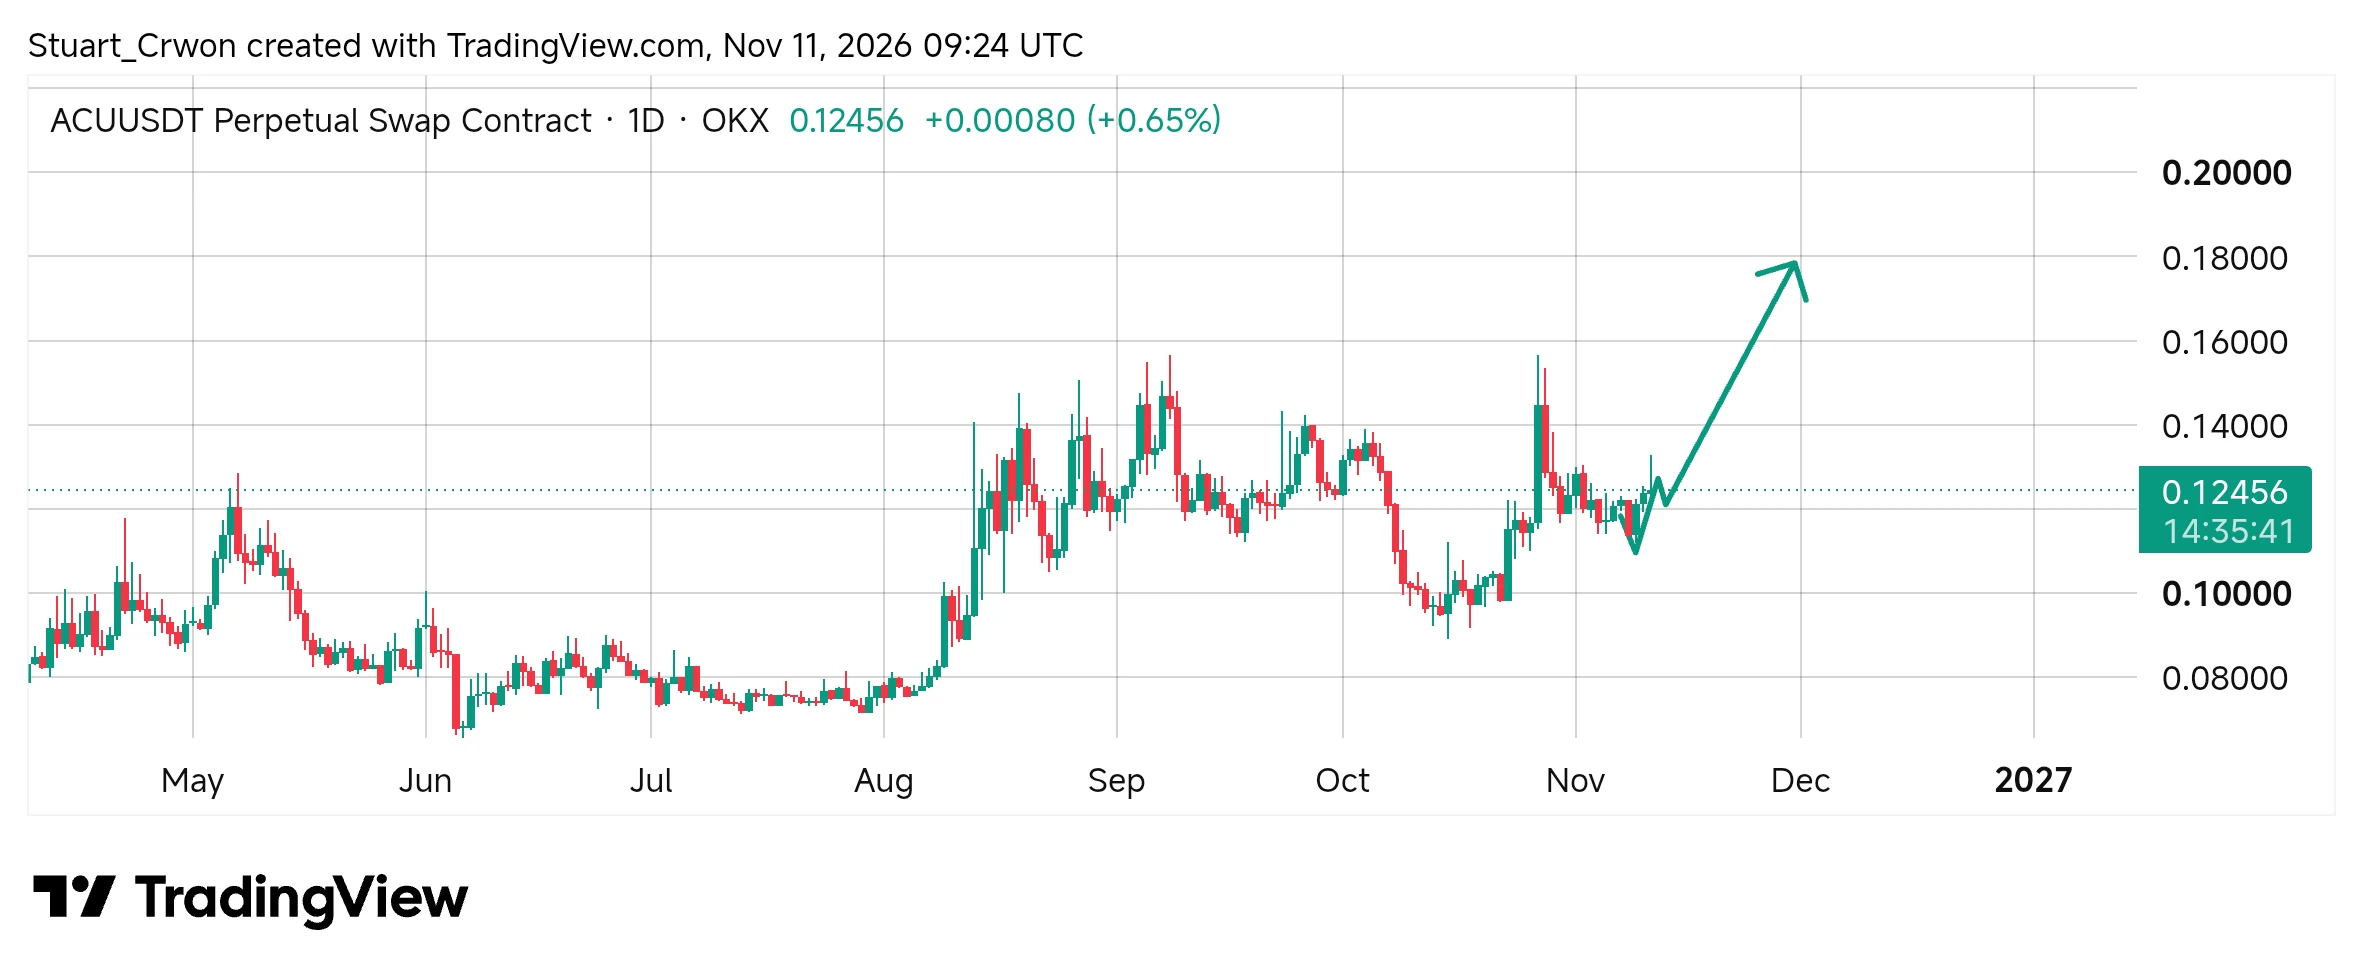
$ACU continues to show strength.

Holding above $0.12+ is a good sign, and the bullish structure remains intact for now.

I'm still holding my position and watching how buyers handle the next move.

No need to chase every candle. Let the setup play out.

#ACU #GateGlobalComplianceExpansion #GateRanksThirdIn24HNetInflows #PolymarketAnnualizedRevenueTops1.8B
post-image
ACU+1.16%
  • 1
$MVLL I really missed a big chunk of this move. When I lost $180k last year, nobody told me I’d be able to make it back with this today. It’s at 12.24 now, up 24.64% in 24 hours, with a low of 9.25 and a high at the current price. Trading volume is 49.4M—this is backed by real volume, not a fake pump.

Let me pour some cold water on this: chasing a move this big in a single day is just feeding the market makers. But looking at the data, the 9.25–12.24 range has seen ample turnover, and 49.4M in trading volume is active for a small- to mid-cap asset, which shows real money is buying in. The key
MVLL-0.19%
  • 8
  • 2
Trenches
mihao
m
bade
b
mihao
4Cxj...pump
Market Cap
$.
Change
.
24h Vol
$.
Holders
.
AGT
A
bade
b
AGT
0x5d...e274
Market Cap
$.
Change
.
24h Vol
$.
Holders
.
HOLD
H
bade
b
HOLD
4iJ7...pump
Market Cap
$.
Change
.
24h Vol
$.
Holders
.
DacityCoin
D
bade
b
DacityCoin
DKYc...pump
Market Cap
$.
Change
.
24h Vol
$.
Holders
.
PIEVERSE
P
bade
b
PIEVERSE
0x0e...25a9
Market Cap
$.
Change
.
24h Vol
$.
Holders
.
ON | Short 🔴 | Bearish | 15 minutes, 24 hours: -24.63% | Volume: 69.8M USDT
Short rationale: Price below EMA200; EMA20/50/200 in bearish alignment; RSI14 at 29.5; MACD histogram negative; ADX14 at 43.4; volume is 0.55 times the 20-candle average; trend pullback/continuation.
Entry: 0.0859
Stop-loss: 0.0899497
Take-profit 1: 0.0808379 | Take-profit 2: 0.0778006 | Take-profit 3: 0.073751
Entry price for reference only; do not chase the price. This trade setup is invalidated if the stop-loss is hit. Technical analysis setup only; not financial advice.
$ON $ON
post-image
ON+4.77%
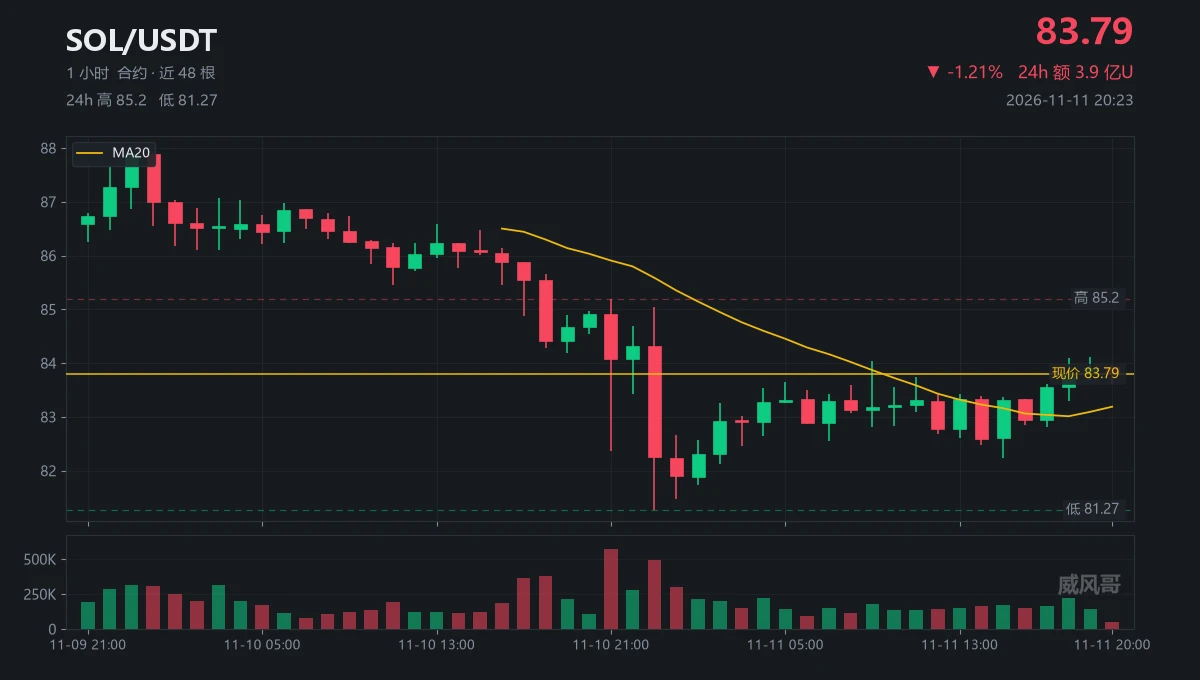
(Someone asked me whether this market could be shorted. I said to look at one candle first.)
(The one at 21:00 last night: opened at 84.91, closed at 84.08, with 2.89x volume.)
(The heaviest of the 48 candles, and in the end neither side won.)
(“It dropped 6.75 bucks. Just follow it with a short and you’re done.”)
(I believed that before. I believed it twice last year, and both times the market moved the other way.)
(On 11-10 at 23:00, it touched 81.27 on 2.52x volume. That was a bottom formed by a sell-off.)
(Over the next 24 hours, the low rose from 82.24 to 83.69 and didn’t break lower agai
post-image
SOL-0.74%
  • 10
  • 2
BTC Below $71K: $600M Longs at Risk — Key Levels to Watch
live-cover
LIVE2,236
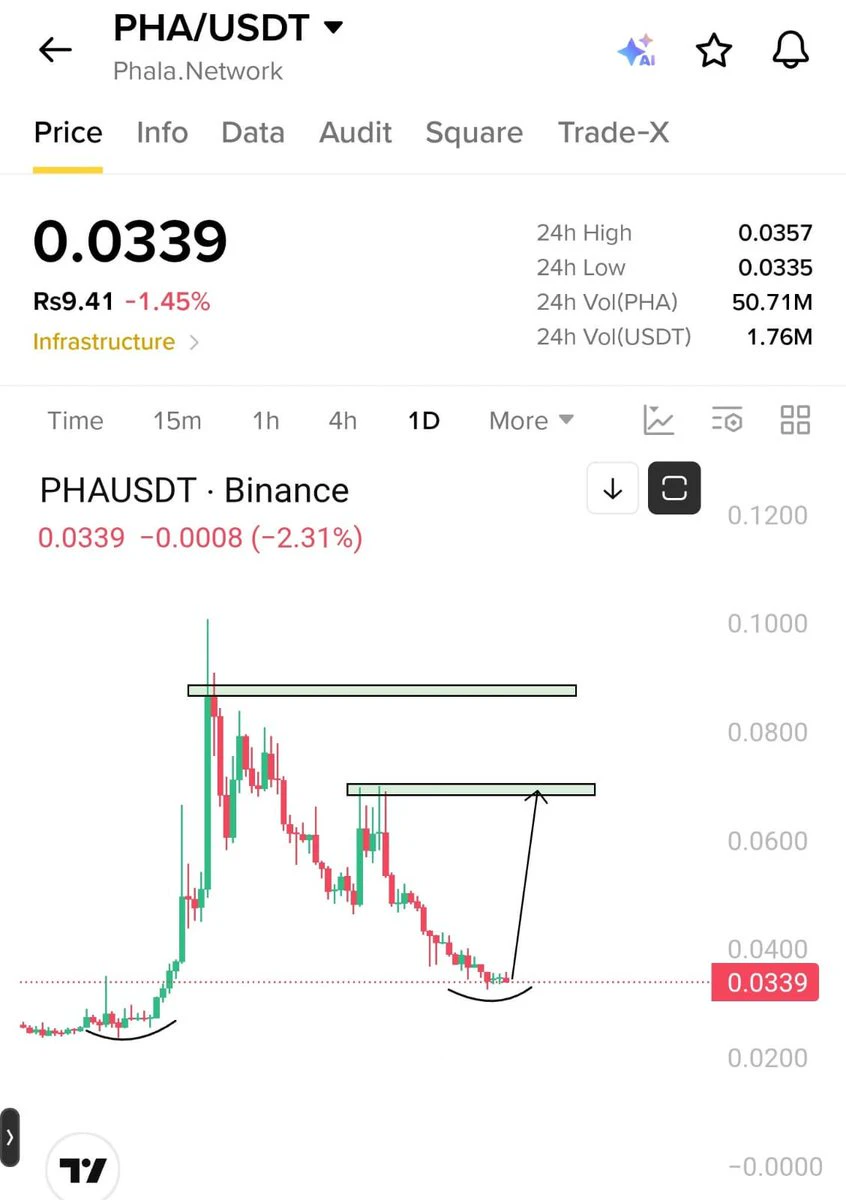
$pha Insider News Coming Sooon
#pha will Pump minimum 50% From
here
Easy money
post-image
PHA+5.36%
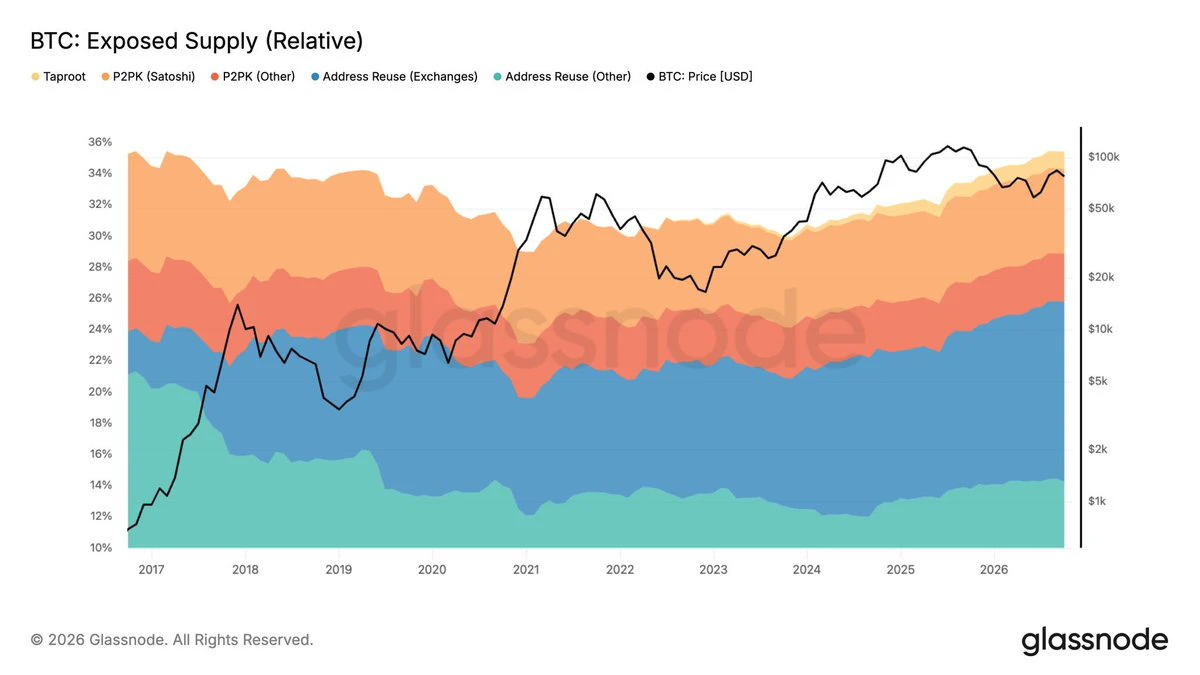
Over 7 Million Bitcoin is now at risk from future quantum attacks
This is over one third of Bitcoin's total supply and it's only going up
Just 6 months ago, it was 30.2% and it's at 35.4%, including 11.6% of BTC supply linked to exchange addresses
This is why Bitcoin needs a quantum upgrade this decade, or else things could get ugly
post-image
BTC-0.67%
Tensor10 chart/table
BTC falls below $71k, putting $600 million in long positions
live-cover
LIVE2,658
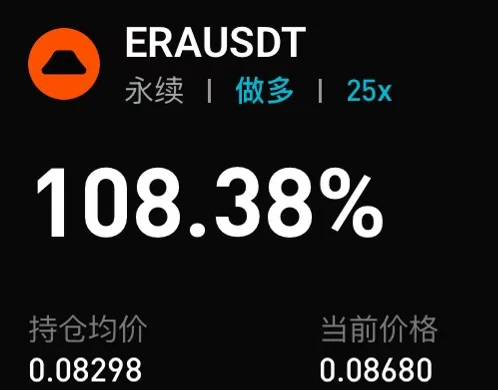
$ERA Buy the dip and go long; take profits steadily

After cashing out following ERA’s surge, short-term profit-taking diverged and the price began to pull back. It found support at its 0.079 launch price, then stabilized and rose after a downward wick tested the bottom. Xingjie saw an opportunity to go long and entered decisively once the uptrend stabilized, taking profits at 2x.

The price is pulling back again after short-term profit-taking, but Xingjie remains bullish long term and sees an opportunity to go long again at a lower level.#Gate全球合规版图扩展
post-image
ERA+24.21%
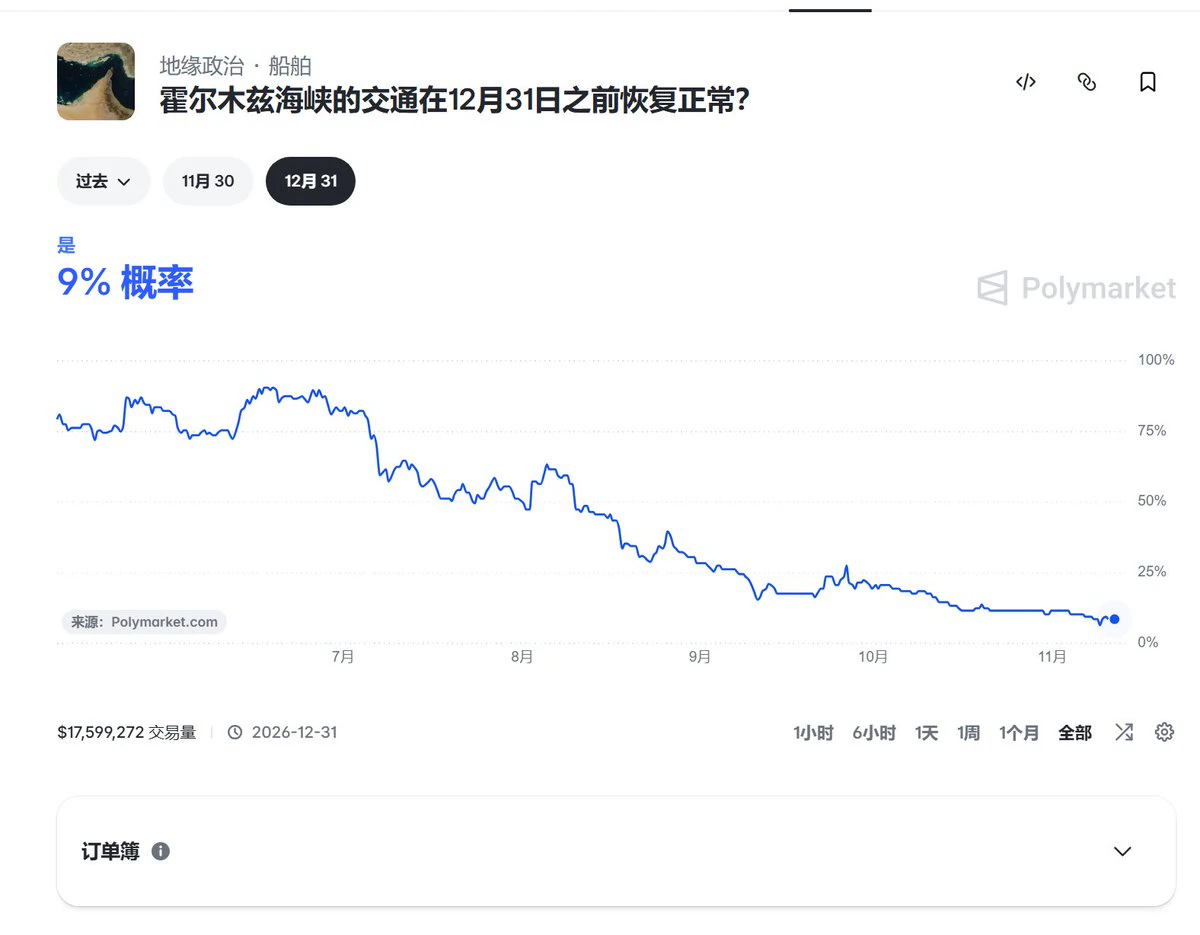
The U.S. and Iran seem to be actively negotiating, and oil prices have fallen.
However, on @Polymarket, forecasts for the Strait of Hormuz reopening:
The odds of it reopening by the end of November are 2%, and by the end of December, 9%. This trend has been almost entirely downward, with no significant rise in recent days either.
Watch out for a reversal
post-image
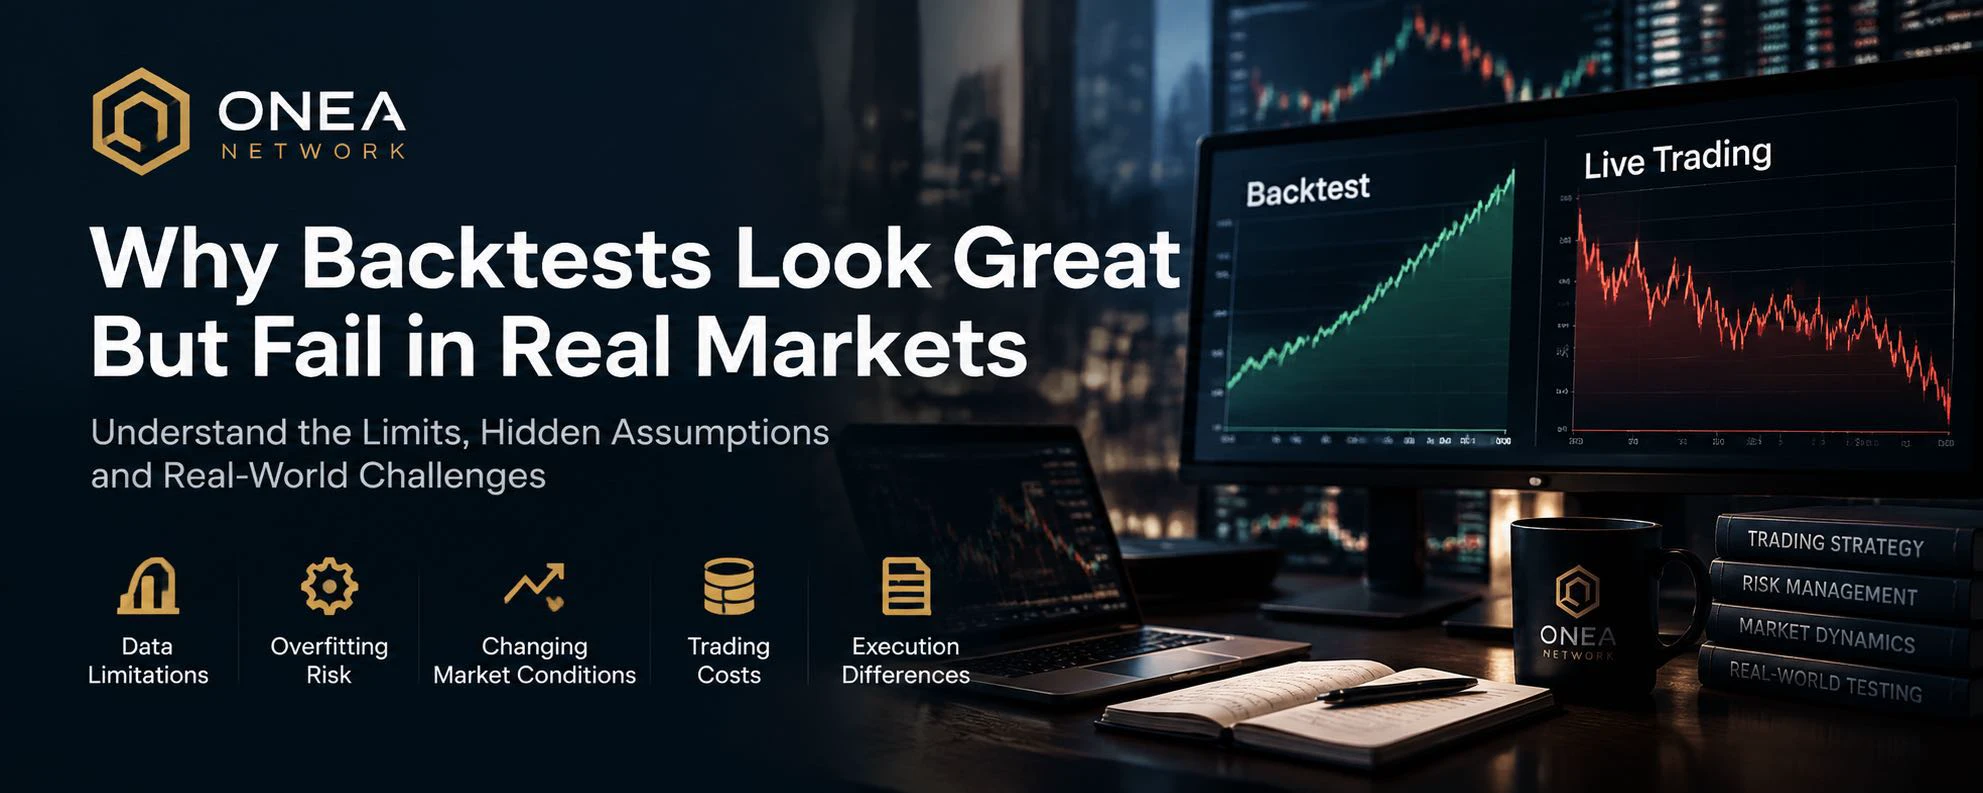
Why might a trading strategy that performed well on historical data gradually fail in the real market?

A beautiful backtest curve does not mean that the strategy already has a stable edge in live trading.

The problem is often not that backtesting is worthless, but that we may overestimate what historical data can prove.

There are four key reasons worth paying attention to.

1. Overfitting: The strategy memorized history but did not truly understand the market.

Continually adjusting parameters until the historical return curve looks beautiful can easily make the strategy fit past noise rath
post-image
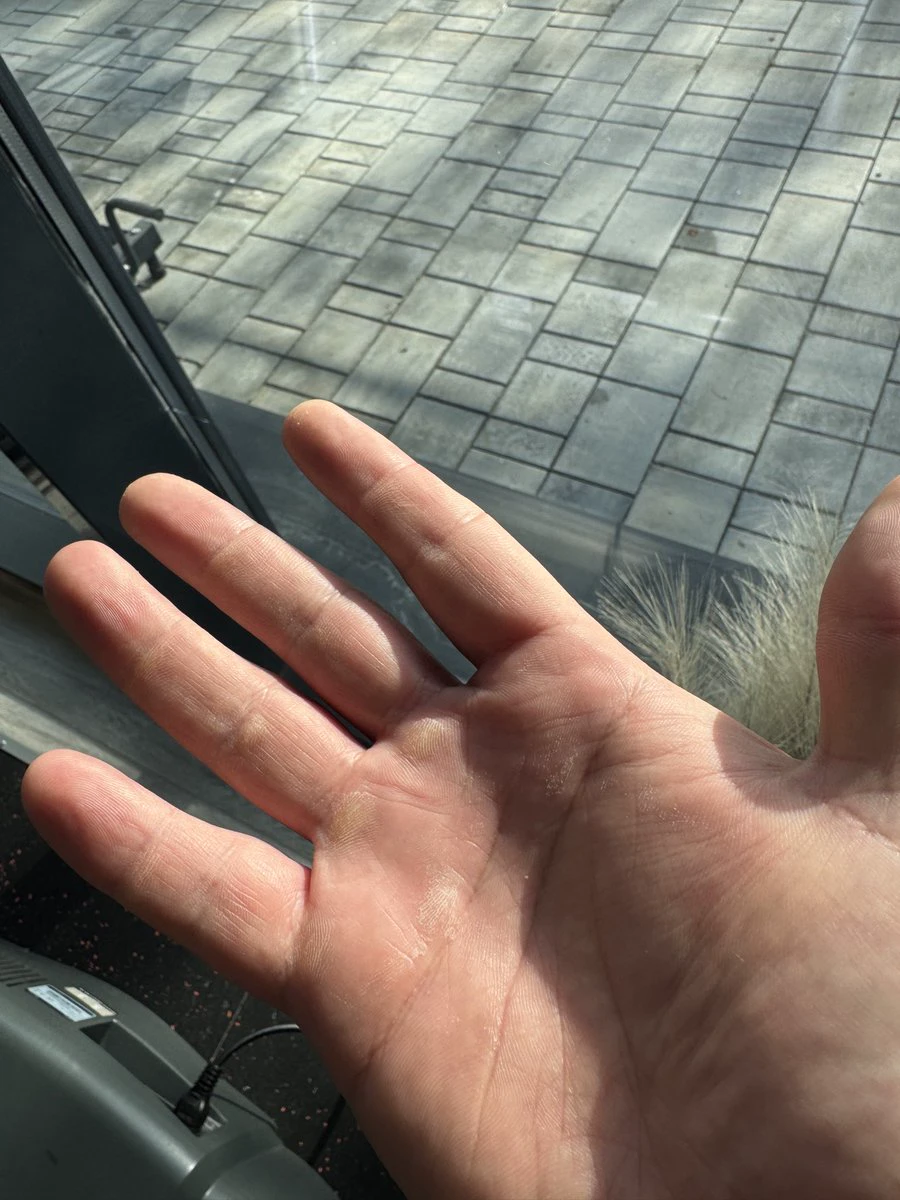
You can fake the smile, you can fake the calm,
But you can’t fake the callus on your palm.
ProofOfWork🫡
post-image
Will be in London for DAS/Solana events/Breakpoint
Looking to meet and connect with anyone interested in:
- PreIPOs, investing, earning, and tokenising onchain
- The space economy (interest in AI/Manufacturing in space)
- Where DeFi is going next
- Investors, capital allocators, chains, funds, family offices and those looking for some of the best opportunities in the coming years
- Liquid investing in markets going into 2027
- Last but not least, our beloved community around @Starcap_xyz/@RKST_xyz
Hit me up, I'll be around today/tomorrow and next week!
Yes, this is a cool pic of a Deer I too
post-image
SOL-0.77%
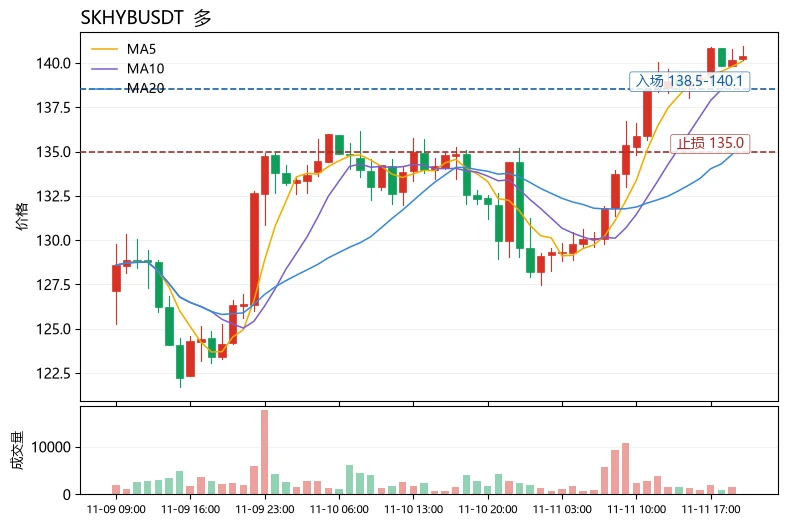
The Fear & Greed Index has fallen to 29. Many people's first reaction is "panic means it's time to buy the dip," which is precisely the most typical trading misconception—sentiment readings are just background, not entry signals. What truly determines direction is how capital rotates between sectors and whether BTC, the market leader, is moving at a pace that gives altcoins room to breathe. The index is currently in fear territory, indicating that fresh capital is cautious, but strong performers like SKHYB can still rise against the trend. This is essentially the result of existing capital con
post-image
SKHYB
SKHYBSK Hynix
Pump.Fun
MC:$3.08KHolders:1
0%
BTC-0.67%
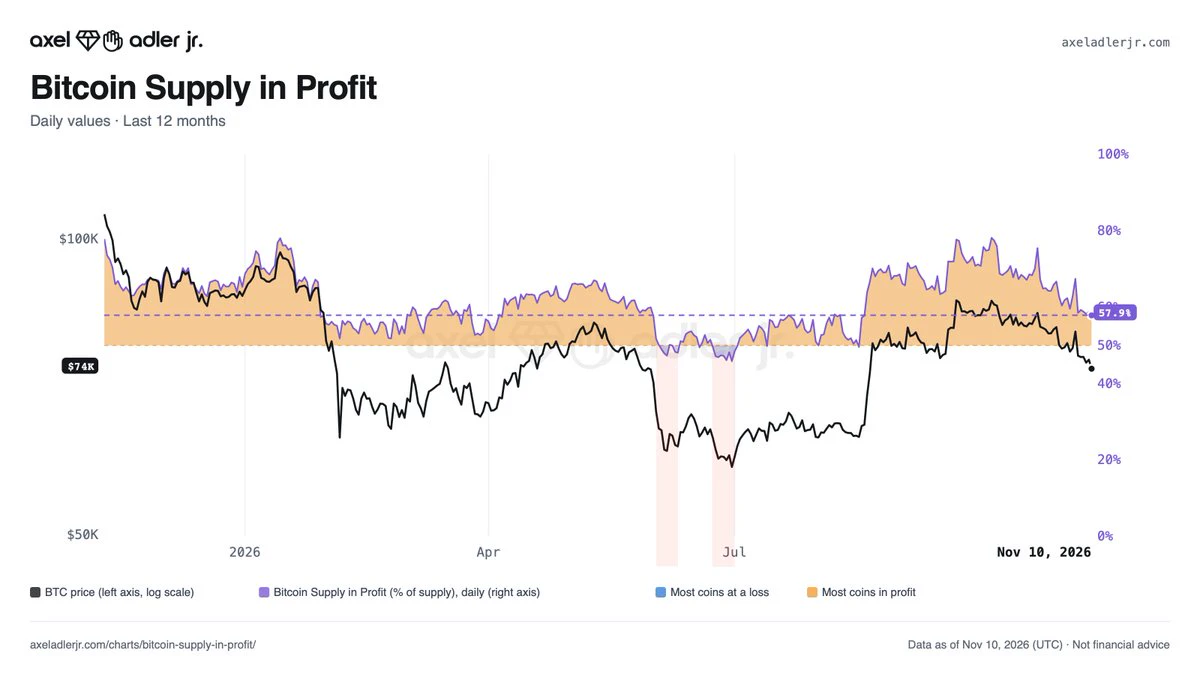
Profit still dominates across the network, 58% of BTC supply remains in profit, just 8 percentage points above the stress threshold.
post-image
BTC-0.67%
applied to the NULLS LIST.
slot #4028 · save data detected
@nullsxyz
post-image
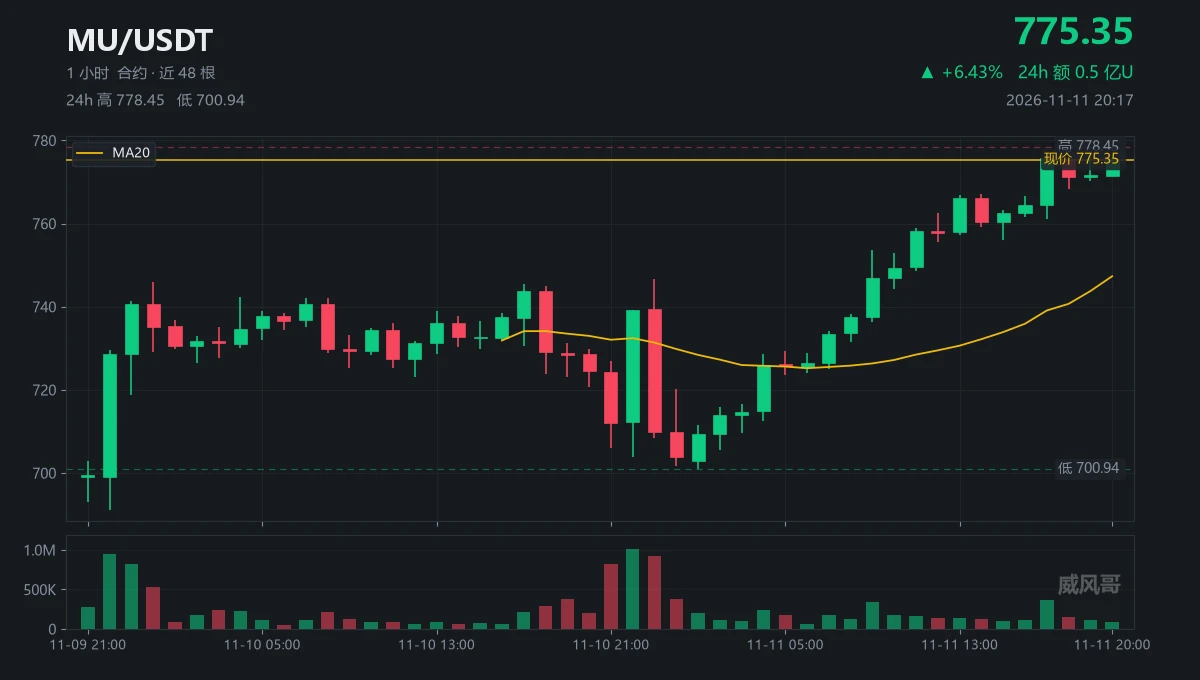
Three prices: 691.13, 739.28, and 778.45.
· 691.13 was the candle from the night of 11-09, with 3.8x volume. After that wick, price never came back.
· 739.28 was the candle at 22:00 on 11-10, which sparked the move on 4x volume and closed here.
· 778.45 was the candle just now, with only 0.34x volume.
· Over 48 hours, price rose from 691 to 778, up 12.6 points, with each low higher than the last.
· Here’s my hypothesis: this rally was bought up, not pushed up.
· Criterion one: the candle making a new high had only one-third the average volume of the past 48 candles.
· Criterion two: the candle
post-image
MU-0.63%
  • 8
  • 2
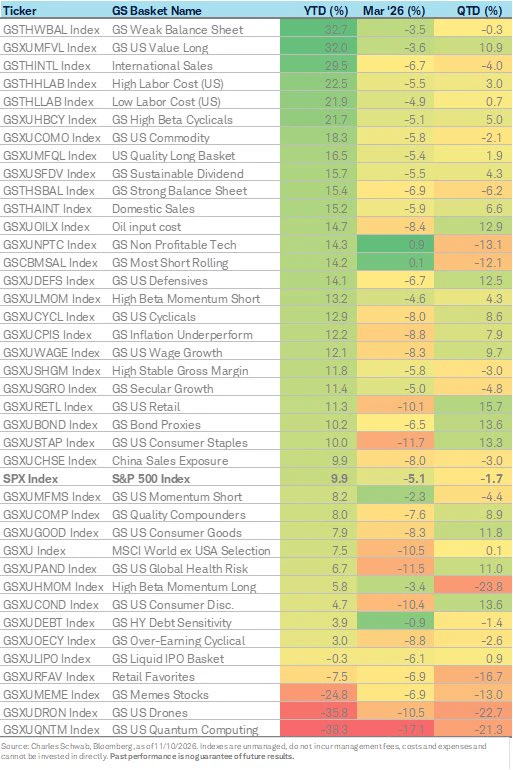
Baskets’ performance
post-image
Load More

Join 40 M users in our growing community

⚡️ Join 40 M users in the crypto craze discussion

💬 Engage with your favorite top creators

👍 See what interests you

Trending Topics

GateIPOAccessAnthropic

138.67k Views1.43k Discussing

Gate IPO Access Phase 3 features Anthropic (ANT), with USDT subscription interest starting from 100 USDT. Successful allocations will be delivered as real shares to Gate Stock Accounts. Indicative price: $70–$78/share Subscription: Nov 12–17 (UTC+8) Allocation is not guaranteed. Please manage risk accordingly. [👉 Subscribe Now](https://www.gate.com/ipos/ipo-access/anthropic-ipo-access/69)

USOctoberCPIBeatsExpectations

91.45k Views2.71k Discussing

GateGlobalComplianceExpansion

18.69k Views373 Discussing

View More