

Square
Following
Hot
News
Notifications
Profile
Share your thoughts
placeholder
Article
$UAI Guys, looks like it. This is a classic pig-butchering scam
post-image
UAI-7.58%
  • 1
165,000 jobs stun markets! Fed December rate hike probability hits 77.7%—rate-cut hopes dashed?

Investors had just gotten ready to pop champagne for a year-end rally when U.S. nonfarm payrolls suddenly poured cold water on things.
The U.S. added 165,000 nonfarm jobs in October, well above market expectations. The strong labor market has renewed concerns that the Fed may continue to maintain its tight policy.
Even more striking, the probability of a December rate hike reportedly rose to 77.7%.
What does this mean? Investors who had been expecting monetary policy to turn dovish may now need to
MU+4.71%
Trenches
ZIG
Z
bade
b
ZIG
0x8c...1145
Market Cap
$.
Change
.
24h Vol
$.
Holders
.
STONK
S
bade
b
STONK
6GmA...UNgx
Market Cap
$.
Change
.
24h Vol
$.
Holders
.
IDOL
I
bade
b
IDOL
0x3b...ab07
Market Cap
$.
Change
.
24h Vol
$.
Holders
.
BTC
B
bade
b
BTC
C5xp...pump
Market Cap
$.
Change
.
24h Vol
$.
Holders
FLOAT
F
bade
b
FLOAT
Bv1a...BMmr
Market Cap
$.
Change
.
24h Vol
$.
Holders
.
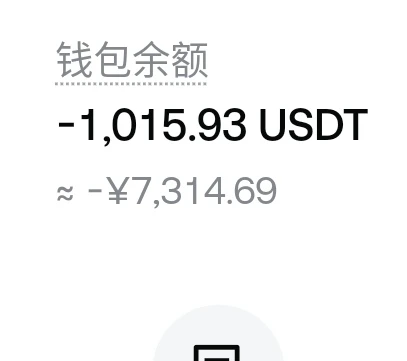
Even now, the ones I feel I've let down the most are my family 03 A College Student Boldly Ventures into the Crypto World
Support and resistance levels are among the most fundamental and practical concepts in technical analysis. Many traders study candlesticks and indicators every day, yet overlook an important question: at which price levels are buying and selling pressure likely to shift?
First, a support level is an area where buying pressure may increase as the price falls. When the price approaches this level, some buyers may start entering the market, slowing the decline. But a support level does not mean the price definitely won’t break below it.
Next, a resistance level is an area where selling pressure m
BTC-0.67%
OpenAI CFO: Data center investments will not change due to the midterm elections.
live-cover
LIVE1,990
Market opportunities are always there,
but opportunities that are yours are rare.
Market action that doesn't fit your trading framework,
no matter how lively, has nothing to do with you.
Forcing your way in
means using your capital to pay for someone else’s market.
Only trade opportunities you understand;
staying out is also a trade.
post-image
I’m leaving it alone now, making back 20u a day, and I’ll be in the green in 50 days, then I won’t touch it again
post-image
  • 1
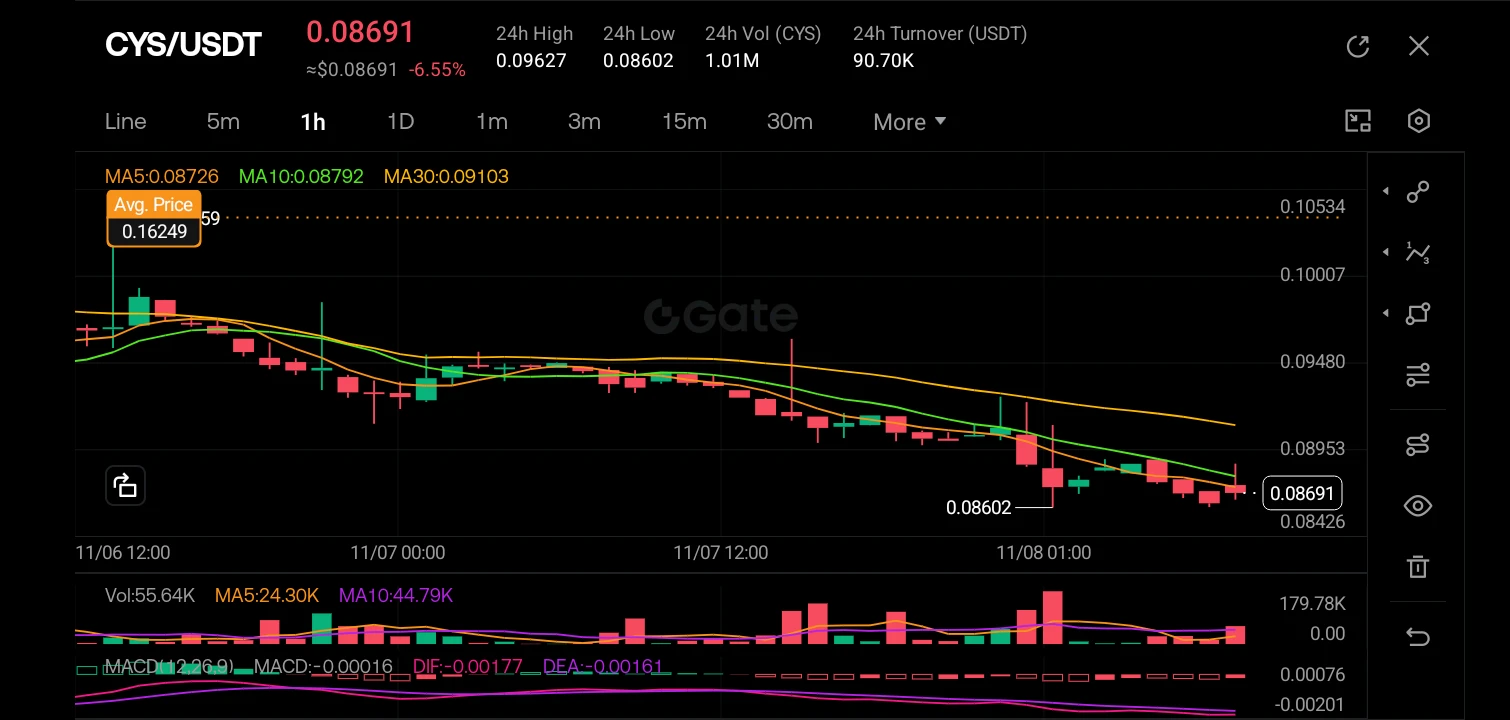
$CYS ‌
The 1-hour chart is locked in a brutal, unrelenting downtrend, with the price action consistently printing lower highs and lower lows while getting rejected by the descending moving averages (MA5, MA10, and MA30 are all fanned out bearishly above the price). The current price of 0.08691 is hovering dangerously close to the 24-hour low of 0.08602, indicating heavy selling pressure, and the MACD is deep in negative territory with the DIF and DEA lines pointing downward, confirming that bearish momentum is still in full control.

The recent price action features a series of predominantly
post-image
CYS-0.35%
  • 3
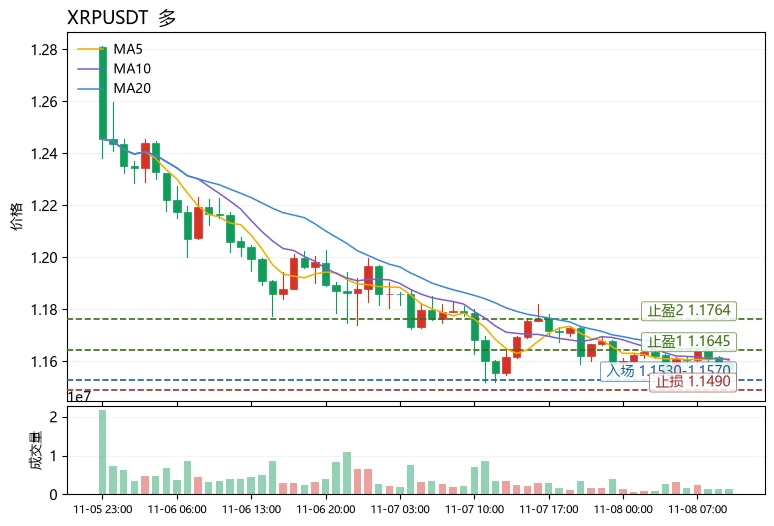
$XRP Current price: 1.1565. Resistance above is at 1.1645 (MA20) and 1.1764 (upper Bollinger Band), with support below at 1.1526 (lower Bollinger Band). The price is below MA5 (1.1604) and MA20 but above the lower Bollinger Band, forming a weak consolidation structure; bulls have yet to reclaim the medium-term moving average.
Technical breakdown: MA5 is below MA20, with the short-term moving average still capping rebounds. However, the MACD histogram is positive (+0.001018), indicating an early recovery phase as momentum shifts from bearish to bullish. RSI at 37.8 is approaching the weak zone
post-image
eur
eureur
Gate.Fun
MC:$5.55KHolders:3
0.06%
XRP-1.15%
ADA-1.48%
$FLUID Bullish momentum is fading, and a bearish structure is gradually taking shape.

FLUID has repeatedly failed to break above the $2.70 area, after which selling pressure continued to weigh on the market. On the 4-hour timeframe, price highs have been progressively lower, with consecutive bearish candles, and price is now testing the $2.20 support zone.
Short setup: Entry range: $2.205–$2.230 Target: $2.080 Stop level: $2.390
If $2.197 is decisively broken, the decline may accelerate further. It is advisable to wait for confirmation before acting and to strictly manage position risk.
$TRUM
post-image
FLUID-1.92%
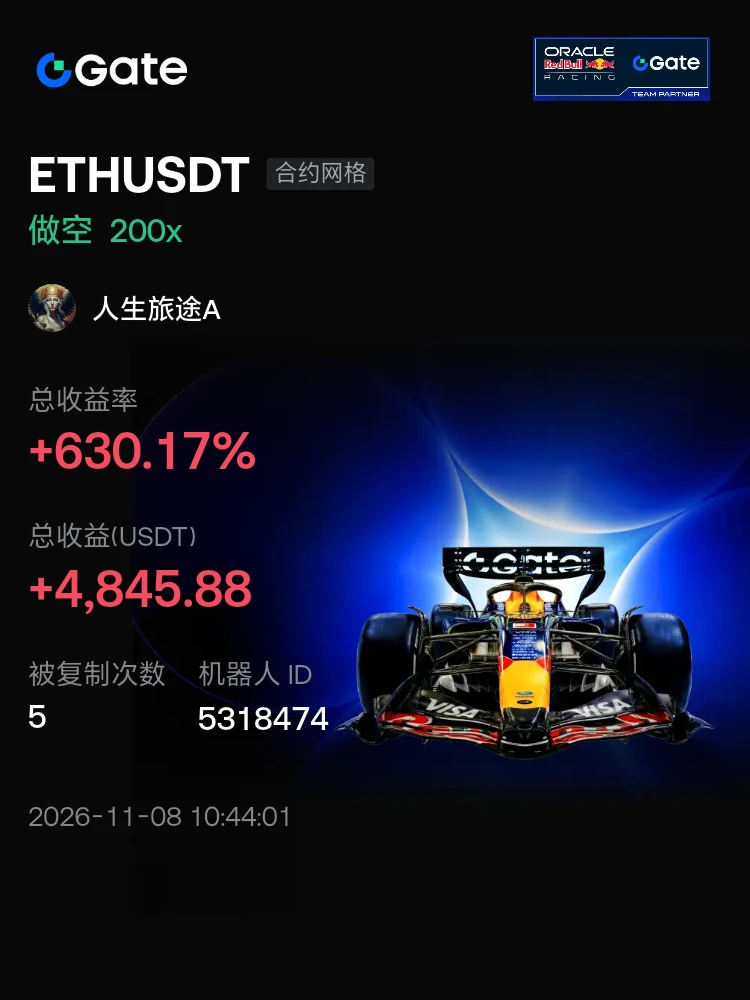
#交易机器人 I'm using the ETHUSDT contract grid bot on Gate—come copy my trades
post-image
$ARB The chart keeps forming higher lows. Brothers, take the opportunity to earn a bowl of Vietnamese pho🤩Go long now🔥🔥Take-profit 1: 0.182 Take-profit 2: 0.2 Take-profit 3: 0.25 Stop-loss: 0.139$IDOL $AIN
post-image
ARB+1.17%
IDOL-6.71%
AIN+3.85%
According to a report by The Information cited by IT Home, amid a global DRAM shortage and rising prices, TSMC is said to be researching the development of 3D DRAM at Nvidia’s request. If pursued, this could open up a new business, but would also expose the company to cyclical risks. TSMC denied the report, saying it would focus on logic chip foundry services.

The official position is that TSMC only does logic chip foundry work. However, the report cited two people familiar with the matter who said that, following a request from Nvidia, TSMC had begun developing a plan to manufacture 3D DRAM,
post-image
TSM+6.60%
NVDA+2.80%
BTC-0.67%
$IDOL recorded a $5.14K short liquidation around $0.03178, suggesting buyers are starting to pressure short positions. If price maintains its demand zone, another push higher could target liquidity resting above recent swing highs. Watch for a clean breakout supported by volume.
Support: $0.0305 – $0.0295
Resistance: $0.0325 – $0.0340
Next Target: $0.0360
Confirmation: Holding above $0.0325 could strengthen bullish momentum and open the door to a short squeeze.
Let's go $IDOL 🚀
post-image
IDOL-6.71%
#Ahr999EntersBottomBuyingZone
𝗔𝗵𝗿𝟵𝟵𝟵 𝗙𝗮𝗹𝗹𝘀 𝗕𝗲𝗹𝗼𝘄 𝟬.𝟰𝟱 𝗮𝘁 $𝟳𝟱,𝟳𝟴𝟯: 𝗪𝗵𝗮𝘁 𝘁𝗵𝗲 𝗕𝗼𝘁𝘁𝗼𝗺-𝗕𝘂𝘆𝗶𝗻𝗴 𝗦𝗶𝗴𝗻𝗮𝗹 𝗠𝗲𝗮𝘀𝘂𝗿𝗲𝘀, 𝗪𝗵𝗲𝗿𝗲 𝗶𝘁 𝗦𝗶𝘁𝘀 𝗮𝗻𝗱 𝗪𝗵𝗮𝘁 𝗶𝘁 𝗖𝗮𝗻𝗻𝗼𝘁 𝗣𝗿𝗼𝗺𝗶𝘀𝗲
With Bitcoin at $75,783, the Ahr999 index is back in its bottom-buying zone. The index sat at 0.50 on October 25, touched 0.45 on October 31 and November 1, read 0.44 on November 3 and 0.45 on November 4, per CoinAnk. A price of $75,783 puts it at roughly 0.43 by my math. The signal is back after about 80 days outside the zone, since the previous stretch bel
post-image
BTC-0.67%
NVDA+2.80%
NDAQ+0.28%
  • 2
🪔 HAPPY DIWALI 2026 🪔
🙏 शुभ दीपावली ✨
✨ May this Diwali bring endless happiness, peace, success & prosperity into your life. May Goddess Lakshmi bless you and your family with wealth, good health and positivity. ❤️
🙏 दीपावली की हार्दिक शुभकामनाएँ! 🪔
❤️ With Love
🔥 TEAM CRYPTO AMAN 🔥
post-image
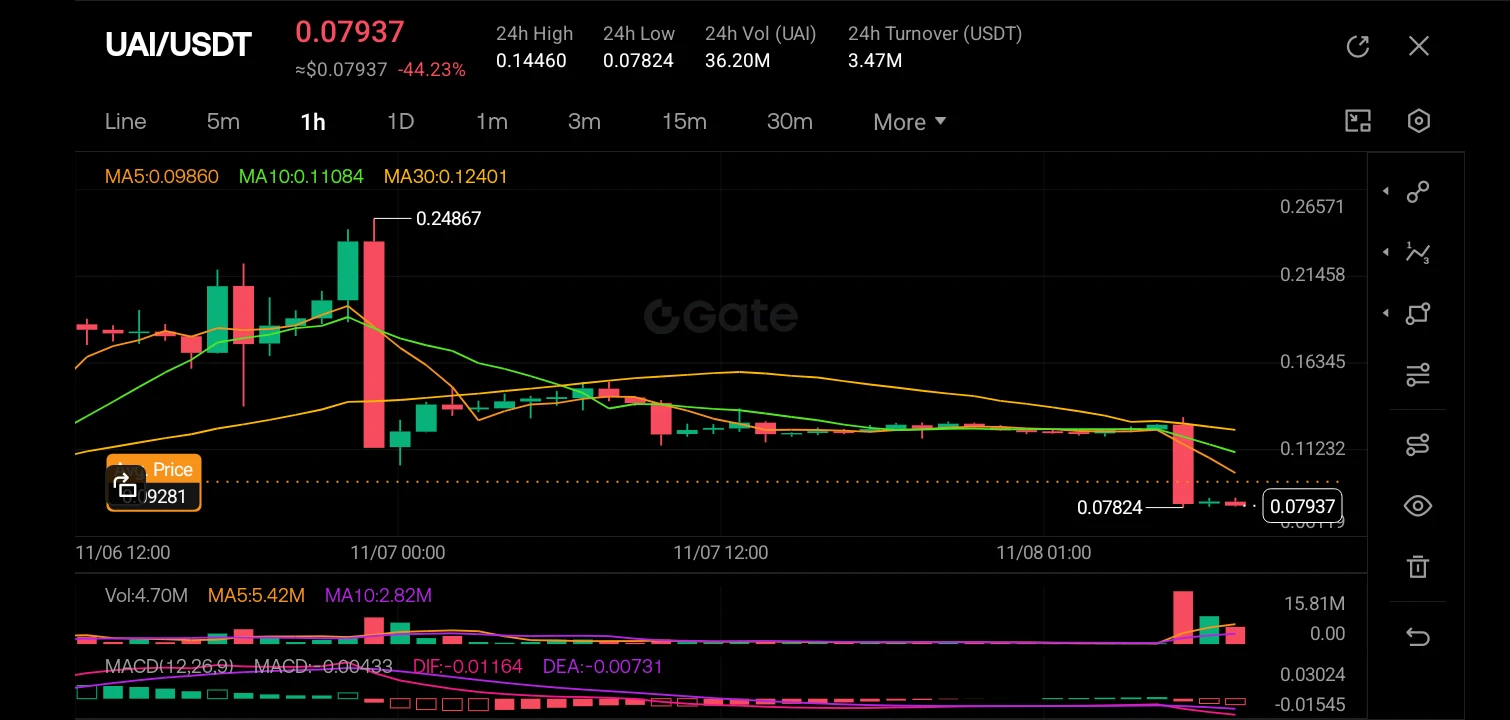
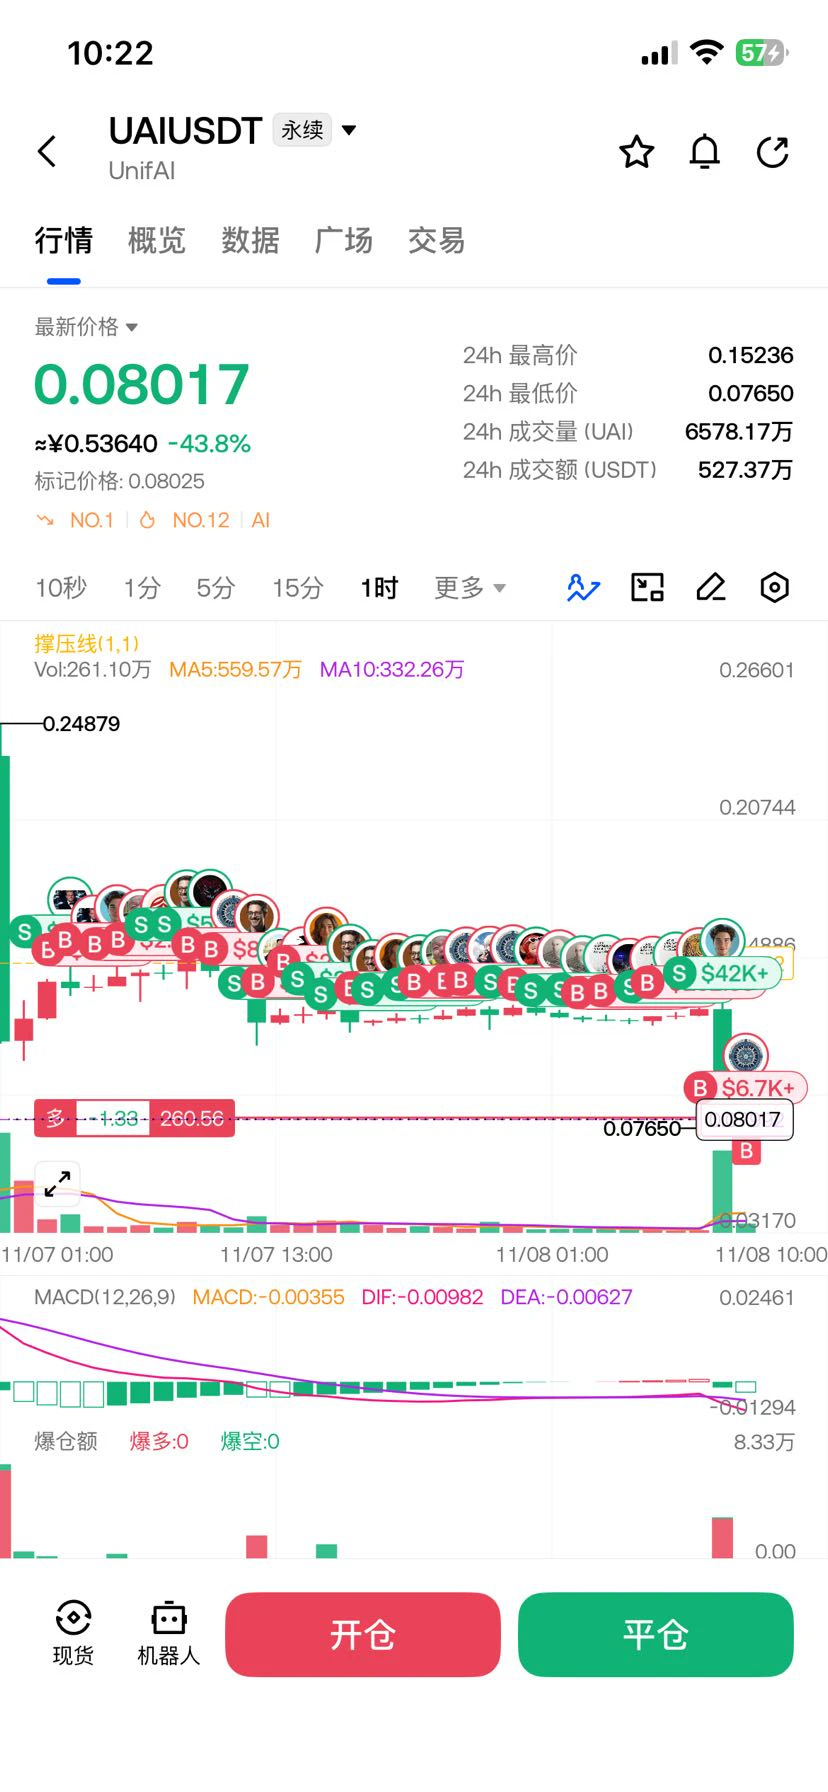
$UAI ‌
The 1-hour chart for UAI/USDT is showing a severe bearish breakdown, with the price currently sitting at 0.07937, representing a massive 44.23% drop over the 24-hour period. The chart clearly displays a steep waterfall decline from the recent high of 0.24867, completely obliterating the short and medium-term moving averages (MA5, MA10, MA30), which are now fanning out downwards in a classic bearish alignment. The most recent candle is a massive, long-bodied red marubozu that has crashed through any nearby support levels, accompanied by a significant volume spike (15.81M), indicating in
post-image
UAI-7.58%
  • 3
#BTCETFOutflowsContinue

Bitcoin ETF Outflows Continue: $1.28 Billion Leaves in One Week as Institutional Sentiment Weakens

The Myth: ETF Outflows Mean Bitcoin Is Finished

A common market myth is that when Bitcoin ETFs experience several days of withdrawals, the Bitcoin bull market must be over. That conclusion is too simple. ETF outflows are an important warning sign, but they do not automatically mean Bitcoin has lost its long-term value or that a major decline is guaranteed.

The real question is why investors are withdrawing money, how long the trend continues, and whether buyers are wi
post-image
BTC-0.67%
Speechless 😅!
A female driver makes a scene at the property management office.
Demands compensation.
The underground parking garage has serious safety hazards.
post-image
Load More

Join 40 M users in our growing community

⚡️ Join 40 M users in the crypto craze discussion

💬 Engage with your favorite top creators

👍 See what interests you

Trending Topics

USCPIDataIncoming

1.04k Views1.48k Discussing

The U.S. October CPI report will be released on November 10 at 8:30 a.m. ET. September CPI came in at 3.7% year over year, and markets will be watching closely for signs that inflation is cooling, especially in core CPI. A softer-than-expected reading could strengthen rate-cut expectations, while hotter inflation may pressure risk assets through higher Treasury yields and a stronger dollar. How do you think this CPI print will move $BTC, U.S. stocks and gold?

USAIStocksHitHard

23.56k Views3.69k Discussing

USNonfarmPayrolls

40.34k Views4.38k Discussing

View More