












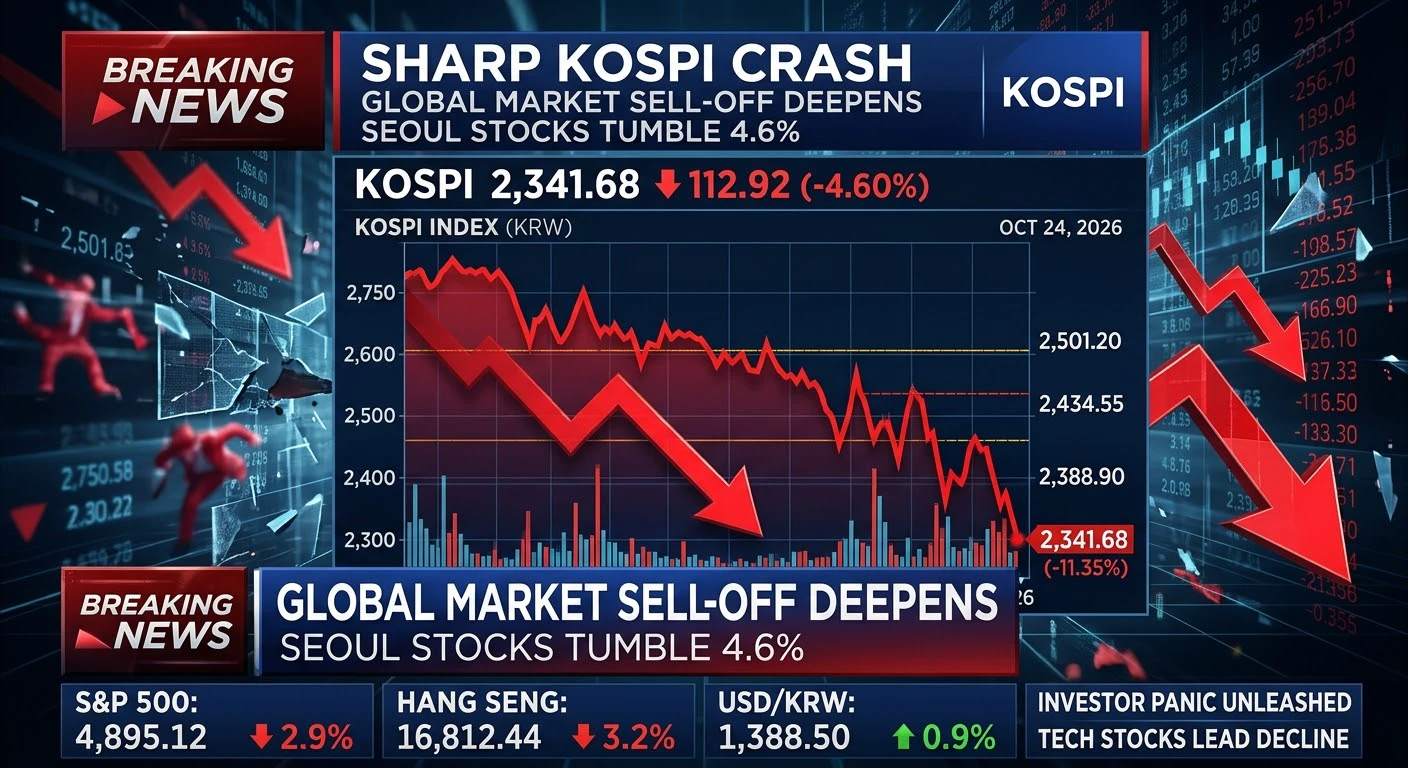
#KOSPIFallsNearly4%
South Korea’s Stock Market Faces a Sharp Correction
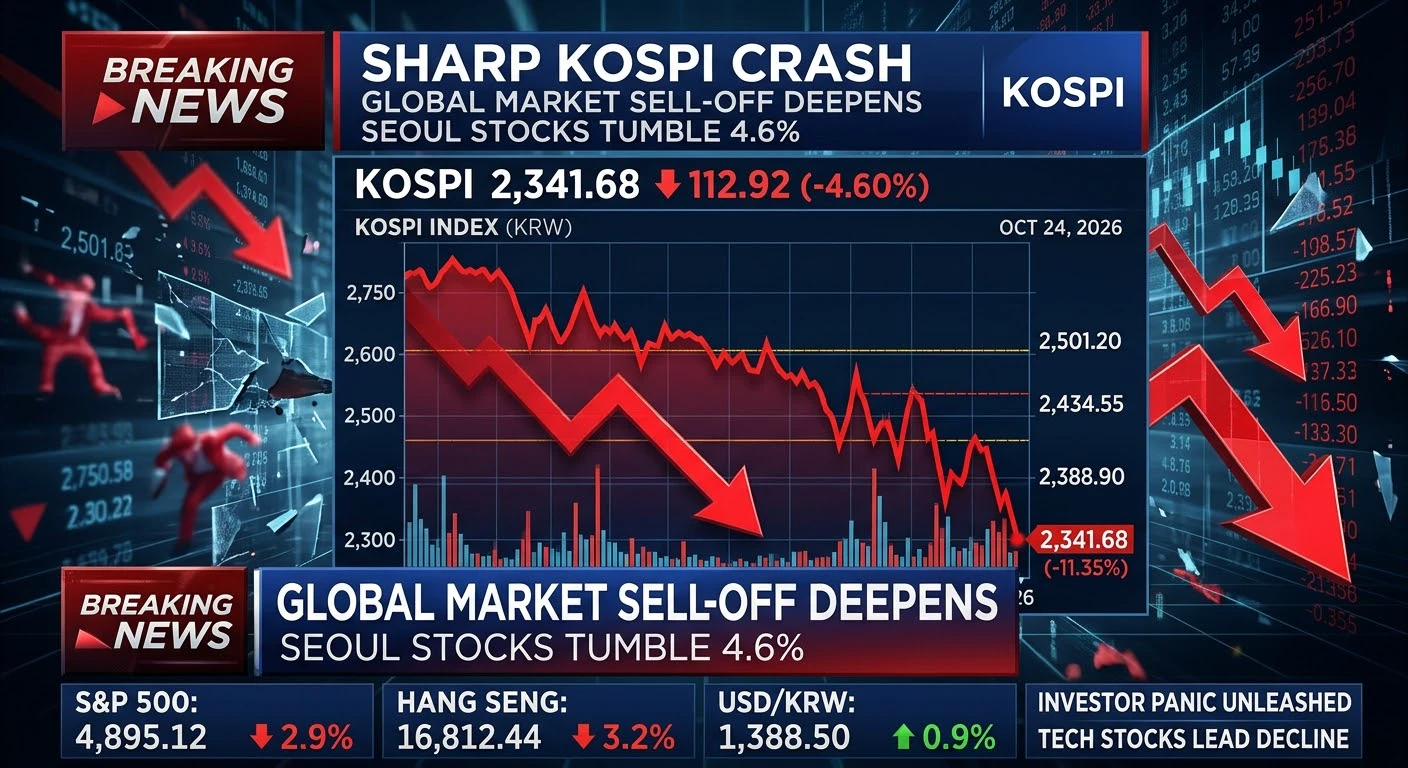
South Korea’s KOSPI index has come under significant selling pressure, falling nearly 4% and putting investors on alert. The decline highlights how quickly sentiment can shift in global equity markets when concerns about technology valuations, semiconductor demand, interest rates, and risk appetite begin to intensify.
Why Is the KOSPI Declining?
South Korea’s stock market is heavily influenced by major technology and semiconductor companies. When investors become cautious about the outlook for artificial intelligence, chip demand, or global technology spending, selling pressure can spread rapidly across the index.
A broad market decline can also reflect profit-taking after a strong rally, concerns about economic growth, and uncertainty surrounding global trade. Currency movements and foreign investor flows may further influence Korean equities.
The Semiconductor Connection
Semiconductors are central to South Korea’s economy and stock market. Companies exposed to memory chips, advanced computing, and AI infrastructure can significantly influence the KOSPI’s overall direction.
If investors begin questioning whether AI-related spending can sustain its current pace, technology stocks may experience valuation adjustments. Conversely, strong chip demand, improving earnings expectations, and resilient investment in AI infrastructure could help support a recovery.
What Does This Mean for Global Markets?
A sharp decline in the KOSPI matters beyond South Korea. Asian markets are connected to global supply chains, international capital flows, and investor sentiment toward technology stocks.
A significant sell-off may encourage investors to reduce exposure to riskier assets, potentially affecting other Asian indices and technology-heavy markets. However, one session of losses does not automatically signal a global market crash.
Investors should monitor whether the decline spreads to other major indices and whether selling pressure is accompanied by rising volatility and weakening market breadth.
What Happens Next?
The next move will depend on earnings expectations, semiconductor-sector performance, foreign investment flows, currency movements, and broader macroeconomic developments.
If the KOSPI stabilizes near important support levels and buying interest returns, a technical rebound could follow. However, continued selling and deteriorating market sentiment could extend the correction.
Traders should avoid assuming that a sharp decline guarantees an immediate recovery. Confirmation from price action, trading volume, and broader market conditions is essential.
My Market View
A nearly 4% decline is a strong reminder that even leading technology markets remain vulnerable to sudden changes in sentiment. For long-term investors, corrections can provide an opportunity to reassess valuations and business fundamentals. For short-term traders, volatility creates opportunities but also increases the risk of losses.
The key is to distinguish a temporary correction from a deeper deterioration in earnings expectations.
Note: The exact closing level, date-specific percentage change, and individual stock contributions should be verified against current market data before trading.
#KOSPIFallsNearly4% #KOSPI
South Korea’s Stock Market Faces a Sharp Correction
South Korea’s KOSPI index has come under significant selling pressure, falling nearly 4% and putting investors on alert. The decline highlights how quickly sentiment can shift in global equity markets when concerns about technology valuations, semiconductor demand, interest rates, and risk appetite begin to intensify.
Why Is the KOSPI Declining?
South Korea’s stock market is heavily influenced by major technology and semiconductor companies. When investors become cautious about the outlook for artificial intelligence, chip demand, or global technology spending, selling pressure can spread rapidly across the index.
A broad market decline can also reflect profit-taking after a strong rally, concerns about economic growth, and uncertainty surrounding global trade. Currency movements and foreign investor flows may further influence Korean equities.
The Semiconductor Connection
Semiconductors are central to South Korea’s economy and stock market. Companies exposed to memory chips, advanced computing, and AI infrastructure can significantly influence the KOSPI’s overall direction.
If investors begin questioning whether AI-related spending can sustain its current pace, technology stocks may experience valuation adjustments. Conversely, strong chip demand, improving earnings expectations, and resilient investment in AI infrastructure could help support a recovery.
What Does This Mean for Global Markets?
A sharp decline in the KOSPI matters beyond South Korea. Asian markets are connected to global supply chains, international capital flows, and investor sentiment toward technology stocks.
A significant sell-off may encourage investors to reduce exposure to riskier assets, potentially affecting other Asian indices and technology-heavy markets. However, one session of losses does not automatically signal a global market crash.
Investors should monitor whether the decline spreads to other major indices and whether selling pressure is accompanied by rising volatility and weakening market breadth.
What Happens Next?
The next move will depend on earnings expectations, semiconductor-sector performance, foreign investment flows, currency movements, and broader macroeconomic developments.
If the KOSPI stabilizes near important support levels and buying interest returns, a technical rebound could follow. However, continued selling and deteriorating market sentiment could extend the correction.
Traders should avoid assuming that a sharp decline guarantees an immediate recovery. Confirmation from price action, trading volume, and broader market conditions is essential.
My Market View
A nearly 4% decline is a strong reminder that even leading technology markets remain vulnerable to sudden changes in sentiment. For long-term investors, corrections can provide an opportunity to reassess valuations and business fundamentals. For short-term traders, volatility creates opportunities but also increases the risk of losses.
The key is to distinguish a temporary correction from a deeper deterioration in earnings expectations.
Note: The exact closing level, date-specific percentage change, and individual stock contributions should be verified against current market data before trading.
#KOSPIFallsNearly4% #KOSPI