Square
Following
Hot
News
Profile
Share your thoughts
placeholder
Article
After the halving, block rewards were cut by 20%, but ETC’s hashrate didn’t collapse? After ETC’s fifth halving, the block reward fell to 1.6384 coins. Miners should have left, but instead, the hashrate held steady within its range. The Olympia upgrade is scheduled for the 2027 mainnet, and for the first time, an inflation-free model is being written into the protocol. The CLARITY Act has also classified it as a digital commodity. If you want to see how long it’ll take to break even, click the tag and work it out using the candlestick timeframe yourself—that’s more reliable than taking my word
post-image
ETC-1.44%
ETH-1.16%
DOGE-0.98%
LTC+0.01%
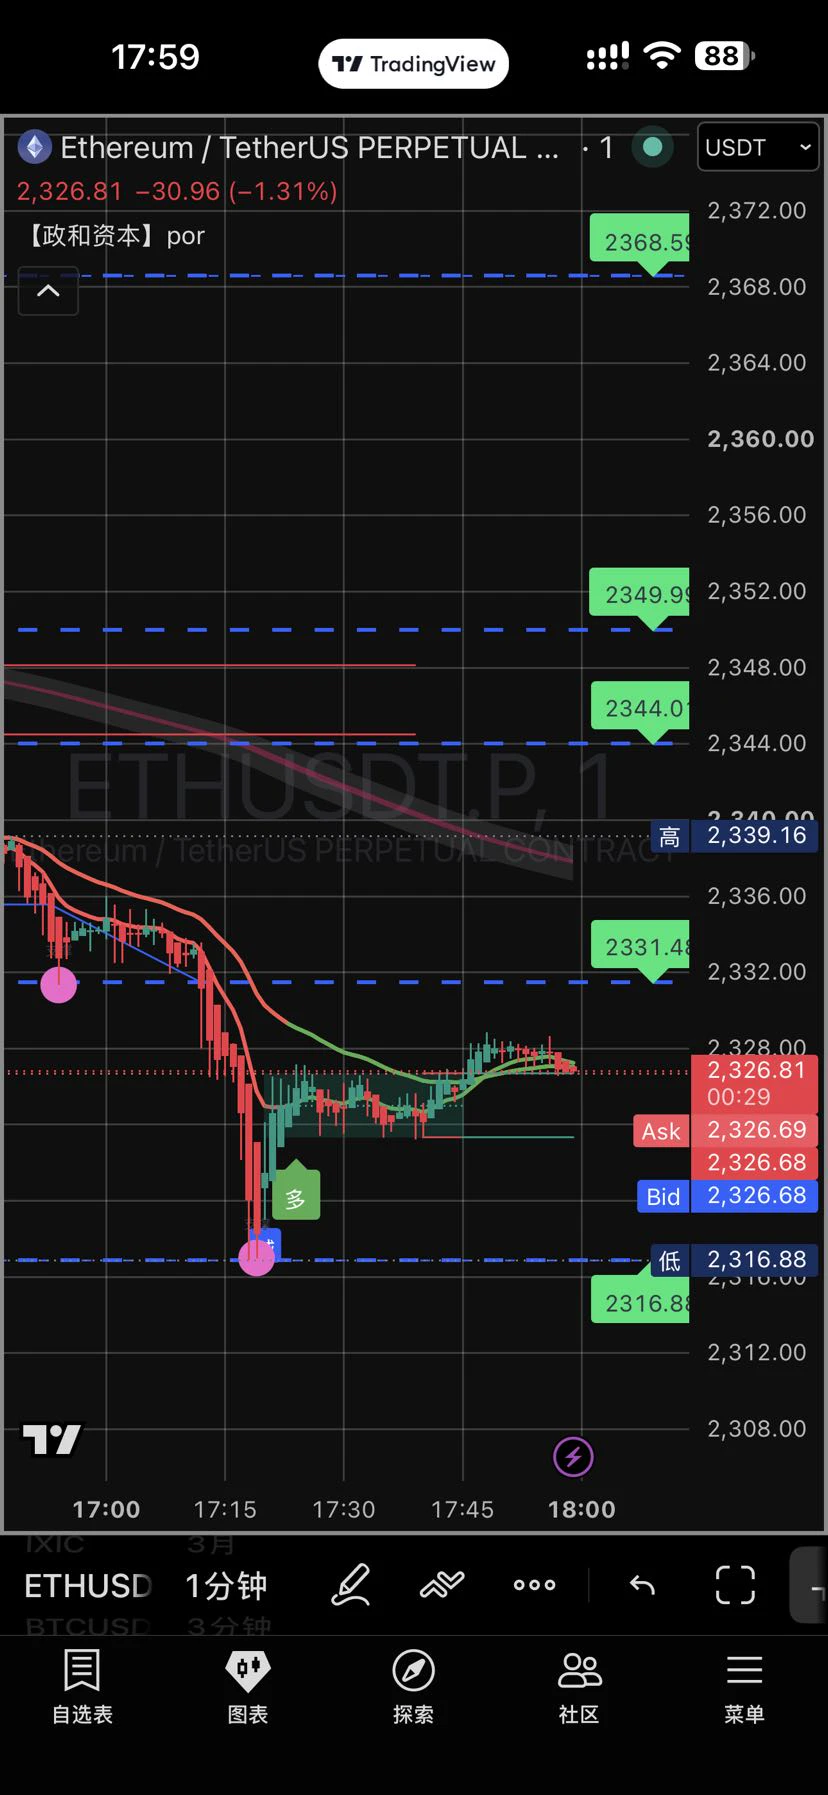
October 25, 2026 (Sunday) ETH Perpetual Futures Analysis and Strategy (as of around 18:07 HKT)
Current Market Overview
ETH is currently trading around $2,320–$2,360, down slightly by about 0.4–1.7% over 24 hours. On Saturday, it dipped to around $2,280–$2,290 before rebounding slightly. It is Sunday, traditional markets are closed, and liquidity in crypto markets is relatively thin, which may amplify volatility.
Price has fallen below the $2,400–$2,450 range seen in recent days and is trading below most short-term moving averages. ETH remains strongly correlated with BTC, and overall market se
post-image
ETH-1.19%
Trenches
ZIG
Z
bade
b
ZIG
0x8c...1145
Market Cap
$.
Change
.
24h Vol
$.
Holders
.
CNPY
C
bade
b
CNPY
0xc6...ddd2
Market Cap
$.
Change
.
24h Vol
$.
Holders
.
STONK
S
bade
b
STONK
6GmA...UNgx
Market Cap
$.
Change
.
24h Vol
$.
Holders
.
BTC
B
bade
b
BTC
C5xp...pump
Market Cap
$.
Change
.
24h Vol
$.
Holders
.
LIGHT
L
bade
b
LIGHT
0x47...3c0e
Market Cap
$.
Change
.
24h Vol
$.
Holders
.
$TRIA The coin is going down
Sell 0.002565 0.002580; targets 0.002535 0.002510 0.002485; stop loss 0.002610
post-image
TRIA+0.43%
#美股财报季 #Gate广场万圣节 Super Earnings Week Is Here: Tech Giants Report, Memory Chip Shortages Expected Through 2028
Next week, global tech stocks face a pivotal moment.
On one side, Microsoft, Google, Amazon, and Intel report earnings; on the other, Samsung and SK hynix lay all their cards on the table for the memory supercycle.
While the market is still asking, “Is AI a bubble?”, the industry has already sold out capacity through 2028.
I. Next Week’s Earnings Calendar: Four Tough Tests
• After the market closes on October 28 (Wednesday): Alphabet (Google), Microsoft
—— For Microsoft, the focus is
  • 2
By the riverside, you can feel the cool breeze
while listening to music.
A song like “Boundless Oceans, Vast Skies”
brings back memories of Wong Ka Kui in the ’90s.
A talent taken too soon!
🌼🌼🌼
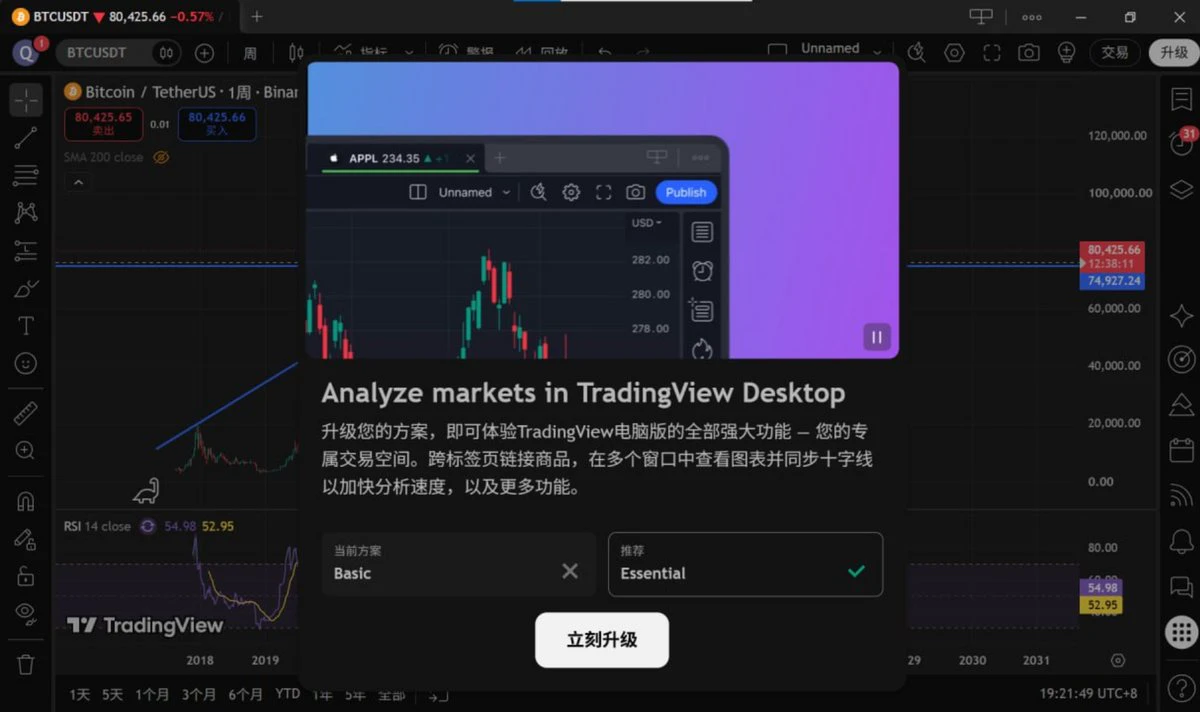
TradingView, what a shameless money grab! HK$100 a month? Are you kidding? The worst part is that you can't even close the pop-up. It's just like malware. I might consider it if it were cheaper.
This kind of forced, extortionate payment scheme just makes people want to uninstall it!
Have you run into this kind of payment pop-up while using this software? How do you close it?
#TradingView
post-image
#GateWCTCS9GlobalTradingCompetition $BTC ‌#WCTCS9 BTC at $80,396: A 30-Minute Battle Between Momentum, Patience and Market Noise
Bitcoin is hovering around $80,396, and this is exactly the kind of market where a confident prediction can go wrong in minutes. Price is sitting near an important support area, short-term momentum remains weak, and the next reaction could determine whether buyers regain control or sellers push BTC toward lower levels.
For anyone competing in Gate WCTC S9, I think the real challenge is not predicting every candle. It is recognizing when the market confirms a setup a
post-image
BTC-0.11%
$XRP is sitting right at the knife-edge $1.291 with price crushed under both EMAs and a clear bearish structure.
Price just rejected the $1.292 resistance zone and is coiling under the EMA20/50 cluster (1.297 / 1.300). RSI is neutral at 51.7, MACD histogram is still negative, and both 4H + Daily bias are firmly bearish. This is a classic “wait for the retest” environment — no FOMO needed.
K-Line (Candlestick) Structure.
Looking at the 1H chart:
Strong sell-off from the $1.33–1.35 high earlier, followed by a lower high and aggressive red candles into the $1.25 area.
Price then bounced and is
XRP+1.46%
Disconnected, starting over...
live-cover
LIVE1,386
Today's most abnormal market detail is this: the Fear & Greed Index is stuck at a neutral 54, and the broader market lacks direction, yet MUB rose +0.45% against the trend on thin 24h trading volume of just 5.7M USDT. MA5 (886.346) remains above MA20 (885.648), and the price is holding firmly at the Bollinger midline—this is typical low-volume resilience, not a follow-the-herd rebound. Neutral sentiment means neither bulls nor bears have an overwhelming advantage, and sector rotation is leaning toward assets with independent narratives; MUB's narrow-range resilience is a sign of funds buying t
MUB
MUBMubbin
Pump.Fun
MC:$3.42KHolders:1
0%
TAO-0.26%
New User Kickoff: Sign Up for Rewards, Trade to Win Up to 2,000 APT https://www.gate.com/campaigns/6673?ref=VLARBF1YAG&ref_type=132&utm_cmp=RvvtcmwR
post-image
APT-3.39%
Seeing a few smart people talk about $XMR atm and it's certainly one I've watched for a while. For me, I think I'd want exposure to both $ZEC and $XMR.
Looking for this low time frame breakout against ZEC, XMR hasn't pumped against ZEC since 2021 era, maybe we will see a shift.
XMR+0.00%
ZEC+4.73%
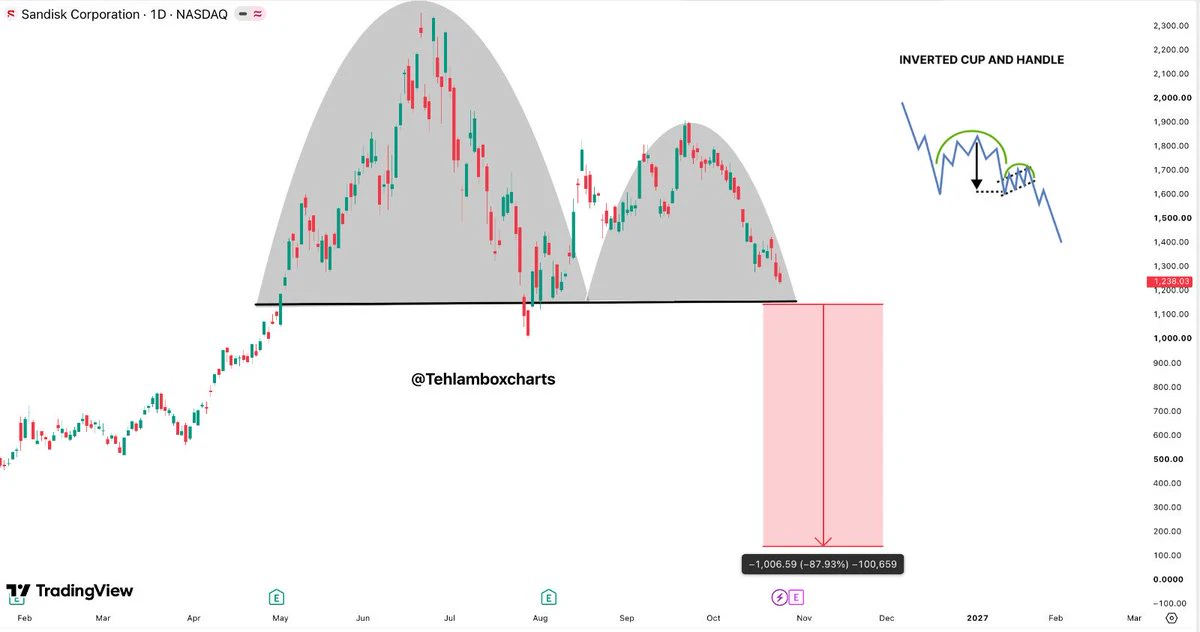
Take from Admin 2: Not saying $SNDK is going to crash, but this chart is definitely not looking pretty rn
potential inverted cup and handle, with $1,150 as a support zone
if that breaks, bulls might be in for a reality check
post-image
SNDK-1.90%
MARKET UPDATE
live-cover
LIVE1,533
#DataCentersMayFaceOversupplyBy2028

Data Centers May Face Oversupply by 2028 as AI Infrastructure Enters a Critical Turning Point
The rapid expansion of artificial intelligence is transforming data centers into one of the most important infrastructure investments in the global technology economy. Companies are spending billions of dollars to build facilities capable of supporting advanced AI models, cloud computing, enterprise software, and high performance workloads. However, growing concerns about a potential oversupply by 2028 are raising important questions about the sustainability of t
post-image
AVGO+0.03%
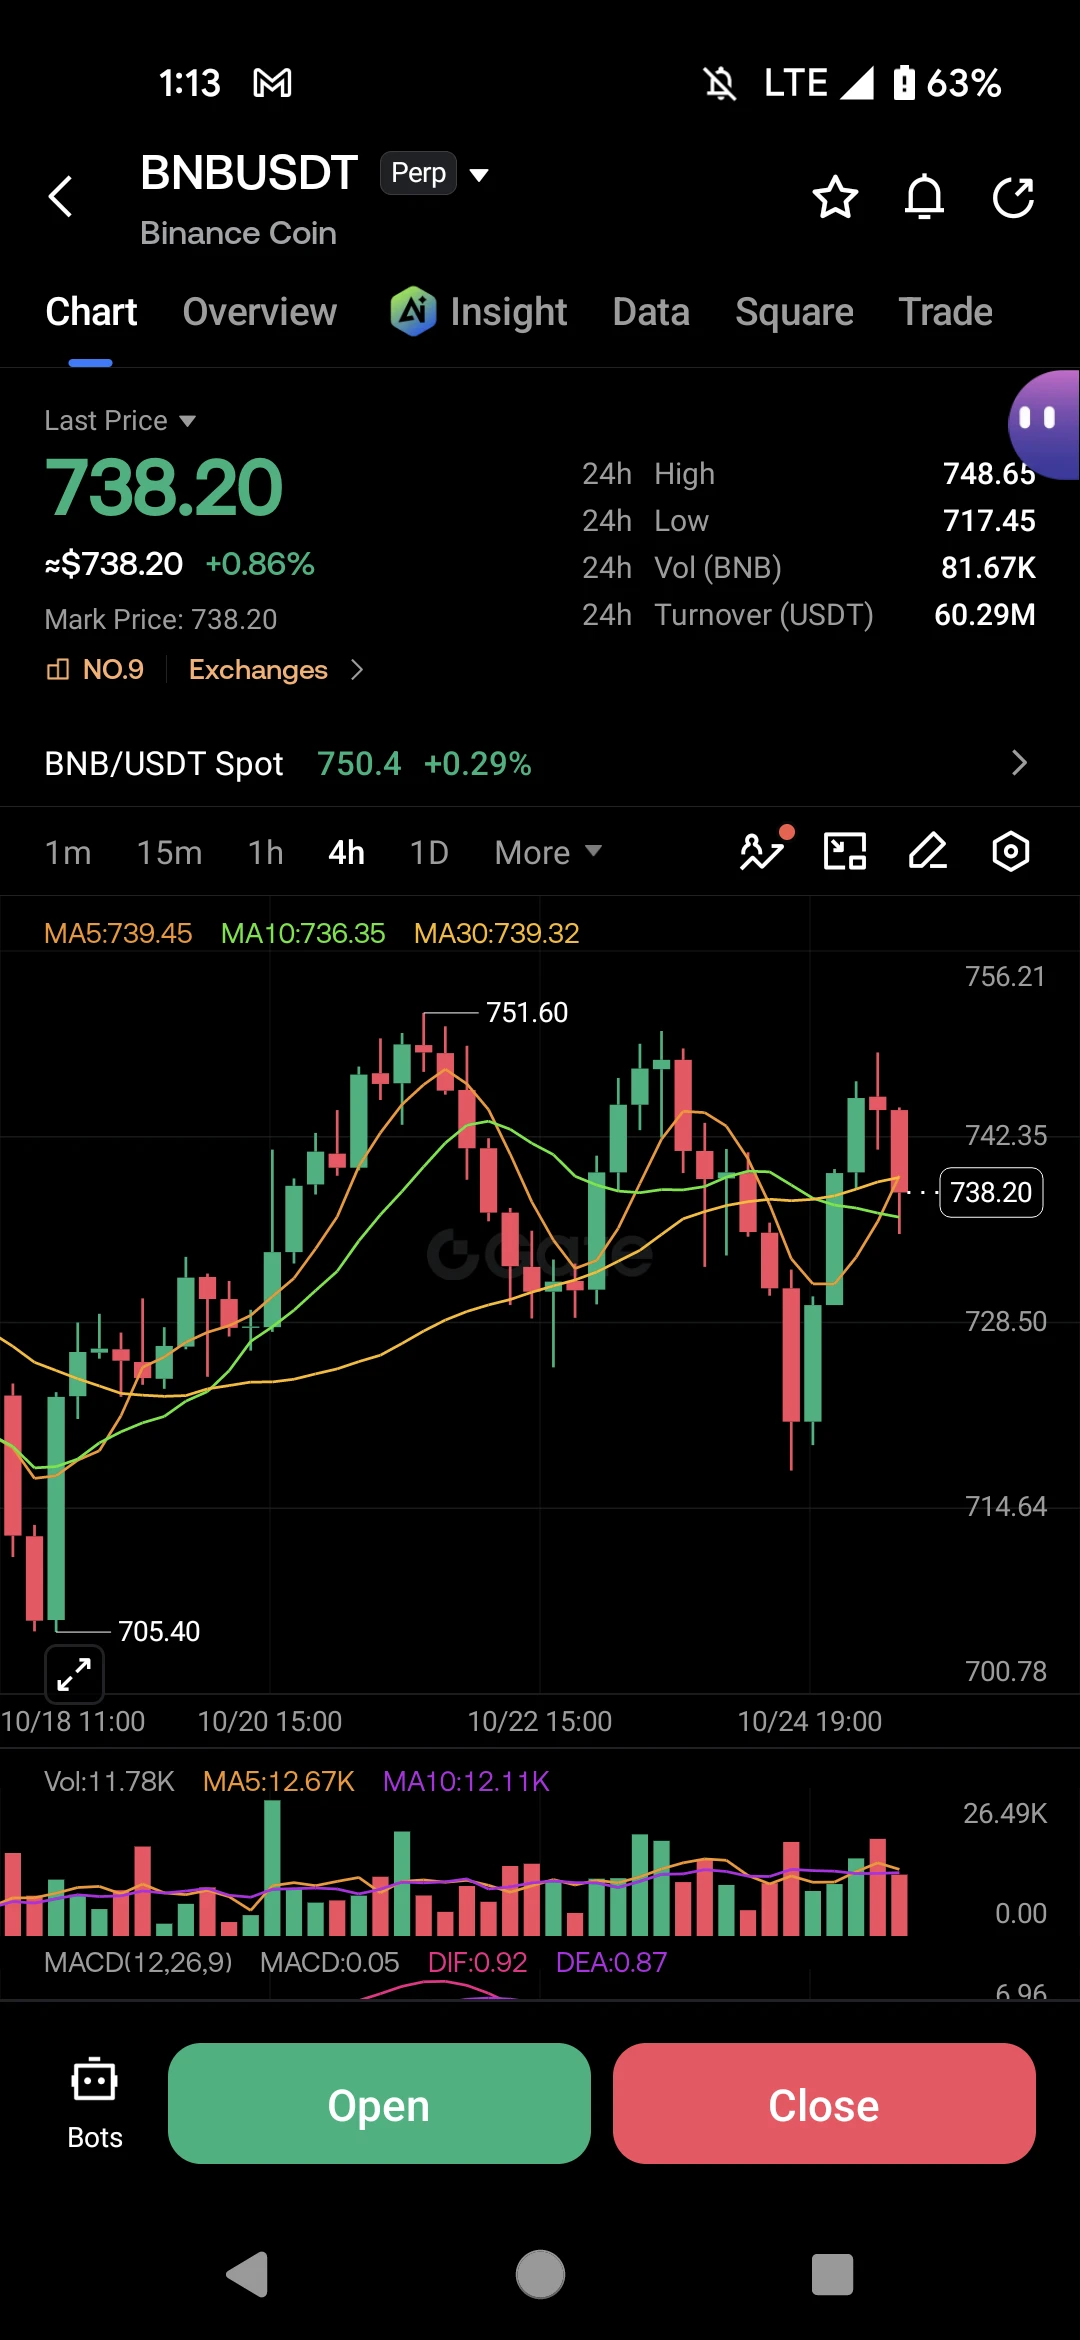
$BNB ‌ is trapped in a tight consolidation near its moving averages, and the fading momentum suggests the next move is likely down.
Trading Plan Short BNB
Entry: 738.00 - 742.00
SL: 755.00
TP1: 728.50
TP2: 717.45
TP3: 705.00
BNB is up 0.86% today at $738.20, but it's struggling to hold above the key moving averages. The price is currently squeezed right between MA5 at $739.45, MA10 at $736.35, and MA30 at $739.32. This tight cluster indicates a lack of clear direction, but the recent price action is printing lower highs from the $751.60 peak.
The MACD is giving a subtle warning. While the his
post-image
BNB+1.65%
1: For those who haven’t joined the team, the competition starts tomorrow. Before it begins, a copy-trading account will be opened, trading gold only. Only teammates can follow, with a starting balance of $200 and a fixed position size of 0.1 lot. The copy-trading account will be announced then, so stay tuned. As for the signal code, we’ll see whether there’s any volatility tonight; if there is, it’ll be updated.
2: Team lottery entry link: https://www.gate.com/zh/competition/wctc-s9?page=teamCompetition&teamId=65493&ref_type=165&utm_cmp=tgv0wayw&ref=Tingfeng

🌹🌹🌹��🌹🌹🌹��
✍️The
post-image
GLDX-1.41%
PAXG-0.04%
GT-0.50%
  • 3
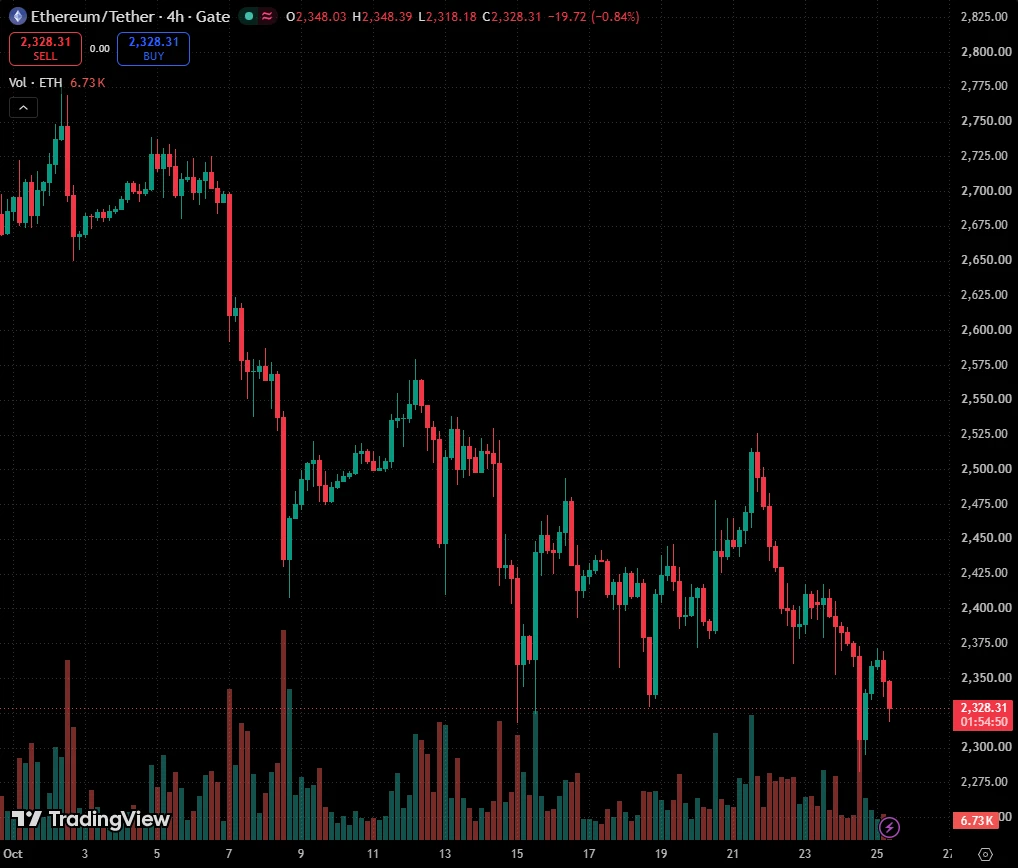
$ETH ETHEREUM (ETH/USD): Very Bearish Outlook
I see two strong bearish signals on Ethereum on an intraday timeframe.
The price violated two significant structures: a vertical falling resistance trend line and the neckline of an inverted head and shoulders pattern.
It is highly probable that the market will continue to decline to at least 2260.
post-image
ETH-1.19%
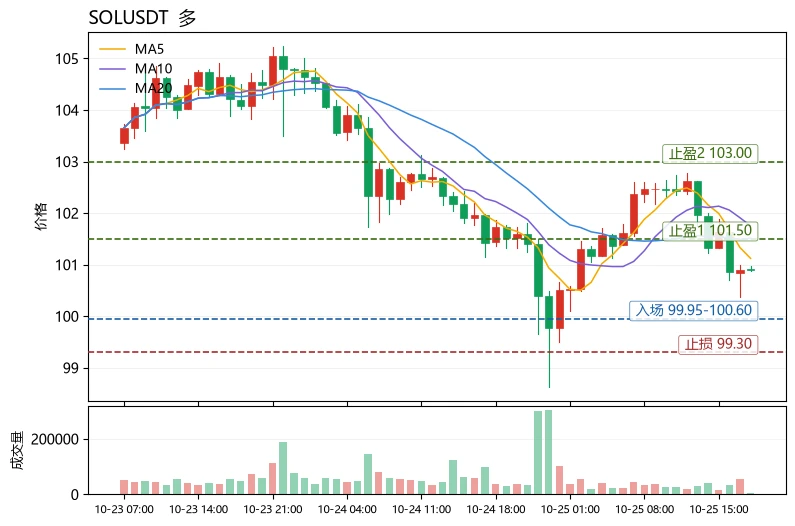
Why has SOL fallen the least in its sector, yet is the most worth watching?
The answer lies in relative strength. $SOL is currently at 100.9, down just -0.50% over 24h. Over the same period, $SUI fell 3.28%, with its RSI already at 32.1, while SOL’s RSI is 39.4. The narrower decline and trading volume of 142.1M USDT—significantly higher than SUI’s 36.1M—suggest selling pressure is being absorbed by deeper liquidity. Structurally, SOL’s MA5=101.122 remains below MA20=101.512, and the MACD histogram at -0.06204 remains bearish, but the price is trading near the lower Bollinger Band at 99.9523.
post-image
SOL-0.21%
SUI-3.23%
XRP+1.46%
The $BTC $ETH long position was closed overnight.
I followed up by adding a little, then did some T trading in the morning, and finally exited in the afternoon.
Banked +7923U.
I watched the market this afternoon and feel like it should move up tonight.
Profits from yesterday through today have actually been pretty good, so I’ll take a shot when the time comes.
I’ve put on a small core position now, okay?
Let’s see if it can move up from here.
#Spot gold falls below $4000‍
post-image
BTC-0.11%
ETH-1.19%
  • 1
Load More

Join 40 M users in our growing community

⚡️ Join 40 M users in the crypto craze discussion

💬 Engage with your favorite top creators

👍 See what interests you

Trending Topics

USEarningsSeason

89.79k Views3.45k Discussing

The U.S. Q3 earnings season is in full swing, with major tech companies including Tesla and Meta reporting results. Market focus is shifting beyond revenue and profit toward AI spending, capital expenditure, margins and forward guidance. Which company’s earnings are you watching most closely?

GateWCTCS9GlobalTradingCompetition

690.21k Views8.02k Discussing

USConsumerSentimentNearRecordLow

9.7k Views270 Discussing

View More