


#布局本周交易 #每周来晒 BTC “Lays Flat” at 82,000 Over the Weekend, but Signals of a Shift Next Week Have Already Appeared
U.S. Treasury yields at 5.2% are weighing on the market, government selling pressure is hanging over it, but the 50-day moving average is holding. Next week’s PPI and FOMC minutes will determine the direction.
1. First, the market: BTC is “stuck” around 82,000
The weekend action was uneventful, with BTC moving narrowly between $82,000-$83,000, and 24-hour volatility below 1%.
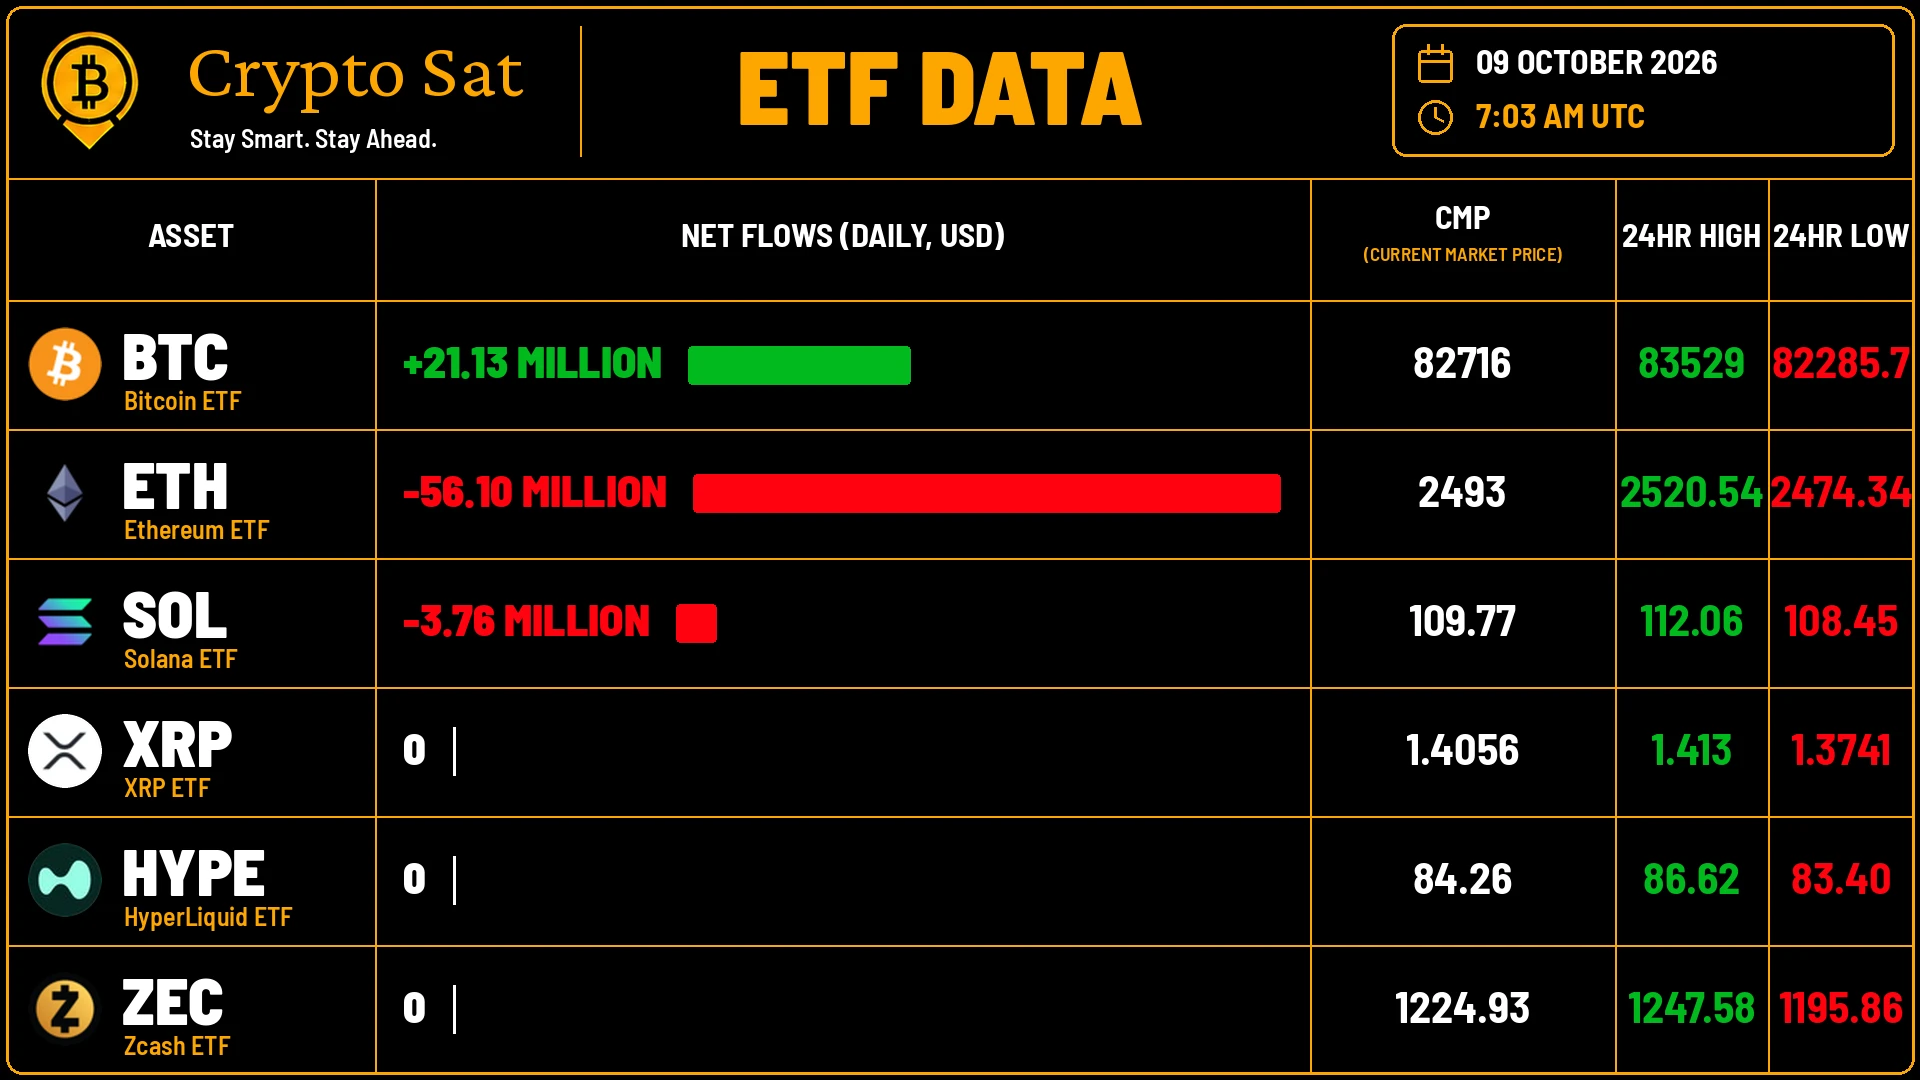
As of press time, Bitcoin was trading at around $82,984, while Ethereum was around $2,490.
But one detail is worth noting: BTC held the 50-day moving average.
On Thursday, BTC briefly fell to $80,400, touching the 50-day moving average before being pulled back by buying. This moving average has served as the “mid-term trend dividing line” since July—the medium-term structure remains intact while the price is above it; only a break below it would require a reassessment.
Short-term holders are “capitulating,” but this may be nearing its end.
CryptoQuant data shows that short-term holders transferred 55,600 BTC to exchanges on Thursday, mostly at a loss. This was the largest single-day loss transfer volume since June 26. But BTC was still at $59,300 then, compared with 82,000 now. The transfer volume is huge, but the price is far higher than in June—suggesting that the weakest holders may be getting flushed out, rather than a new wave of panic beginning.
2. What happened this week? Three “selling forces”
Force one: The U.S. government continues depositing BTC into exchanges
This was the most direct catalyst for the current decline.
Over the past three days, the U.S. government deposited 17,733 BTC (approximately $1.48 billion) and 750 WBTC (approximately $62 million) into CoinbPrime, during which BTC’s price fell 6.9%.
But there is a key detail: depositing into CoinbPrime does not mean an immediate sale. Coinb Prime serves both custody and trading functions. These BTC may have come from the return process in the Bitf hacker case, or they may be assets awaiting disposal. What the market is really worried about is not that “they have already been sold,” but that they “could be sold at any time”—this “supply shadow hanging overhead” is most likely to amplify panic when longs are crowded.
Force two: MARA transferred 996 BTC to Galaxy Digital
MARA Holdings, a mining company, transferred 996 BTC (approximately $81.13 million) to Galaxy Digital, prompting the market to focus on whether this involved a reduction in holdings. MARA’s BTC holdings have fallen from 53,822 in February to 35,577 in August. The company is transitioning toward AI computing, and selling BTC may be providing funding for deleveraging and its new business.
Force three: ETF flows turned negative
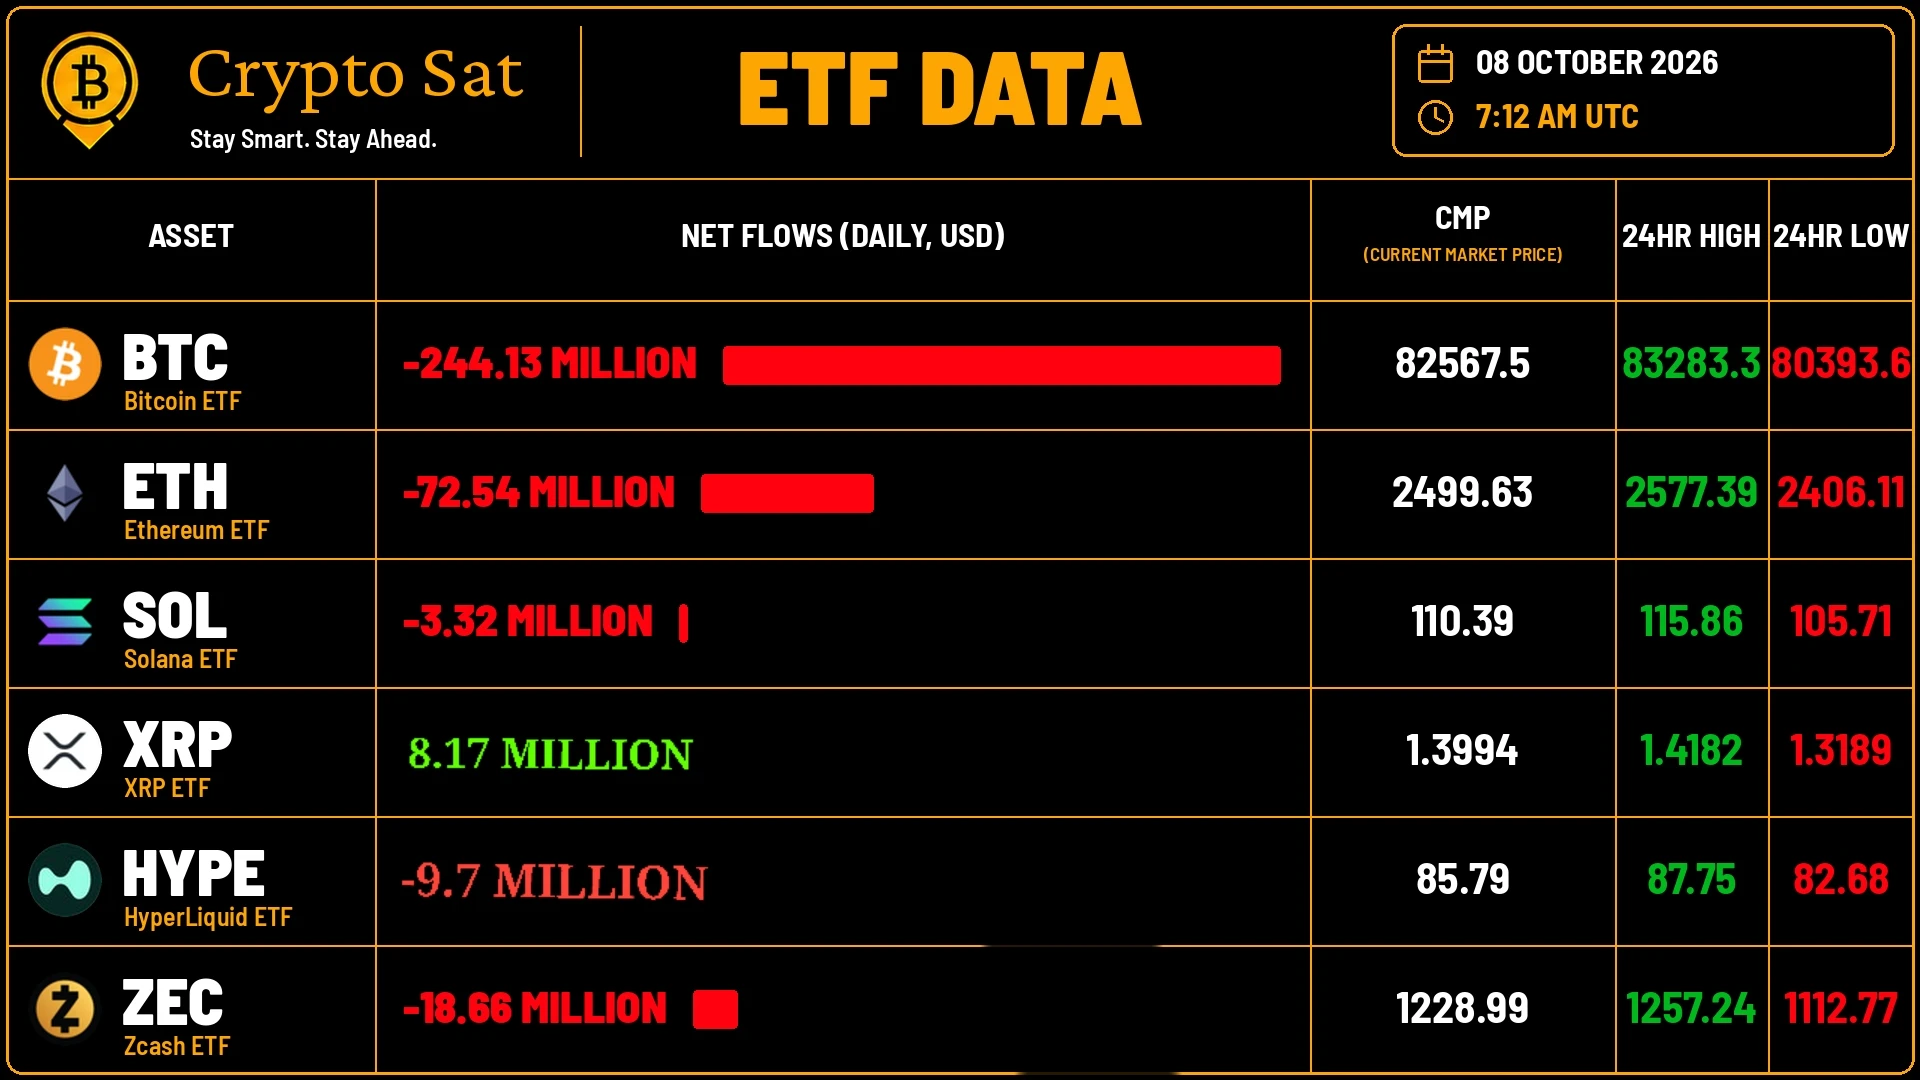
On October 7, U.S. spot Bitcoin ETFs recorded net outflows of $484.9 million, the largest single-day outflow in nearly 3.5 months. Ethereum ETFs were even worse—recording net outflows of $641.3 million over eight consecutive trading days, exceeding the outflows from Bitcoin funds.
ETH’s situation is worse than BTC’s. The ETH/BTC exchange rate fell to its lowest level since mid-August, ETFs are bleeding, and Bitmine also announced that it was nearing its purchase limit and would soon stop buying. Ethereum’s “buyers” are retreating.
3. Macro: Odds of a rate hike in October fall below 20%
The aftershocks of the nonfarm payrolls report are still unfolding.
September nonfarm payrolls increased by just 29,000, far below expectations. Fed Vice Chairs Jefferson and Bowman both signaled that “more time is needed before the next step.” CME data shows that the probability of an October rate hike has fallen below 20%.
This is a short-term positive for the crypto market. No rate hike in October means short-term pressure will ease. But Huatai Securities’ view is that the Fed will find it difficult to raise rates consecutively in October, with another rate hike in December under the baseline scenario.
But the real “invisible pressure” is Treasury yields. The 10-year U.S. Treasury yield remains around 5.2%, serving as an “invisible ceiling” for risk assets. Bond giant PIMCO warned that the 10-year yield could rise to 6%—if that actually happens, risk-asset valuations will face another round of pressure.
4. Key events next week
October 14 (Tuesday) U.S. September PPI data
The “outpost” for inflationary pressure
October 15 (Wednesday) Federal Reserve FOMC meeting minutes
Look for the true internal differences over the “rate-hike path”
U.S. government BTC transfer activity
If large deposits into exchanges continue, short-term pressure may persist
ETH ETF flows
If outflows continue, ETH may continue underperforming BTC
Trading approach
1. Do not chase gains or panic around 82,000: Weekend liquidity is poor, and the direction should await next week’s data
2. Watch the $80,400-$81,000 support: This is the 50-day moving average zone; holding it would keep the medium-term structure intact
3. ETH is weak in the short term: The ETH/BTC exchange rate has hit a new low and ETFs are seeing outflows, so adding to ETH positions is not recommended in the short term
4. Control position sizes ahead of next week’s PPI and FOMC minutes: The data may trigger volatility, so do not make large directional bets before the releases
5. Continue monitoring the government’s BTC transfer activity: If large deposits continue, short-term pressure may persist
BTC is “lying flat” at 82,000, but the 50-day moving average is holding. Government selling pressure is hanging over the market, ETH buyers are retreating, and the probability of an October rate hike has fallen below 20%—both bulls and bears have valid arguments, but the direction has yet to emerge. Next week’s PPI and FOMC minutes will be the real “moment of truth.”
U.S. Treasury yields at 5.2% are weighing on the market, government selling pressure is hanging over it, but the 50-day moving average is holding. Next week’s PPI and FOMC minutes will determine the direction.
1. First, the market: BTC is “stuck” around 82,000
The weekend action was uneventful, with BTC moving narrowly between $82,000-$83,000, and 24-hour volatility below 1%.
As of press time, Bitcoin was trading at around $82,984, while Ethereum was around $2,490.
But one detail is worth noting: BTC held the 50-day moving average.
On Thursday, BTC briefly fell to $80,400, touching the 50-day moving average before being pulled back by buying. This moving average has served as the “mid-term trend dividing line” since July—the medium-term structure remains intact while the price is above it; only a break below it would require a reassessment.
Short-term holders are “capitulating,” but this may be nearing its end.
CryptoQuant data shows that short-term holders transferred 55,600 BTC to exchanges on Thursday, mostly at a loss. This was the largest single-day loss transfer volume since June 26. But BTC was still at $59,300 then, compared with 82,000 now. The transfer volume is huge, but the price is far higher than in June—suggesting that the weakest holders may be getting flushed out, rather than a new wave of panic beginning.
2. What happened this week? Three “selling forces”
Force one: The U.S. government continues depositing BTC into exchanges
This was the most direct catalyst for the current decline.
Over the past three days, the U.S. government deposited 17,733 BTC (approximately $1.48 billion) and 750 WBTC (approximately $62 million) into CoinbPrime, during which BTC’s price fell 6.9%.
But there is a key detail: depositing into CoinbPrime does not mean an immediate sale. Coinb Prime serves both custody and trading functions. These BTC may have come from the return process in the Bitf hacker case, or they may be assets awaiting disposal. What the market is really worried about is not that “they have already been sold,” but that they “could be sold at any time”—this “supply shadow hanging overhead” is most likely to amplify panic when longs are crowded.
Force two: MARA transferred 996 BTC to Galaxy Digital
MARA Holdings, a mining company, transferred 996 BTC (approximately $81.13 million) to Galaxy Digital, prompting the market to focus on whether this involved a reduction in holdings. MARA’s BTC holdings have fallen from 53,822 in February to 35,577 in August. The company is transitioning toward AI computing, and selling BTC may be providing funding for deleveraging and its new business.
Force three: ETF flows turned negative
On October 7, U.S. spot Bitcoin ETFs recorded net outflows of $484.9 million, the largest single-day outflow in nearly 3.5 months. Ethereum ETFs were even worse—recording net outflows of $641.3 million over eight consecutive trading days, exceeding the outflows from Bitcoin funds.
ETH’s situation is worse than BTC’s. The ETH/BTC exchange rate fell to its lowest level since mid-August, ETFs are bleeding, and Bitmine also announced that it was nearing its purchase limit and would soon stop buying. Ethereum’s “buyers” are retreating.
3. Macro: Odds of a rate hike in October fall below 20%
The aftershocks of the nonfarm payrolls report are still unfolding.
September nonfarm payrolls increased by just 29,000, far below expectations. Fed Vice Chairs Jefferson and Bowman both signaled that “more time is needed before the next step.” CME data shows that the probability of an October rate hike has fallen below 20%.
This is a short-term positive for the crypto market. No rate hike in October means short-term pressure will ease. But Huatai Securities’ view is that the Fed will find it difficult to raise rates consecutively in October, with another rate hike in December under the baseline scenario.
But the real “invisible pressure” is Treasury yields. The 10-year U.S. Treasury yield remains around 5.2%, serving as an “invisible ceiling” for risk assets. Bond giant PIMCO warned that the 10-year yield could rise to 6%—if that actually happens, risk-asset valuations will face another round of pressure.
4. Key events next week
October 14 (Tuesday) U.S. September PPI data
The “outpost” for inflationary pressure
October 15 (Wednesday) Federal Reserve FOMC meeting minutes
Look for the true internal differences over the “rate-hike path”
U.S. government BTC transfer activity
If large deposits into exchanges continue, short-term pressure may persist
ETH ETF flows
If outflows continue, ETH may continue underperforming BTC
Trading approach
1. Do not chase gains or panic around 82,000: Weekend liquidity is poor, and the direction should await next week’s data
2. Watch the $80,400-$81,000 support: This is the 50-day moving average zone; holding it would keep the medium-term structure intact
3. ETH is weak in the short term: The ETH/BTC exchange rate has hit a new low and ETFs are seeing outflows, so adding to ETH positions is not recommended in the short term
4. Control position sizes ahead of next week’s PPI and FOMC minutes: The data may trigger volatility, so do not make large directional bets before the releases
5. Continue monitoring the government’s BTC transfer activity: If large deposits continue, short-term pressure may persist
BTC is “lying flat” at 82,000, but the 50-day moving average is holding. Government selling pressure is hanging over the market, ETH buyers are retreating, and the probability of an October rate hike has fallen below 20%—both bulls and bears have valid arguments, but the direction has yet to emerge. Next week’s PPI and FOMC minutes will be the real “moment of truth.”