
Square
Following
Hot
News
Profile
Share your thoughts
placeholder
Article
BTC
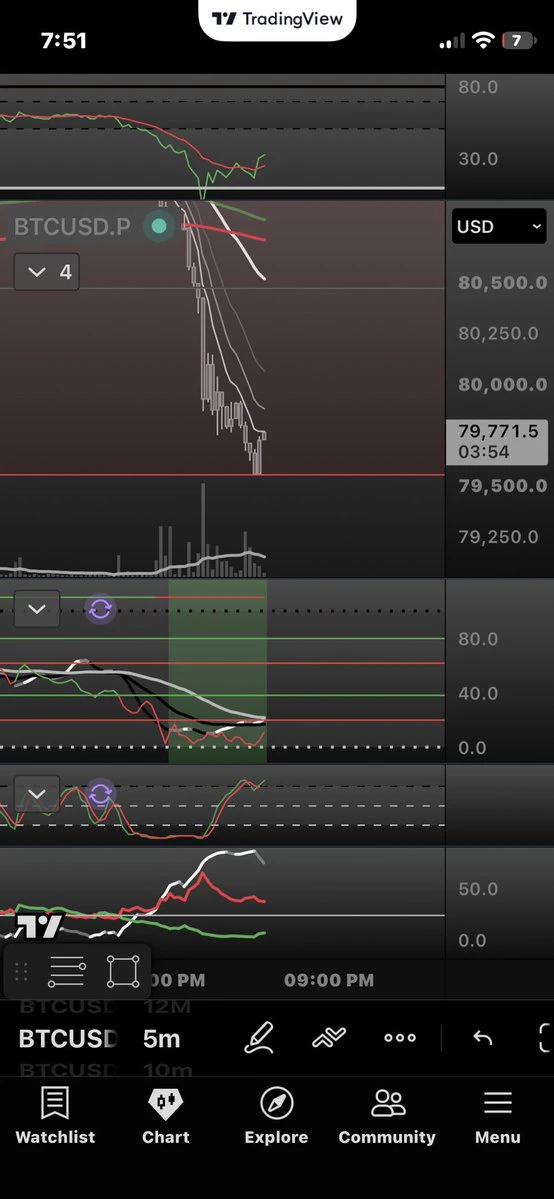
Dropped right to the wire
But does it hold..
Definitely going to see a relief pump here
Watching closely 👀
post-image
BTC-0.67%
The market is like a roller coaster right now#BTC争夺8万美元关口
post-image
BTC-0.67%
Trenches
TTWO
T
bade
b
TTWO
TTWo...FbKo
Market Cap
$.
Change
.
24h Vol
$.
Holders
.
BNCB
B
bade
b
BNCB
0x49...ec3f
Market Cap
$.
Change
.
24h Vol
$.
Holders
.
STONK
S
bade
b
STONK
6GmA...UNgx
Market Cap
$.
Change
.
24h Vol
$.
Holders
.
ZIG
Z
bade
b
ZIG
0x8c...1145
Market Cap
$.
Change
.
24h Vol
$.
Holders
.
Q
Q
bade
b
Q
0xc0...0589
Market Cap
$.
Change
.
24h Vol
$.
Holders
.
The Fed decision appears to hold steady on the surface, but is extremely hawkish in reality.
Interest rates remain unchanged, but the underlying policy logic has shifted.
Forward guidance has been cut; the Fed is no longer reassuring markets and is beginning a form of invisible tightening.
Rather than raising rates, it is tightening liquidity by unsettling expectations.
The dollar and U.S. Treasuries are relatively strong, while volatility across major asset classes is increasing.
Be wary of black swan events in the market ahead.
As for trading, selling into rallies offers a better risk-reward
post-image
10.29 ETH Market Analysis
Short: 2320–2345 area; risk level: 2365; targets: 2290/2270.
ETH is currently at 2297. The market has plunged sharply in succession from above 2390, hitting a low of 2296. Based on the chart pattern, this drop has been extremely rapid, and the price is far below the moving averages above. Short-term momentum has been overextended, creating the potential for a technical rebound at any time.
At this point in the sharp drop, chasing shorts at the current price could easily get shaken out by a rebound. The 2320–2345 area above is the key zone where short-term moving avera
post-image
ETH-1.23%
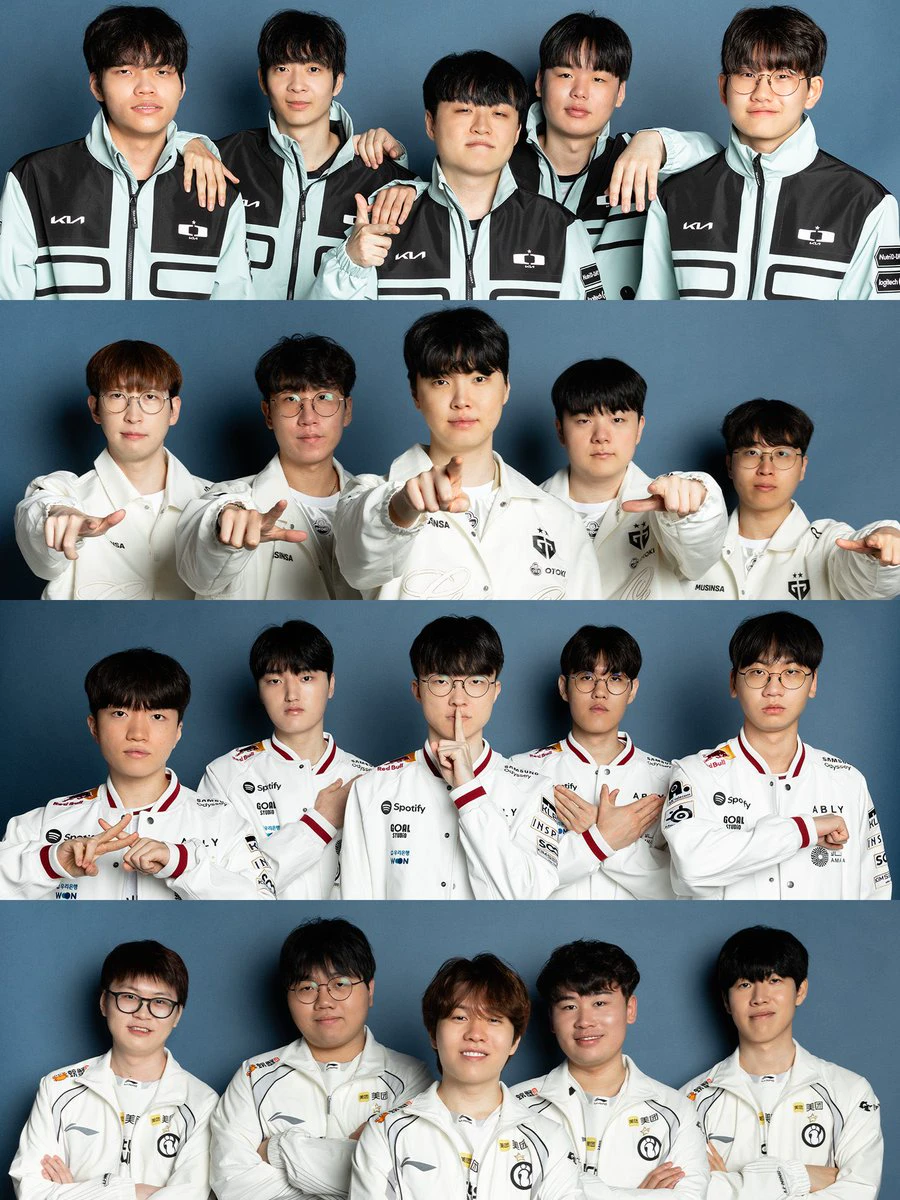
There are so many storylines at this year's LoL Worlds
If BLG, TES, HLE, and LYON make it through again
This year's champion will have more than earned the title
80% of the entire top eight are Korean
There are over a dozen former world champions
It's the twilight of the gods
The final battle for many
@Polymarket
post-image
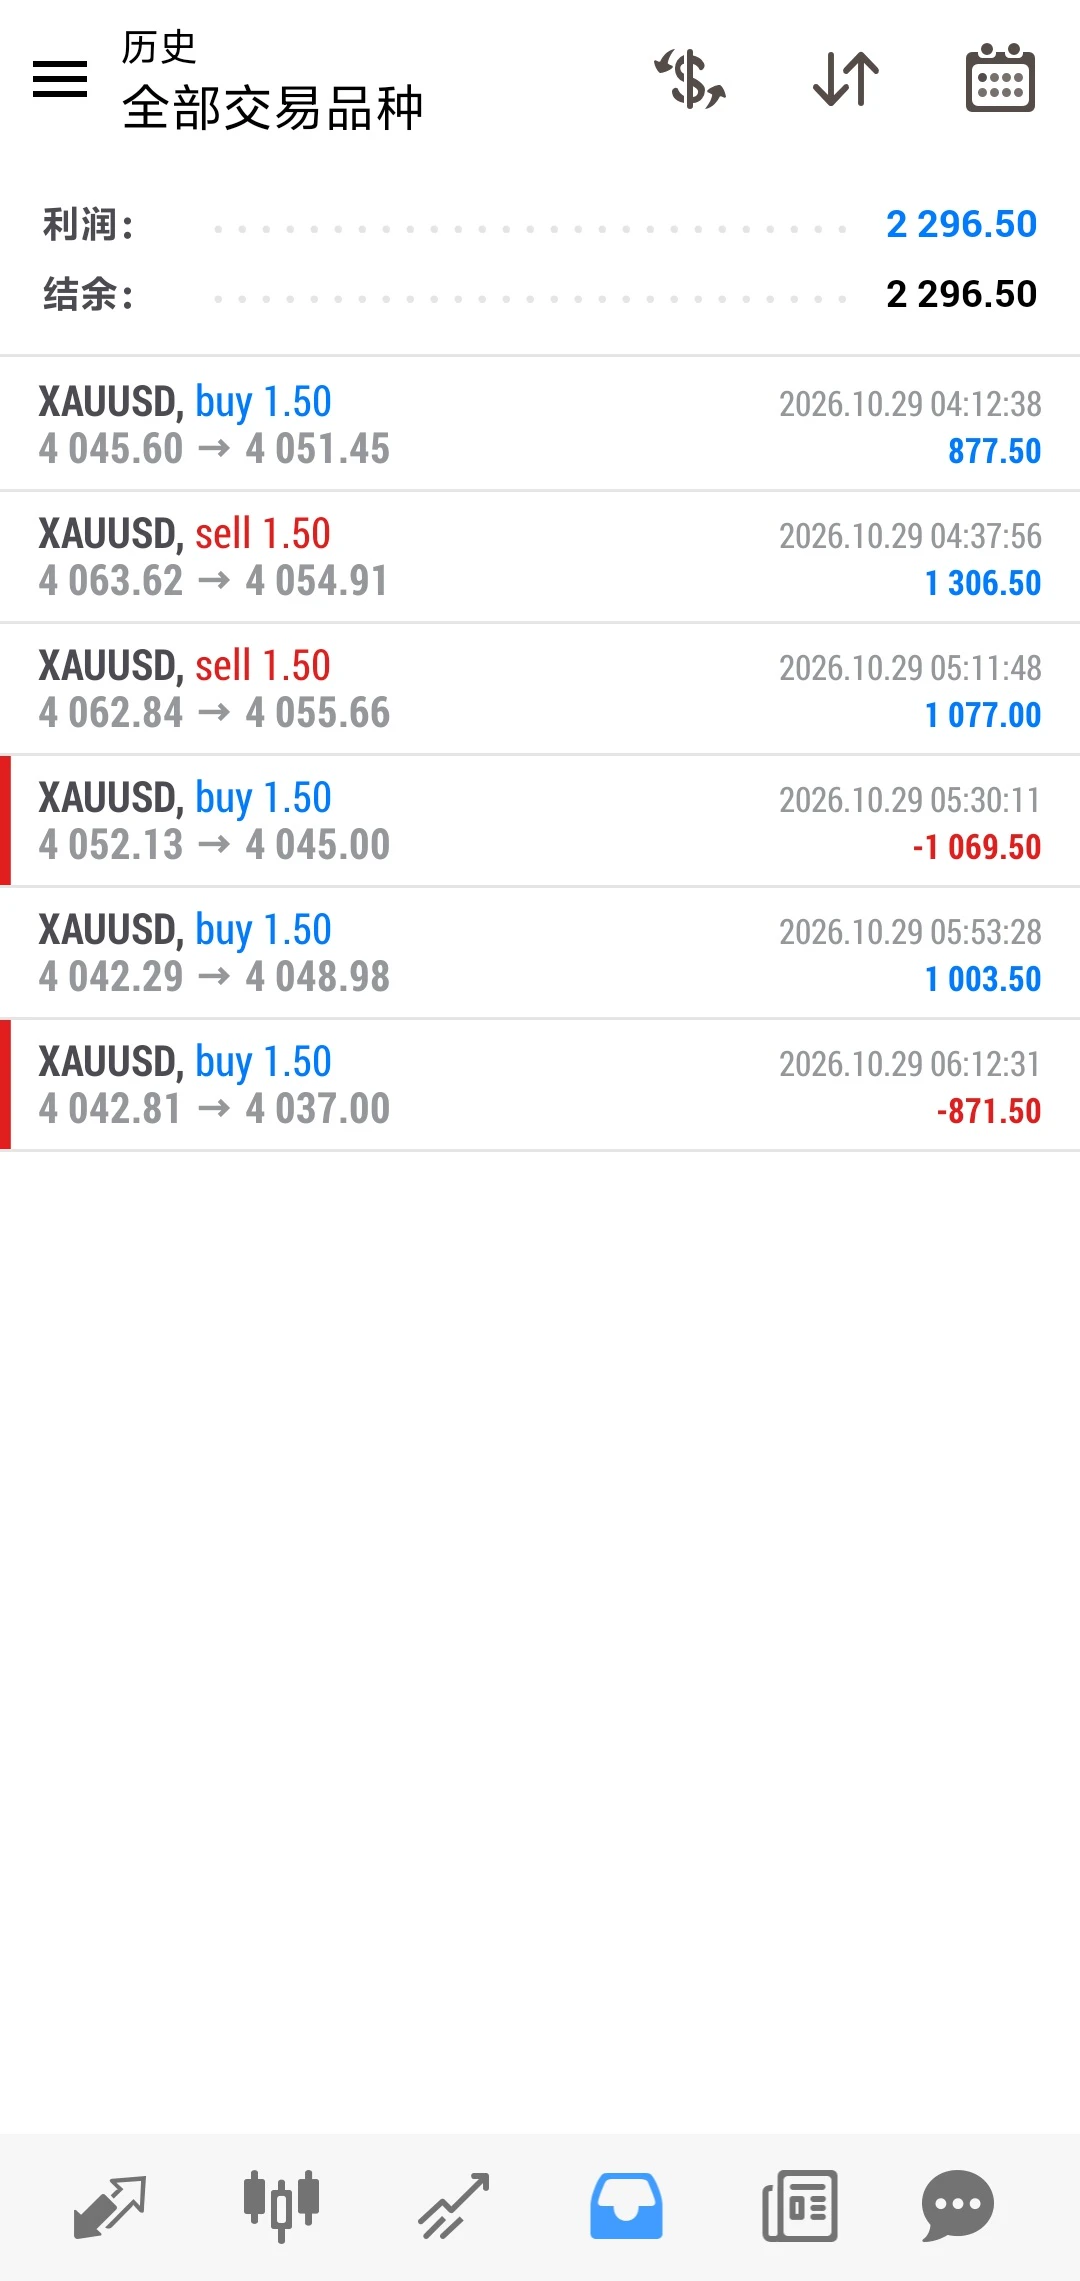
Gold's six-win intraday streak is over!
Long at 4042, stop-loss at 4037, -5 points, -871🔪$XAUT
post-image
XAUT+0.30%
A friend said, “I don’t watch the markets every day. I can put my coins in a pool and still earn a share of the fees.” It sounds like collecting rent, but where does that income actually come from?
Think of a liquidity pool as an automated exchange counter. When someone wants to swap one coin for another, the counter needs assets available for exchange.
People who provide those assets are called liquidity providers, or LPs for short.
When users swap through the pool, the protocol charges trading fees according to its rules, and a portion goes to eligible LPs. Some pools also allocate a share o
post-image
Gold Reclaims $4000! The More Volatile the Market, the More Important It Is to Remember These 3 Investing Principles
Gold's return above $4000 has brought a little warmth to recently tense markets. Gold prices are like life: sometimes things go smoothly, and sometimes there's a sudden downturn. The difference is that mature investors don't question the world over a single pullback, nor do they think they're invincible after a single rebound.
First, trends matter more than emotions. Gold's rise is supported by safe-haven demand, but interest rate expectations, the US dollar's movements, and inf
META-1.24%
  • 35
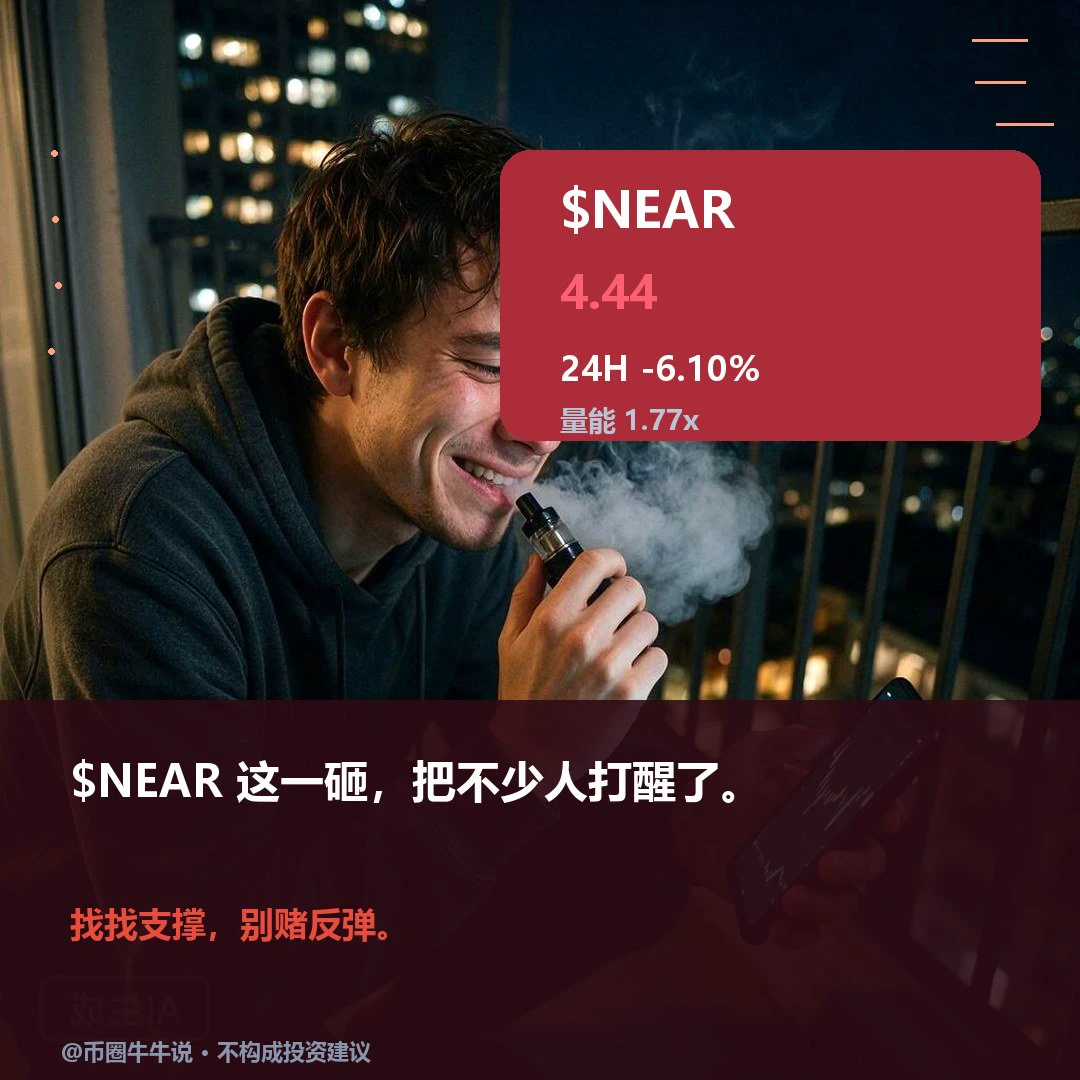
$NEAR Currently trading at 4.436, down 6.1% over 24H (range: 4.428–4.81). The 1H/4H structures are both weak. RSI at 35/48 looks oversold, but volume is 1.77x. The key is whether 4.81 resistance can be broken on strong volume. If 4.428 support breaks, the decline could accelerate. When reviewing, focus on whether the test of 4.81 is accompanied by real buying; a rally on no volume is a paper tiger. Market volatility is high; for observation only.
post-image
$SAMSUNG Down 8%—is it time to buy the dip or keep shorting? It all comes down to these 3 key price levels!
SAMSUNG fell from 185.96 to 170.29, a drop of nearly 8%. Net outflows over 24 hours reached 12.77 million, and short-term funds have yet to show a clear bottoming signal.
Buying the dip right now could mean catching another leg down; chasing shorts after the drop could also leave you getting burned by a rebound.
My trading plan is clear:
① Short the rebound: If the price rebounds to around 173–175 and then pulls back after a spike, with the 1-hour candle closing weak, consider testing a
SAMSUNG-0.12%
  • 5
  • 2
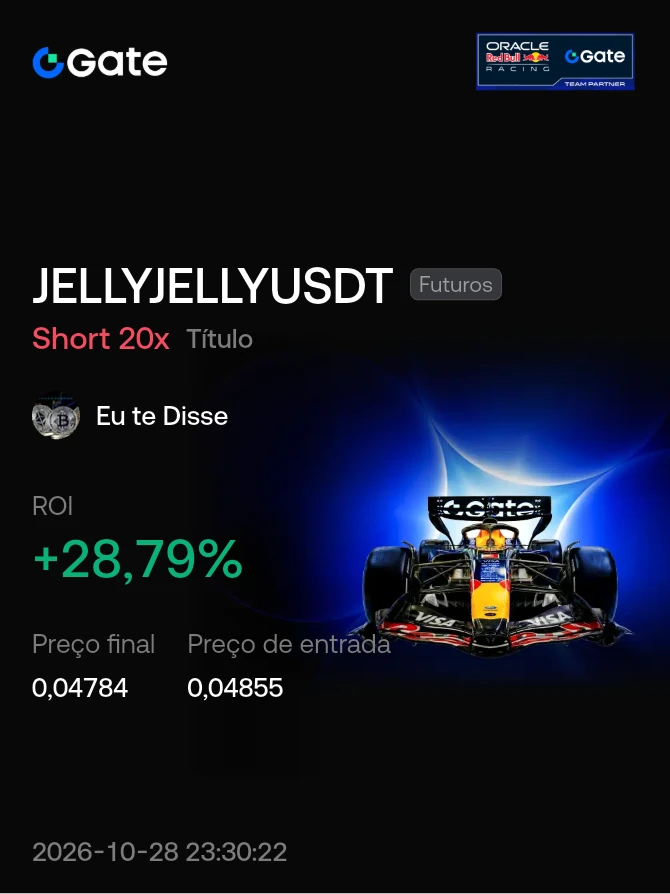
#Share My Holding Returns# $JELLYJELLY
I hope this short position gives me a return by the end of the workday 🔻🔻🔻
post-image
The more spectacular the AI results, the harder the stock falls? Google gave investors a reality check
Cloud business growth of 103% still isn’t enough? Google’s stock briefly fell nearly 10% as the AI frenzy enters the time-to-do-the-math phase!
If investing in the stock market is like dating, AI is the charming partner with a bright future, while free cash flow is their paycheck.
A handsome face and promising prospects are certainly alluring; but if you keep investing in the future and draining your wallet every month, even the sweetest relationship is bound to make you uneasy.
Google Cloud’
GOOGL+1.58%
  • 20
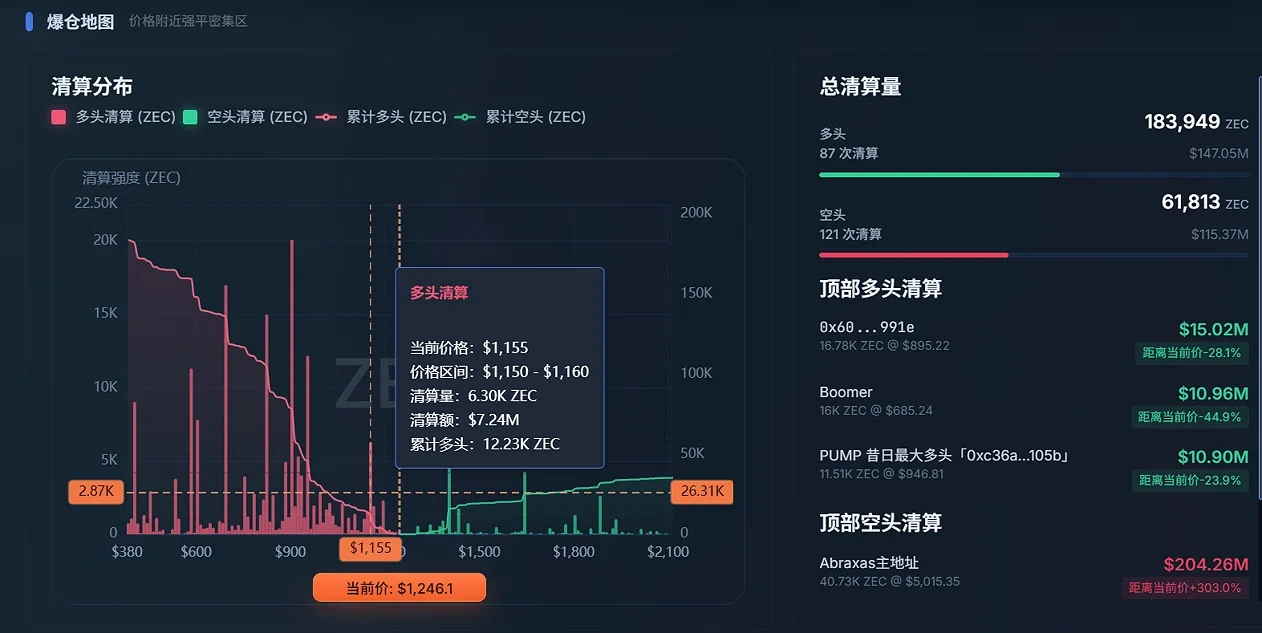
Were longs at 1310 “buried alive”? The truth behind ZEC’s flash crash is out—don’t stubbornly hold on! ZEC surged and then pulled back, essentially due to “buy the rumor, sell the news” combined with deleveraging. With the NU7 upgrade approaching on November 5, major players used the positive news to distribute at higher prices, while continued ETF outflows weakened spot demand. Technically, a break below 1300 on the 4-hour chart triggered a cascade of long liquidations, and leveraged long positions whales had opened ahead of the FOMC instead became fuel for the sell-off. Exit strategy: trim y
post-image
ZEC+1.16%
  • 1
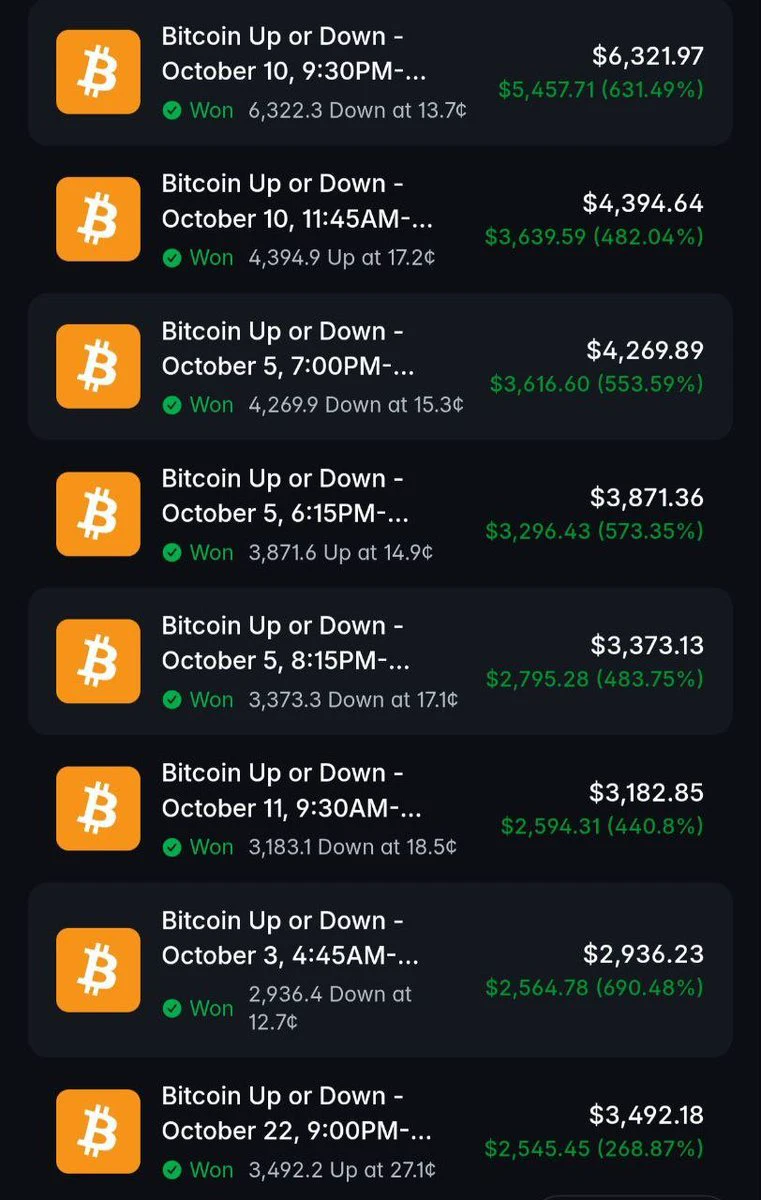
This trader bought Bitcoin markets at 13–32 cents, then sold at $1.
By doing this for just one month, they made $61,948.52.
They traded Polymarket’s 15-minute “Bitcoin Up or Down” markets.
A new market opens every 15 minutes:
Will BTC close above or below its opening price?
Guess correctly, and each share pays $1; guess wrong, and it pays $0.
The share price is the crowd’s estimate of the probability.
They won’t pay 50 cents for a coin-flip bet.
They wait until one side is priced as almost certain to lose, then buy it cheaply:
· 6,322 “Down” shares bought at 13.7 cents (cost: $864), paid out $
post-image
BTC-0.67%
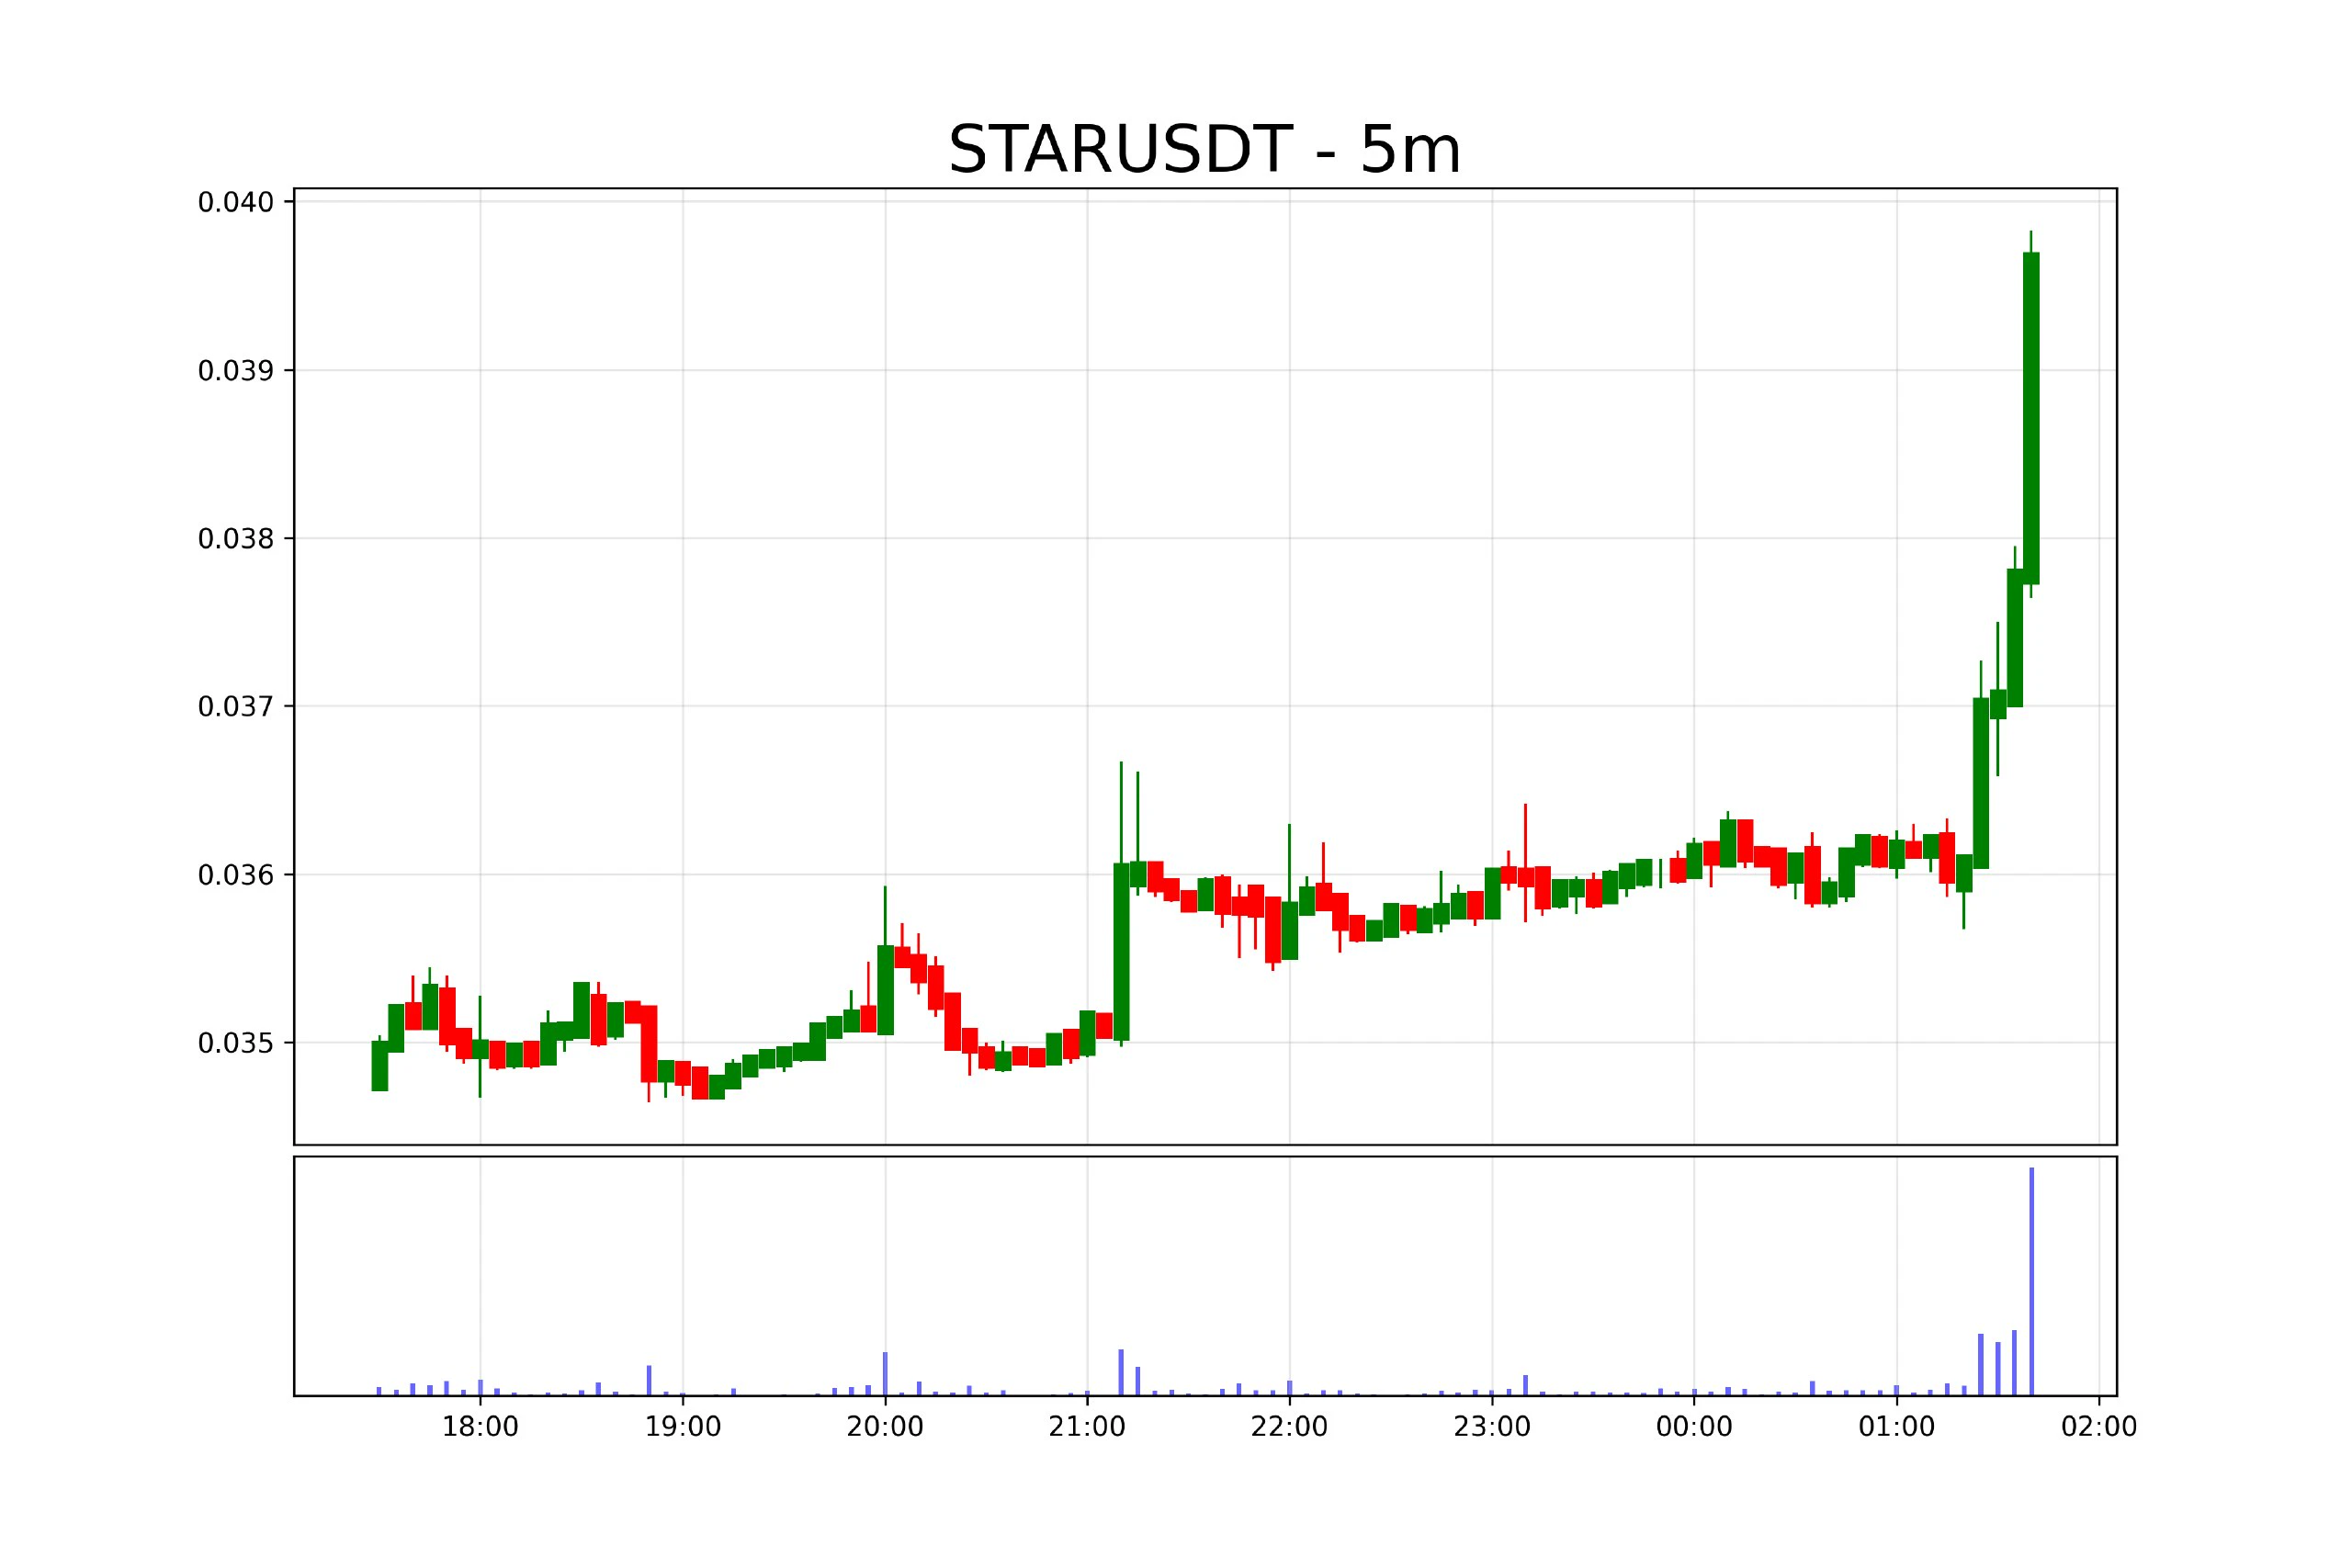
$STAR is showing strong bullish momentum, gaining 21.4% over 24 hours as trading volume jumped 876.2%. Price is currently at $0.03965, with buyers attempting to maintain control after a significant rally. The key now is whether the price can hold its breakout structure.
Current Price: $0.03965
Support Zone: $0.0375–$0.0360
Resistance Zone: $0.0410–$0.0430
Next Bullish Target: $0.0450
Bearish Target: $0.0345
A clean break above $0.0410 could open the door to another upward move. If price loses $0.0360, profit-taking may deepen the pullback. Avoid chasing an extended candle; a successful retest
post-image
STAR-0.79%
$XAN These numbers don't add up. The 24h trading volume is 151 million, but the price surged from 0.0095 to 0.0131 and then crashed back to 0.0113. The turnover rate is clearly abnormal—the volume doesn't match the market cap.
I bought in around 0.0102 a couple of days ago. When I saw the high-volume breakout above 0.011, I chased it with another buy, but I didn't sell at 0.0128—I got greedy. Now I've given back most of my paper gains, and my mindset has shifted from “hold on” to “should I get out?”
Three possibilities: first, whales are wash trading to distribute, so the volume is fake; secon
XAN-5.83%
Thursday Morning Market Updates
live-cover
LIVE2,751
new update 🥰🌹
live-cover
LIVE298
Price came down, and the short was closed right at the 2292 target
post-image
  • 5
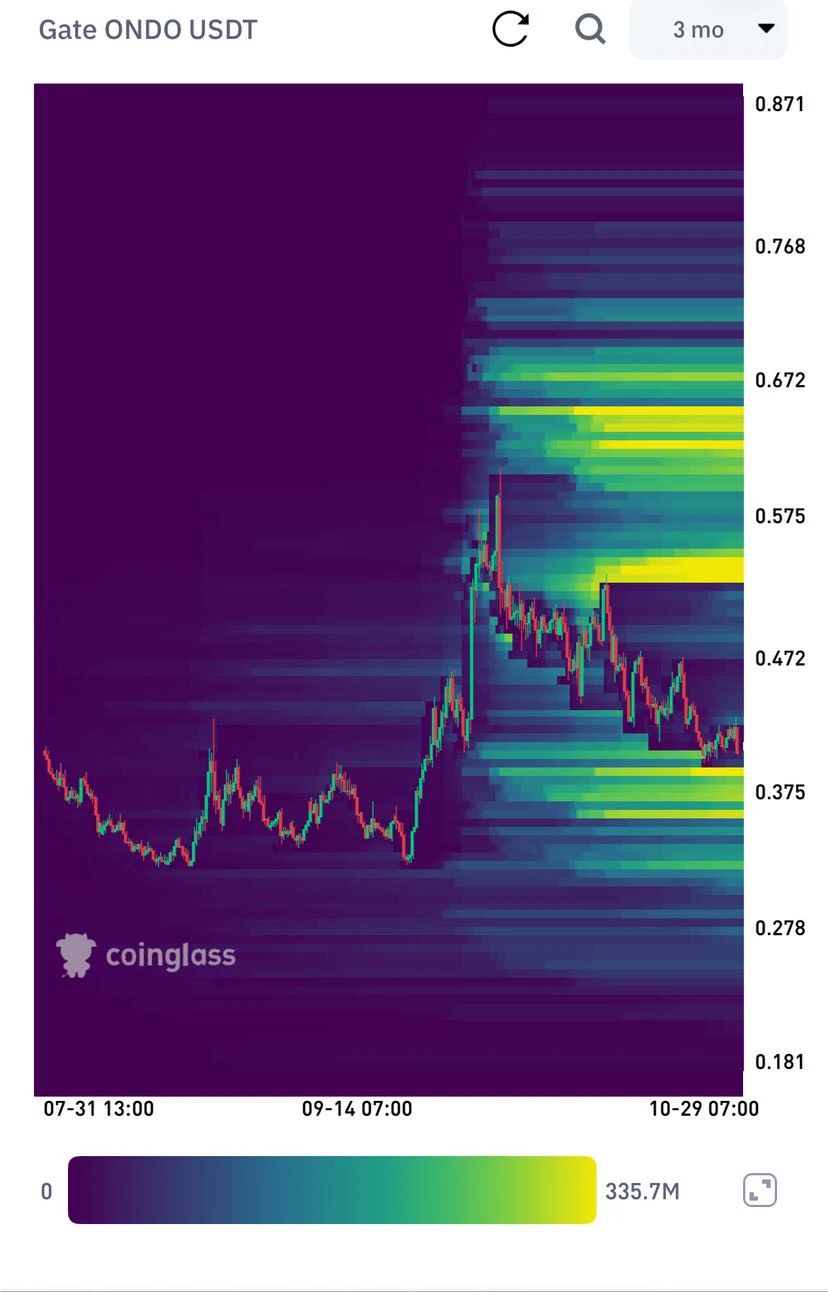
$ONDO $ONDO Sharp drop, spot accumulation opportunity 🤑🤑🤑🤑🤑🤑
🚨 ONDO: Sweep the liquidity below before taking off?
ONDO could pull back to the 0.37–0.39 USDT range to sweep liquidity before reversing upward. Above, the 0.50–0.53 and 0.60–0.68 USDT ranges are key levels to watch.
📌 Scenario to watch: Sweep the lows → shake out weak-handed investors → reverse upward.
Wait for confirmation—don't rush to catch the bottom! �
post-image
ONDO-0.29%
Load More

Join 40 M users in our growing community

⚡️ Join 40 M users in the crypto craze discussion

💬 Engage with your favorite top creators

👍 See what interests you

Trending Topics

FedKeepsRatesSteady

38.26k Views1.76k Discussing

The Fed will announce its rate decision on October 28 at 18:00 (UTC), followed by a press conference at 18:30 (UTC). Markets widely expect rates to remain unchanged, with attention turning to future policy signals. Could this decision break crypto out of its trading range? What signals are you watching?

Gate24HNetInflowsRankTop2

27.51k Views833 Discussing

GoogleCloudSurges103%ButStockFalls

148 Views465 Discussing

View More