Square
Following
Hot
News
Profile
Share your thoughts
placeholder
Article
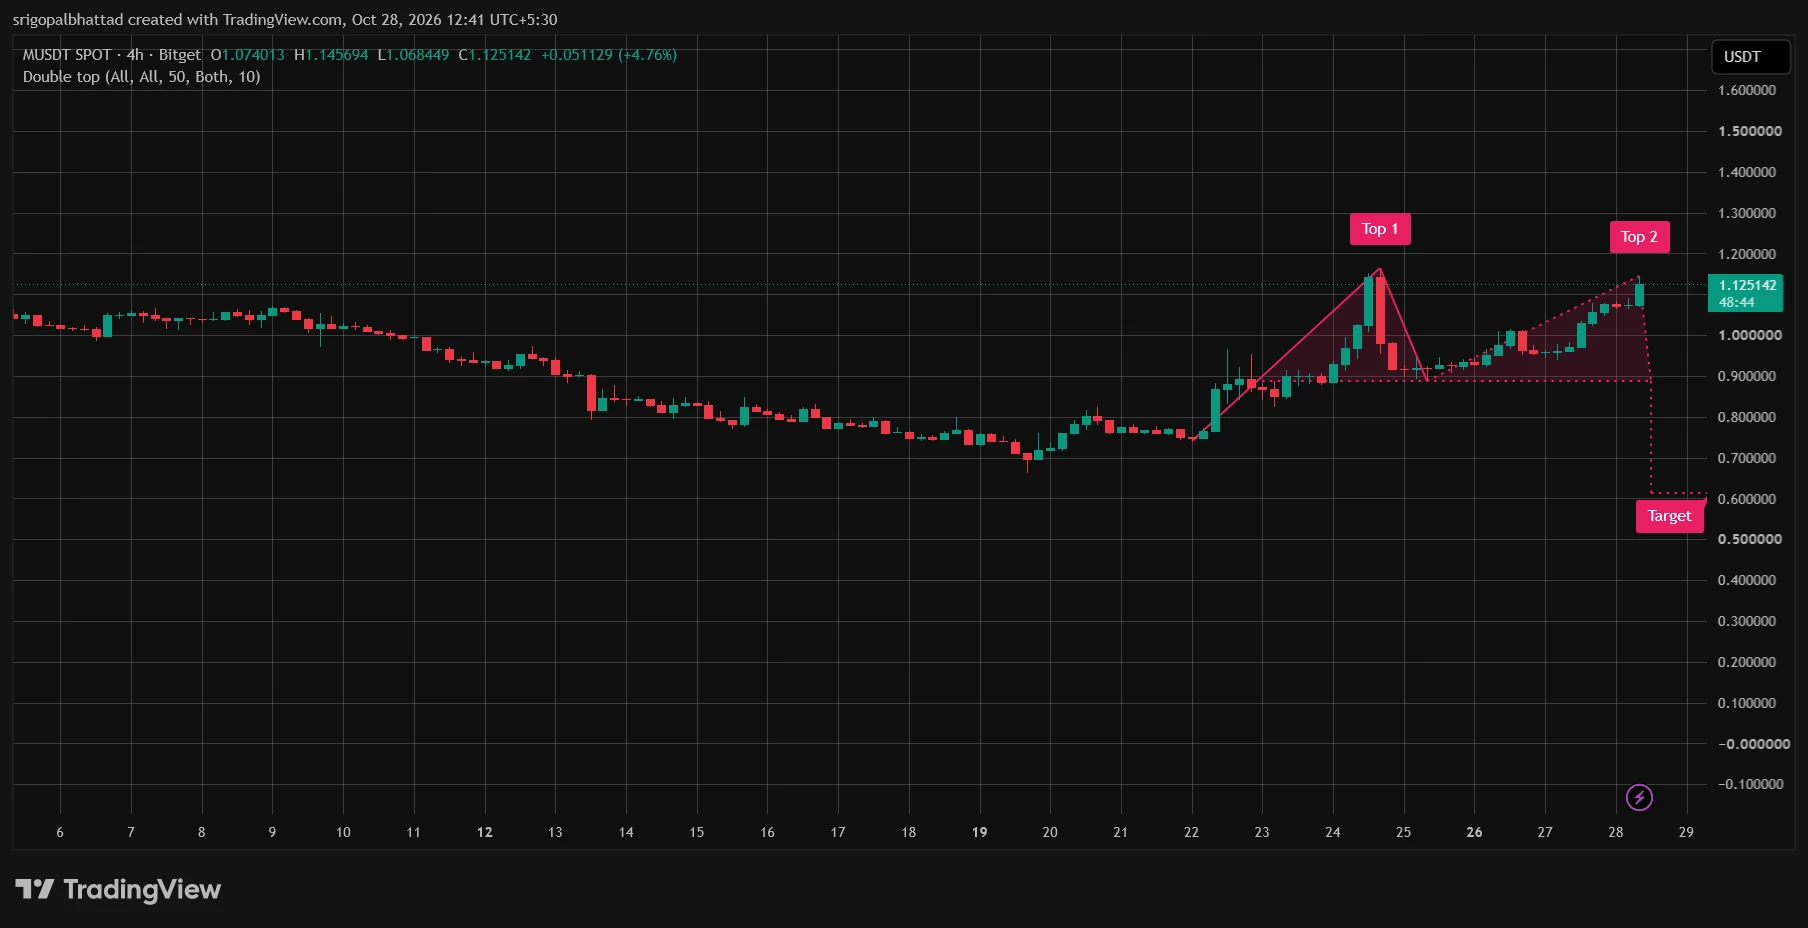
$MU SDT — Double Top Formation! 👀⚠️
$MUSDT is trading near $1.13 after rallying sharply into a potential double top around $1.16–$1.18. Sellers could step in again here, with support near $0.89 acting as the key neckline.
📉 A breakdown below the neckline could trigger a deeper correction, while a clean breakout above resistance would invalidate the bearish setup and favor further upside.
MUSDT is at a critical resistance zone — rejection or breakout? Watch closely! 🔥
post-image
MU-0.63%
Strategy suddenly hits pause on crypto buying, while Bitmine keeps adding: Are institutional heavyweights starting to “sit at separate tables”?
There’s a new twist in the crypto market! Strategy made no BTC purchases or sales last week, choosing to sit tight; Bitmine, meanwhile, added another 10.452 ETH. One is holding steady while the other keeps adding—like two investment bros at the same poker table, one picking up his teacup to study the market while the other is already quietly reaching for the chips.
But don’t rush to pass judgment on the market. Strategy pausing its purchases doesn’t me
SPCXG+0.22%
  • 14
Trenches
TTWO
T
bade
b
TTWO
TTWo...FbKo
Market Cap
$.
Change
.
24h Vol
$.
Holders
.
BNCB
B
bade
b
BNCB
0x49...ec3f
Market Cap
$.
Change
.
24h Vol
$.
Holders
.
DJT
D
bade
b
DJT
DJTu...xvoF
Market Cap
$.
Change
.
24h Vol
$.
Holders
.
ZIG
Z
bade
b
ZIG
0x8c...1145
Market Cap
$.
Change
.
24h Vol
$.
Holders
.
STONK
S
bade
b
STONK
6GmA...UNgx
Market Cap
$.
Change
.
24h Vol
$.
Holders
.
The Main Competition Kicks Off, with Trading Check-Ins Boosting the 100,000 USDT Futures Prize Pool https://www.gate.com/campaigns/6445?ref=VLARBF1YAG&ref_type=132
post-image
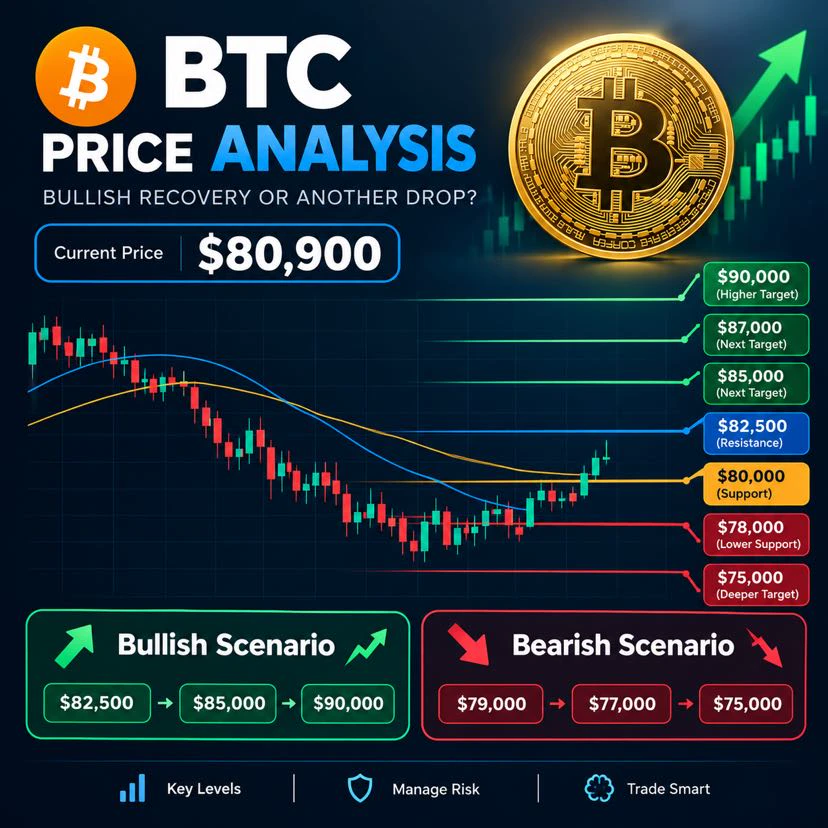
🚨 Bitcoin (BTC) Price Prediction: $90,000 Next or Drop to $75,000? 📈📉
post-image
BTC-0.67%
Crypto Market updates
live-cover
LIVE2,077
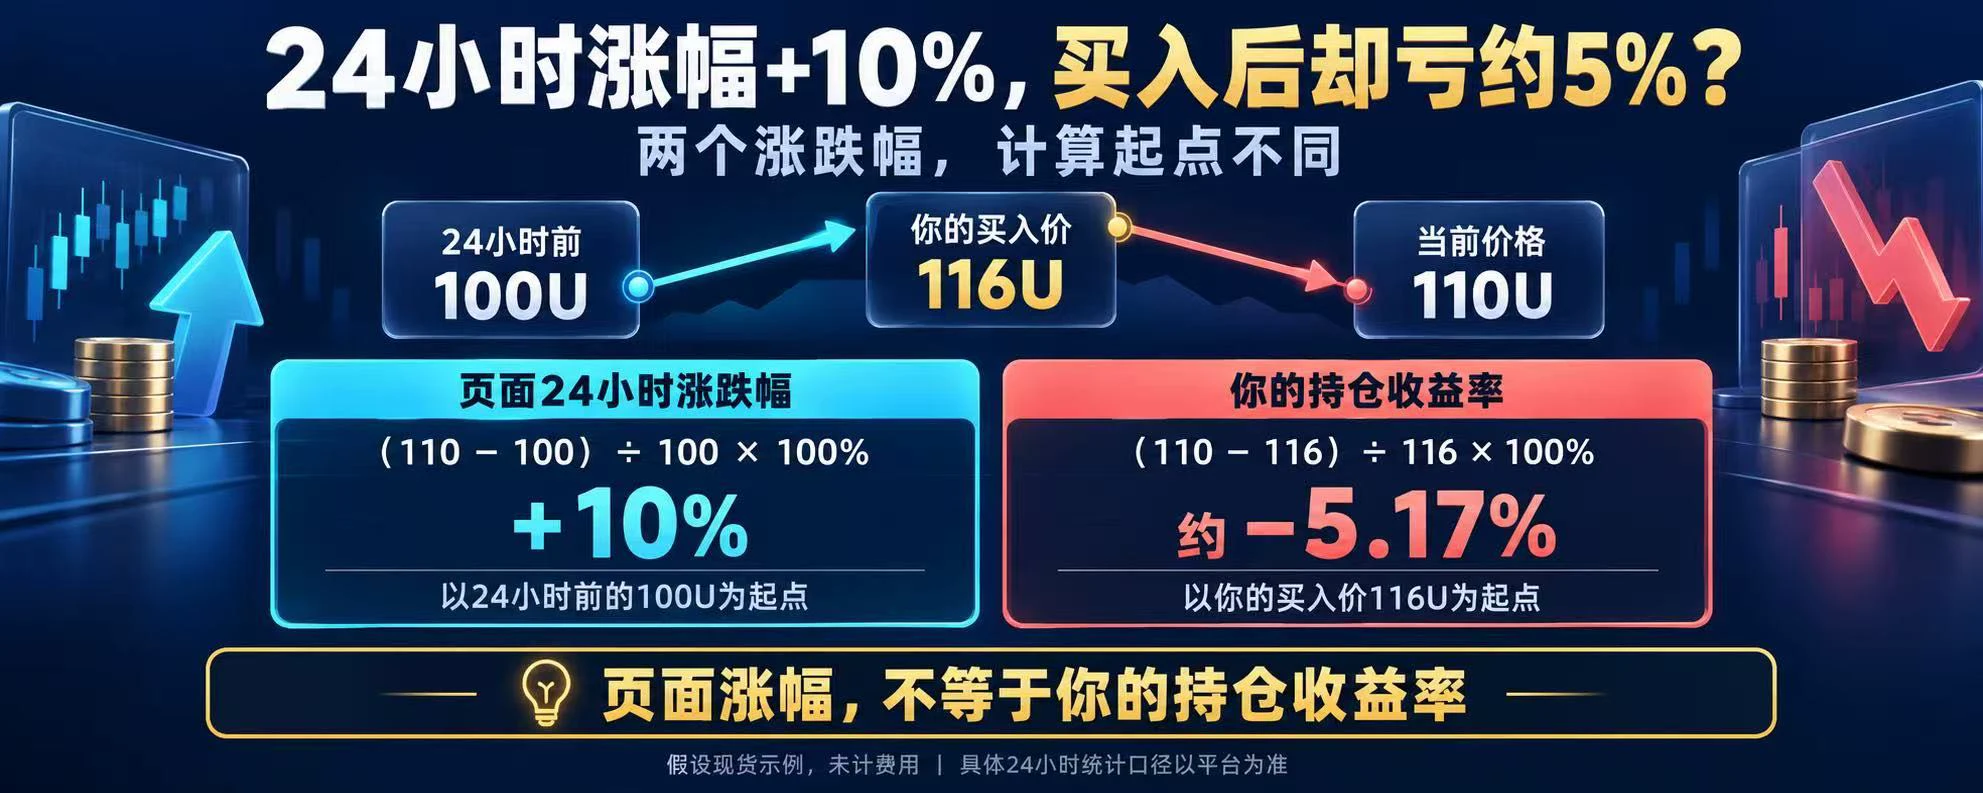
24-hour change +10%—why are you still down 5% after buying?
The page’s 24-hour change is usually calculated using the corresponding reference price from 24 hours ago; your profit or loss depends on your own purchase price.
Suppose the price was 100U 24 hours ago, you bought at 116U, and it’s now 110U. The page shows a 10% gain relative to 100U, but your holdings are down about 5.17% relative to 116U, excluding fees.
There’s no contradiction—the starting points are different.
Beginners often mistake the gain shown on the page for their own return. Check your cost basis first, and your account b
post-image
100 coins ordered, 30 filled—where did the remaining 70 go?
This is called a partial fill. Suppose you place a limit sell order for 100 coins, and only 30 have been matched so far. The remaining 70 may still be waiting, or may have been canceled depending on settings such as the order’s time in force.
A successful order submission only means the order was accepted; it doesn’t mean it has been fully filled. Check the filled quantity, remaining quantity, and order status.
The fills may also be split across multiple records.
When you’re new, seeing “Order placed successfully” can make you think t
post-image
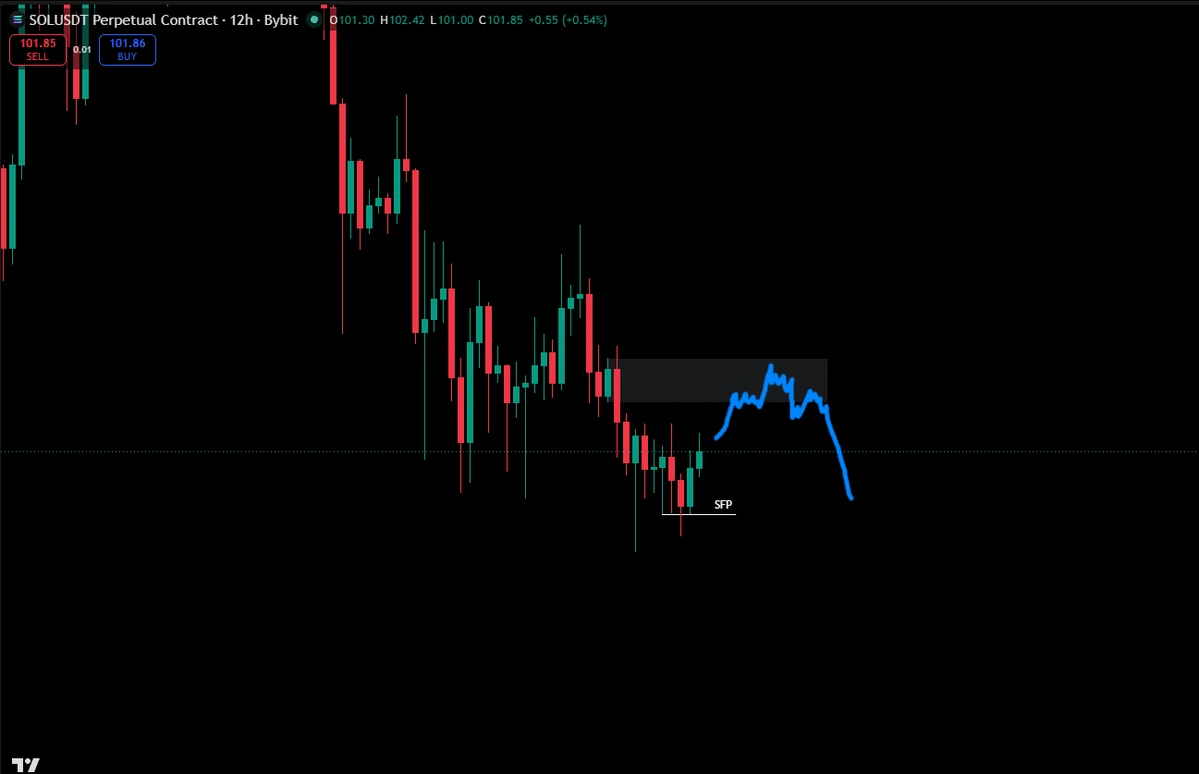
solana:So11111111111111111111111111111111111111112 has swept the lows and is now moving up.
Unfortunately, I missed the long.
I think the draw is now up into resistance at $103.40-$104.90.
post-image
SOL-0.77%
Second trade of the day
Profits and losses come from the same source. This trade didn’t go as hoped, so I exited in time to protect the account. I’ll reflect and keep waiting for a suitable entry window.
Long at 4040, stopped out at 4035, -670 USDT! $XAU
XAU+0.38%
[Halloween] Gate Live Halloween Week Event Celebrate, Create & Earn
live-cover
LIVE2,312
Why Can Prices Rebound Quickly After Falling Below a Long-Term Moving Average?
In the crypto market, long-term moving averages are often used to assess medium- and long-term trends. When prices fall below a key moving average, many traders assume a downtrend has been established. In reality, however, prices sometimes rebound quickly and move back above the moving average. Understanding this can help avoid making trading decisions based on a single signal.
First, long-term moving averages reflect historical prices. For example, MA120 reflects the average price over a certain past period, but it
post-image
gm web2 🔥
what would you do if you had a wayback machine?
post-image
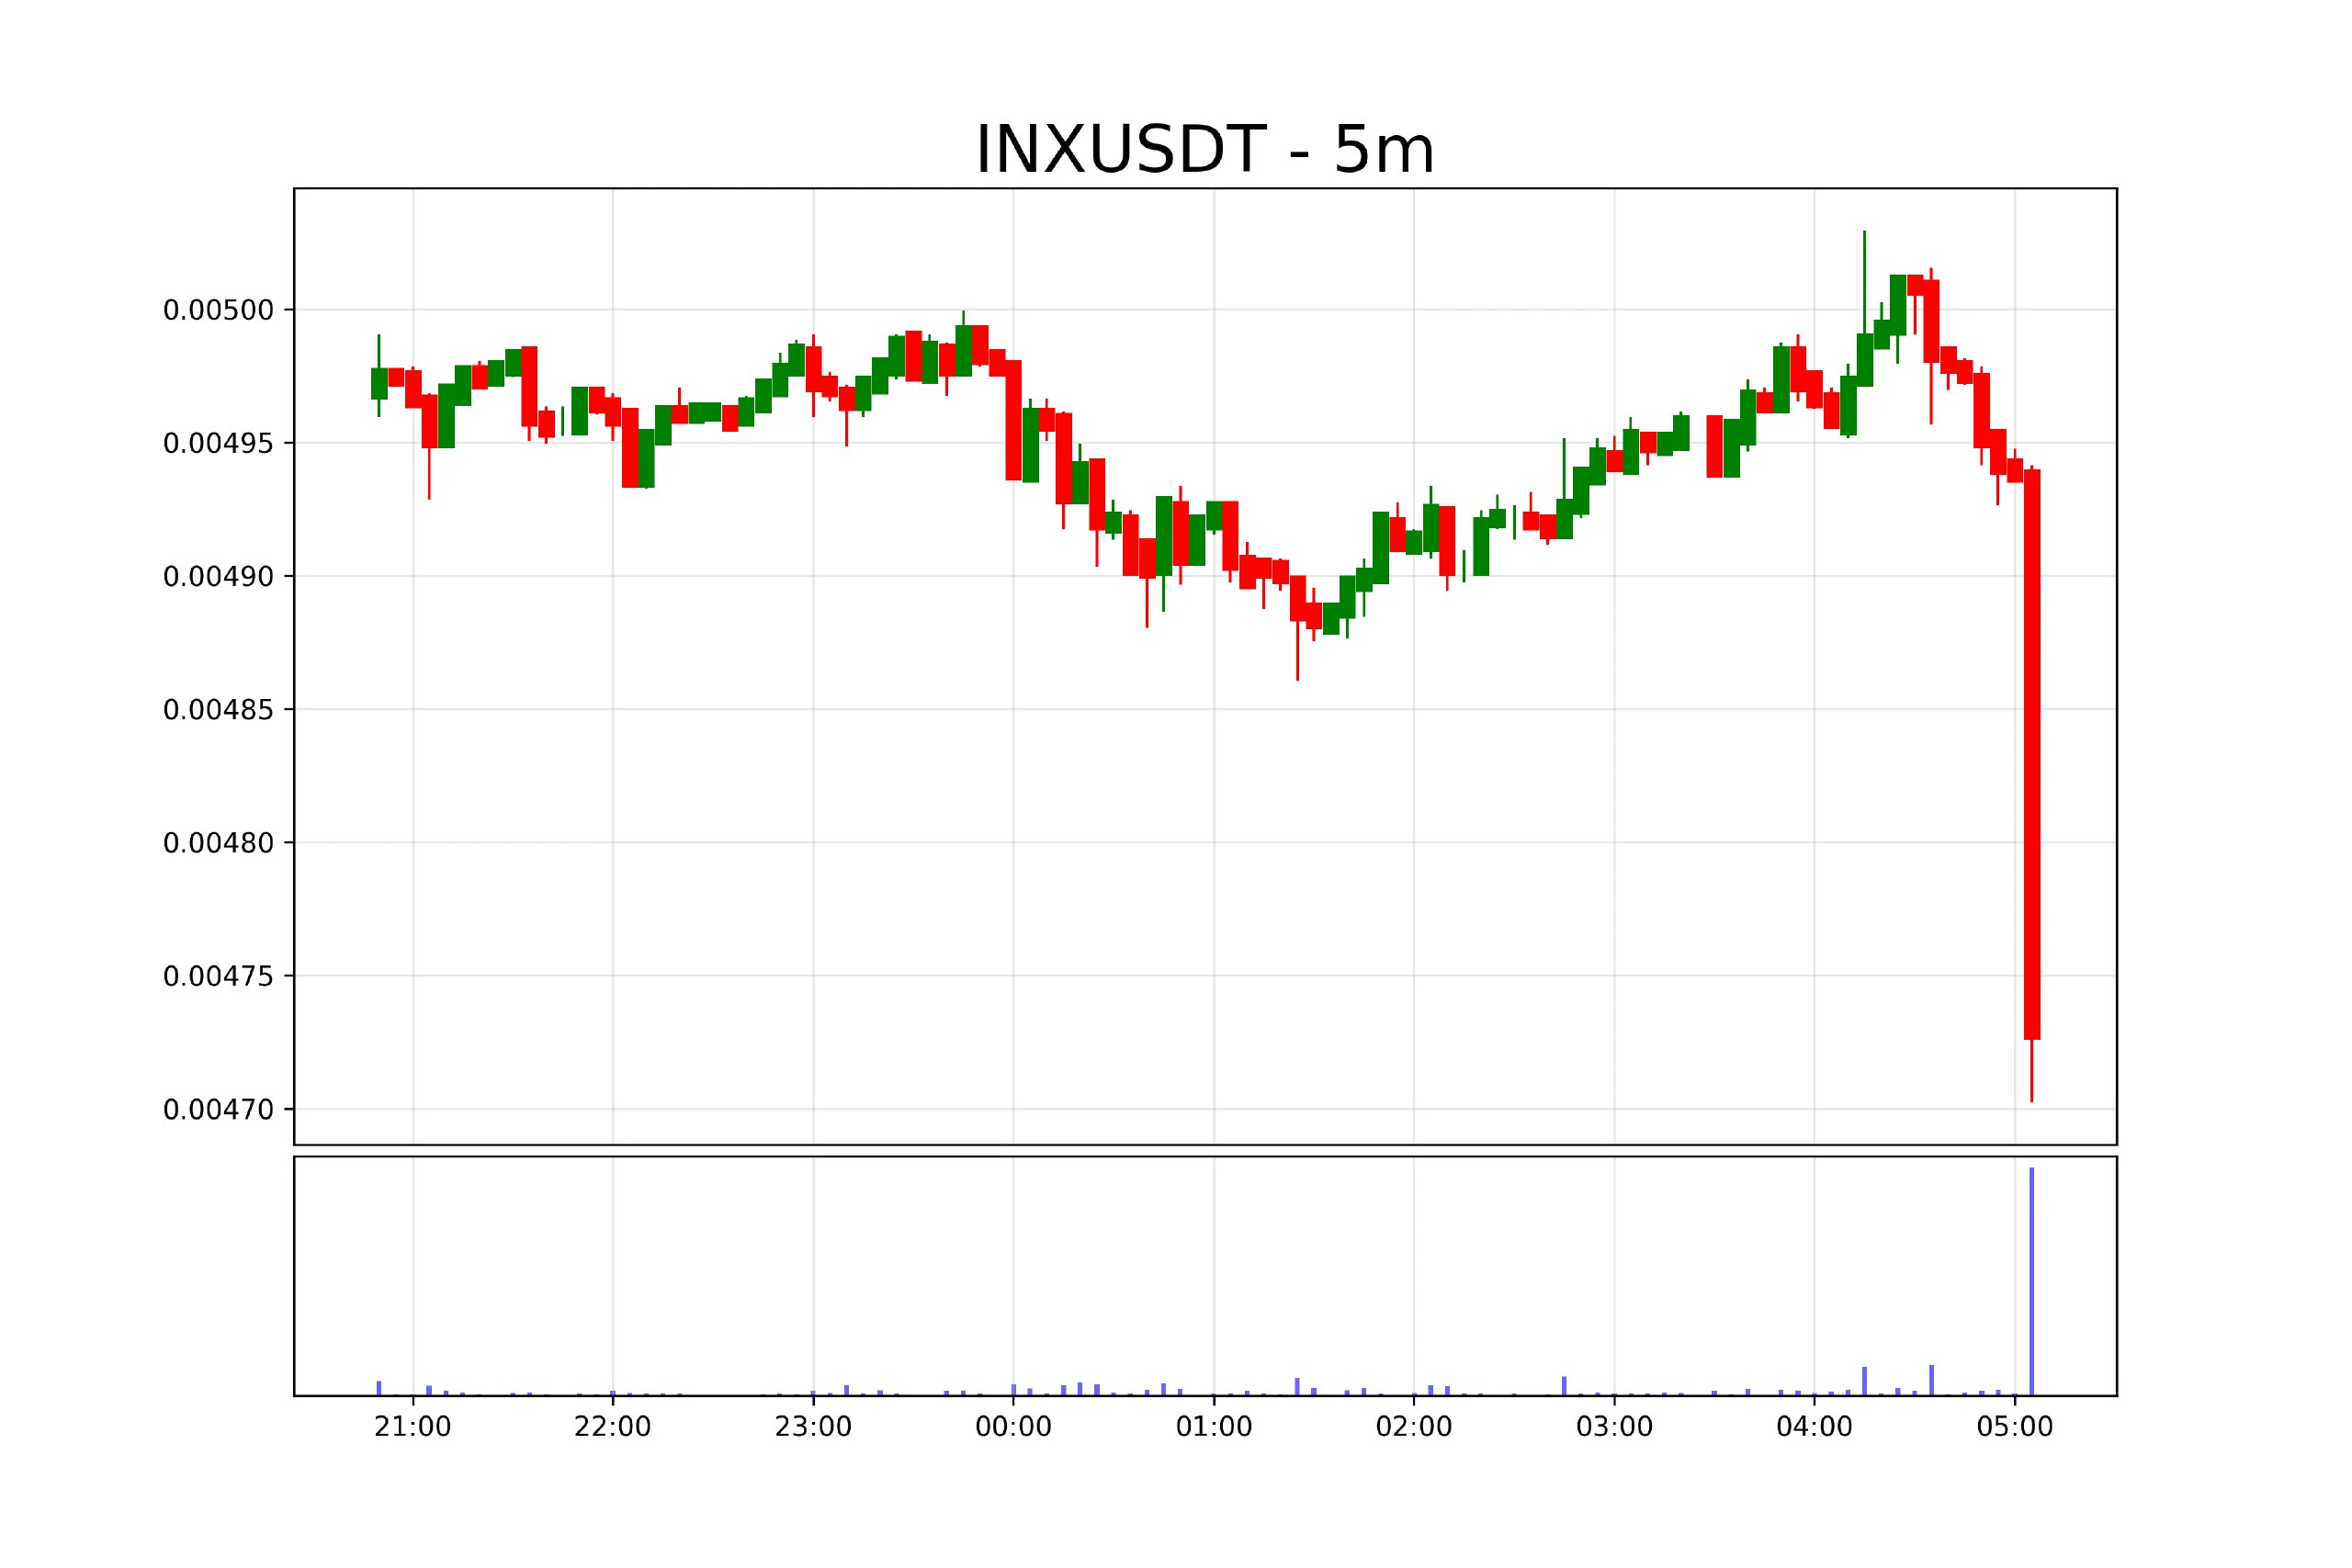
$INX USDT is trading around $0.004729, up 2.3% over 24 hours despite a recent 4.21% decline. Trading volume has surged 2,411.7%, signaling intense activity and a potential increase in volatility. Traders should watch whether buyers can defend the current price zone.
📊 Key Technical Levels
Support: $0.00455–$0.00465
Resistance: $0.00485–$0.00495
Next Bullish Target: $0.00505–$0.00520
Breakout Trigger: A confirmed move above $0.00495
Bearish Warning: A breakdown below $0.00455 could extend weakness.
🔥 VIP Outlook: A recovery above resistance could attract momentum traders, but heavy volume alo
post-image
INX-4.04%
Gold forecasts for 2026 have been cut again, to $4,495, while the 2027 forecast was raised to $4,650? Reuters’ survey is interesting, and Crédit Agricole even says the worst is already over, with gold prices likely to rebound in the coming weeks. Cutting this year’s forecast while being bullish on next year—what’s behind the contradiction? Near-term geopolitical easing and tough Fed rhetoric, but long-term inflation and central bank buying are still in play. Friends, are you betting on a short-term pullback or another surge next year?
XAUUSD-0.63%
Does a 1 million U buy order in the order book mean the price can't fall? Distinguish between two things
Order book orders are buy and sell intentions that have not yet been executed; trade records are transactions that have already taken place. The two should not be confused.
A large buy order may be filled, or it may be modified or canceled. Whether it can absorb sell pressure also depends on the size of subsequent sell orders and changes in the order book. You can't treat a snapshot from any one moment as a guarantee of price support.
The order book is constantly updating.
When I was just s
post-image
With the same 1000U, the outcomes can be worlds apart. This 31.21% rally in $BEAT means that three days from now, traders who chased the price and those who waited for a pullback could see a difference of an iPhone in their accounts.
First, the data. $BEAT is currently at 0.1071, with a 24-hour high of 0.1099, a low of 0.0794, a 38% range, and a trading volume of 74.7M. What do these numbers mean? It has already rallied 35% from the bottom, and the price is now hovering near the 24-hour high. The 74.7M volume shows that money is flowing in, but you need to figure out whether the bulls are ch
BEAT-1.19%
【“Hidden Uses of Car Insurance” That 90% of Car Owners Don't Know! Save This🌟】
You pay several thousand yuan in premiums every year—don't use it only to cover major accidents! These money-saving tips can save you quite a bit when it matters:
1️⃣ Single-vehicle accident (hit a tree/wall/guardrail)
👉 Use [vehicle damage insurance].
2️⃣ Car damaged while parked or flooded
👉 Also use [vehicle damage insurance].
3️⃣ Scraped someone else's car
👉 Losses under 2000 yuan → use [compulsory traffic insurance] (don't use commercial insurance, and next year's premium won't increase)
👉 Amount over 2000
post-image
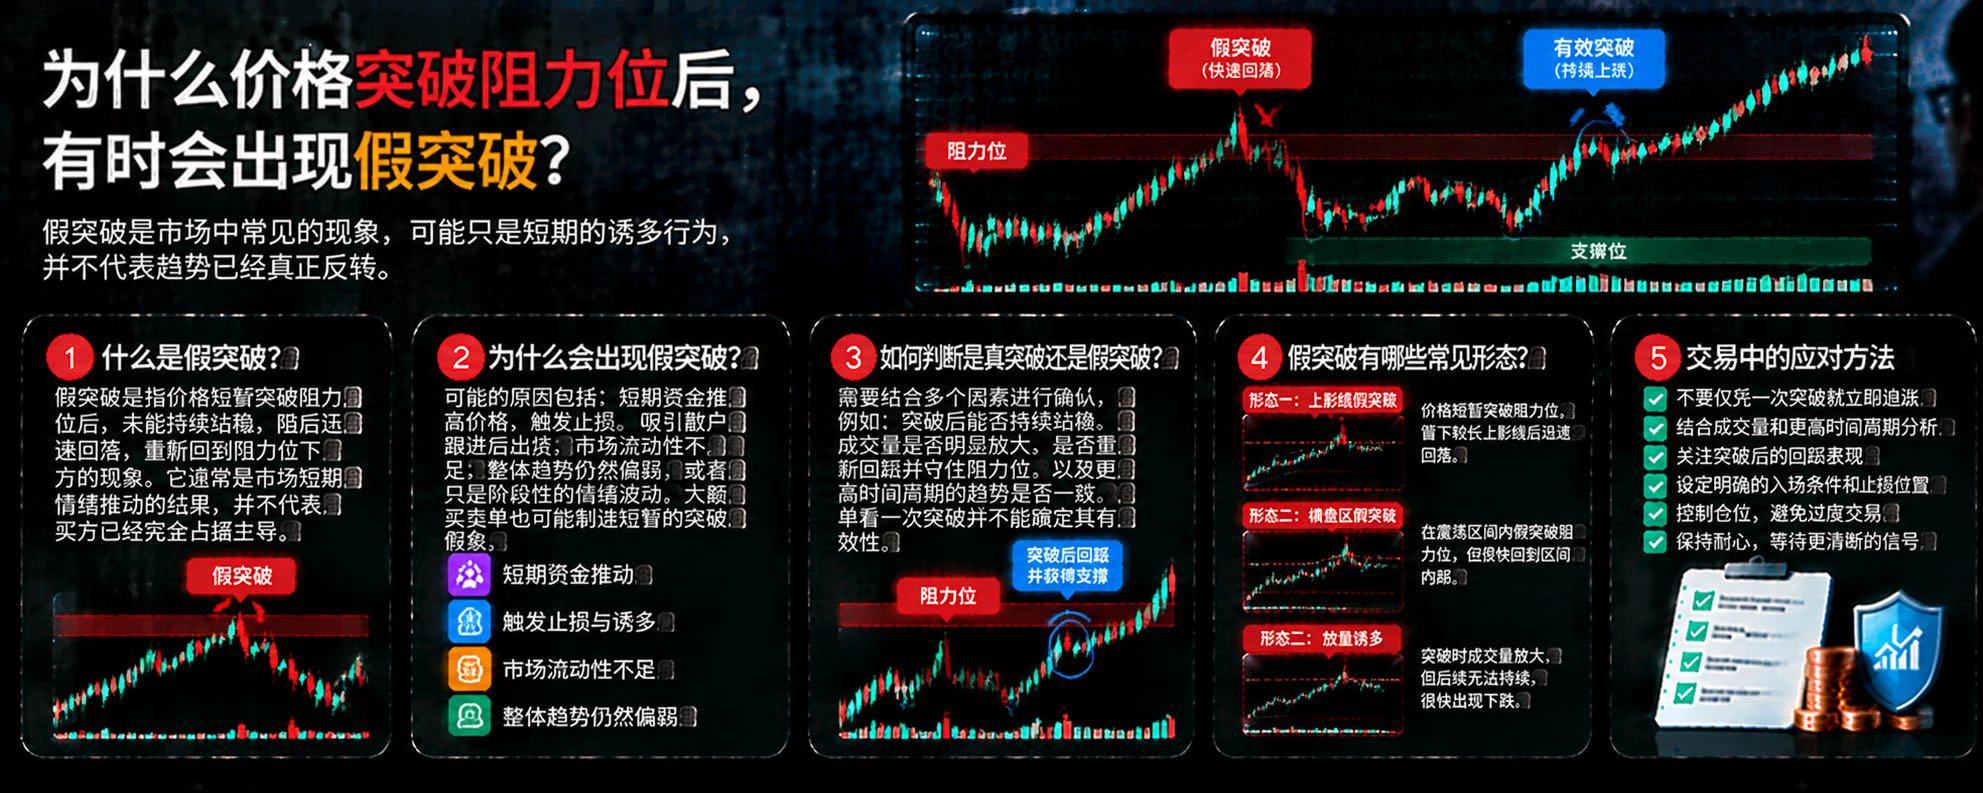
Why Do False Breakouts Sometimes Occur After Prices Break Through Resistance?
In the crypto market, a price breaking through a key resistance level often attracts traders looking to buy into the rally. But sometimes, the price quickly falls back into its previous range just after breaking through, leaving traders who bought in at a disadvantage. This phenomenon is called a false breakout and is one of the risks traders need to identify.
First, what is a false breakout?
A false breakout occurs when the price briefly breaks through an important support or resistance zone but fails to stay beyond
post-image
24-hour change +10%—why are you down 5% after buying?
The 24-hour change shown on the page is usually calculated against the corresponding reference price from 24 hours ago; your profit or loss depends on your own purchase price.
Suppose the price was 100U 24 hours ago, you bought at 116U, and it is now 110U. The page shows a 10% gain relative to 100U, but your position is already down about 5.17% relative to 116U, excluding fees.
There is no contradiction between the two figures; they use different starting points.
Beginners often mistake the gain shown on the page for their own return. Check
post-image
A circulating market cap of 100 million U, but an FDV of 1 billion U? First, understand these two figures
Why does the same coin have two valuations so far apart? Because they use different supply figures in the calculation.
Assume the coin price is 1 U and the circulating supply is 100 million coins. The circulating market cap is 100 million U. If the maximum supply is 1 billion coins, the FDV based on the maximum supply is 1 billion U.
The circulating market cap values the portion currently in circulation; FDV estimates the value of the entire supply once fully released, based on the current
post-image
Load More

Join 40 M users in our growing community

⚡️ Join 40 M users in the crypto craze discussion

💬 Engage with your favorite top creators

👍 See what interests you

Trending Topics

FedDecisionCountdown

26.27k Views1.22k Discussing

The Fed will announce its rate decision on October 28 at 18:00 (UTC), followed by a press conference at 18:30 (UTC). Markets widely expect rates to remain unchanged, with attention turning to future policy signals. Could this decision break crypto out of its trading range? What signals are you watching?

GateFirstToLaunchGoldCFD7X23Trading

37.41k Views6.34k Discussing

SKHynixQ3RevenueHitsRecordHigh

2.31k Views2.61k Discussing

View More