Square
Following
Hot
News
Profile
Share your thoughts
placeholder
Article
Price action does not care about your feelings today. $LINK printed a brutal 5.18% drop, sliding from $12.807 down to $11.954 and flirting dangerously with the $11.922 low. Chasing these moves or trying to claw back losses immediately is account suicide. Stay cold and let the range define your next move. Not financial advice and DYOR. Try setting a hard rule to close your trading terminal the moment you feel the urge to FOMO into a moving candle. #GateIdleEarnAutoYieldUpTo3% #GateLaunchesTrenchesWith0GasFee #ShareWeekly #WeekendMarketBullishOrBearish
post-image
Good morning! $SPY
Slight drop here following PPI. Will watch for gap fill on SPY back to $769.6.
Resistance right around $770 with gap + key level!
post-image
SPY-0.85%
Some people said Machi had unlimited bullets, and at first I didn’t believe it—until I saw his post… Who would still have the mood to splash around in the water after losing over $10 million?$ET $BTC
post-image
ET-2.35%
BTC-2.45%
$BTC U.S. CPI and PPI both exceed expectations; can rates be raised again this year?
CPI and PPI both came in significantly above market expectations, with the inflation rebound shattering the market’s previous optimistic assumption that inflation would gradually ease and reviving the possibility of another Fed rate hike this year. This round of inflation rebound was mainly driven by energy prices, but core CPI also strengthened, indicating that services inflation remains sticky and that upstream price pressures will gradually be passed through to downstream consumers. This hits the risk the F
post-image
BTC-2.45%
An unpopular take: $ENA 's current -6.29% is not as informative as it looks.
$ENA is currently priced at 0.1862, down -6.29% over 24 hours. One-hour support is 0.1825, resistance is 0.2005, and current volume is 0.13 times the average volume of nearly 20 candles. What is truly useful in the numbers is the range defined by 0.1825 and 0.2005.
Here is where I stand: I only treat oversold conditions as a reason for a rebound, not proof of a bottom; only after making no new low is it worth discussing a trend reversal. The one-hour chart is weak, with RSI at 32; the four-hour chart is weak, with RSI
post-image
ENA-6.04%
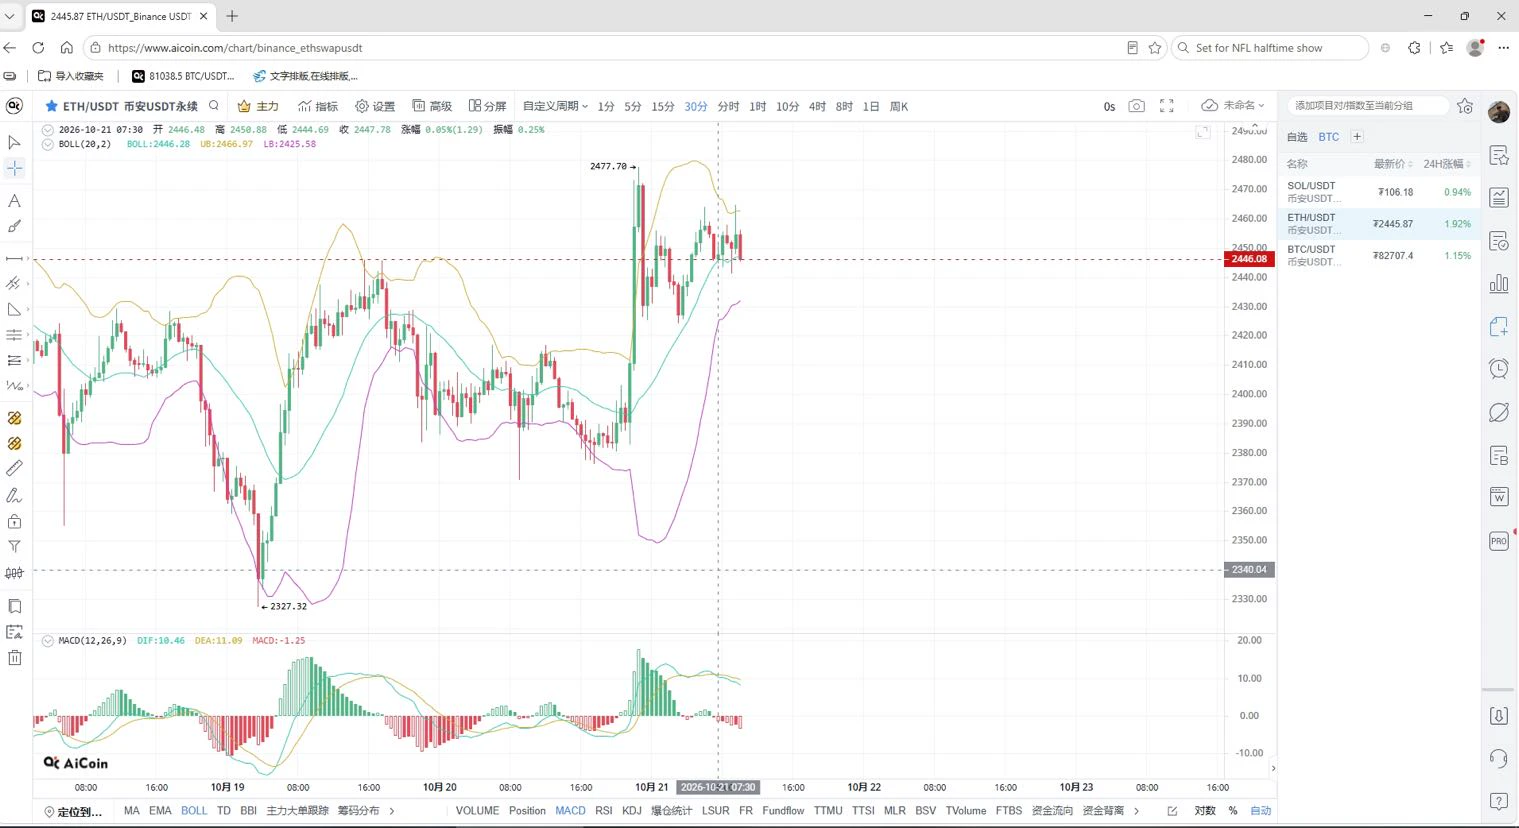
ETH outperformed BTC, with the intraday low reaching around 2313! It then rebounded to around 2380, where we entered, before falling again to 2333, perfectly capturing a 47-point move!
$ETH #美国9月CPI超预期 #美国9月PPI数据公布 #Solana大升级定档
post-image
ETH-4.39%
#BTCBreaksBelow82K Breaks Below $82,000. Is This a Temporary Pullback or the Start of a Deeper Correction?
Bitcoin falling below the $82,000 level is a development that deserves close attention from every trader in the crypto market. When BTC loses an important psychological price level, market sentiment can change quickly. Buyers may become more cautious, sellers may gain confidence, and short term volatility can increase as traders reassess their positions.
However, a price break below $82,000 does not automatically mean that Bitcoin is entering a prolonged bearish trend. The real question
BTC-2.45%
PPI data - tonight. BTC / ETH Market Updates
live-cover
LIVE3,231
🔹Panic Selling Hits South Korean Stocks! KOSPI plunges 7 and SK Hynix crashes 10. Is the global AI
live-cover
LIVE2,510
Your $DOGE account will bleed out if you chase every single 24 hour wick. Selling the low at 0.0777 or longing the top at 0.08499 without a plan is how a -5.318 percent daily slide turns into a total account wipeout at current 0.0803 levels. Stay frosty and guard that stack. Not financial advice, DYOR. 🧠 Master your mindset. ⏳ Patience beats panic. 📉 Accept small losses. $DOGE #GateIdleEarnAutoYieldUpTo3% #GateLaunchesTrenchesWith0GasFee #ShareWeekly #WeekendMarketBullishOrBearish
post-image
DOGE-4.76%
After reviewing 48 candles, only one number looks off
Using $XAU , let’s explain a term: downside stop-loss sweep
Q: What does that mean?
A: First jab into where the crowd is, sweep the stop losses, then reverse and rally
Q: Where was the jab this time?
A: Last night at 20:00, one candle crashed from 4148 to 4095.82, with volume 7 times the usual
It later dipped to 4084.17 before climbing all the way back
The current price is 4155.83, just 0.3% below the 24h high of 4168.14
Q: So can we chase it?
A: Chasing in at this level just makes you part of the next batch of stop losses to be swept
Only
post-image
XAU+1.38%
Slow is fast. Mainly trading gold intraday with short-term strategies, with stop-losses capped at 10 points. Starting with 500u, stop after earning 50–100 a day—only realized profits are truly yours! Withdraw profits at 12:00 daily. For copy trading, a 30% stop-loss is recommended. Risk control comes first! #美国9月CPI超预期 $XAUUSD
post-image
XAUUSD+1.15%
#LedgerDevicesImplantedWithSpyChips
🚨 YOUR HARDWARE WALLET MAY LOOK GENUINE — BUT IS IT REALLY SAFE?
Ledger Supply-Chain Security Incident | October 15, 2026
A hardware wallet is designed to protect the private keys controlling your cryptocurrency. But what happens when the device itself is physically modified before it reaches the customer?
The recent Ledger security incident has raised a serious question for the entire crypto industry: Can we trust a hardware wallet simply because it passes an authenticity check?
My view is clear: self-custody remains essential, but security begins before
post-image
#BTCBreaksBelow82K
BTC BELOW $82,000: WILL $81K HOLD OR WILL BITCOIN FALL TOWARD $80K? 📉
Bitcoin’s next move could decide whether this correction becomes a buying opportunity or develops into another leg lower. My view is simple: I am not buying just because BTC has fallen. I want to see buyers defend support, selling pressure weaken, and price reclaim important levels first.
The September US CPI report has added another challenge for risk assets. Bitcoin is trading around $81,000–$82,000, while traders are watching whether the market can stabilise after the breakdown below $82,000.
1. WHY D
post-image
The Fed’s “Data Blind Spot” — The Special Significance of PPI Under the Shadow of the Government Shutdown
When data itself becomes scarce, the market value of every piece of information is amplified. PPI during the government shutdown is precisely this kind of “information lever.”
The release timing of this PPI data is itself worth considering. Under the normal schedule, September PPI should have been released in mid-October, but statistical delays caused by the government shutdown pushed the release back by several weeks. At a press conference in late October, Powell candidly stated: “Regardi
ETH-4.39%
The new crypto bull/bear market indicator is literally @cz_ 😂
post-image
$ETH /USDT — THE NEXT BIG MOVE IS NEAR
ETH remains inside the horizontal demand zone following a strong bearish rejection.
Bullish Setup: A confirmed bounce could shift momentum upward.
Bearish Setup: A clean breakdown could open the door to lower levels.
No confirmation, no rushed entry.
Which side takes control next?
#USSeptemberCPITopsEstimates #DrLinHanSpeaksAtOxfordUnion #GateWCTCS9GlobalTradingCompetition
post-image
ETH-4.48%
Supply absorption during a recovery can reveal whether buyers are strong enough to sustain the move
$BTC whale accumulation may support further upside but the real confirmation comes when rising demand holds against renewed selling pressure
post-image
BTC-2.45%
#BTC跌破8.2万
Bitcoin Falls Below $82,000: Is a Deeper Correction Coming, or Is a Rebound Near?
Bitcoin (BTC) is facing renewed selling pressure after falling below the psychologically important $82,000 level. This development has attracted the attention of traders and investors across the cryptocurrency market, raising an important question: Is this the beginning of a deeper correction, or could Bitcoin recover and regain its bullish momentum?
According to market reports on October 15, 2026, Bitcoin traded around $80,743 after reaching an overnight low near $80,247. Higher-than-expected U.S.
BTC-2.45%
ETH-4.48%
Tonight’s PPI release—I’m less interested in “how much further inflation has fallen” than in whether U.S. stocks are actually willing to buy into it.
If PPI cools broadly, pressure on the market’s expectations for the subsequent interest-rate path will ease somewhat, which would of course be more favorable for long-duration, high-valuation assets like $NVDA and $AMD ; but if core components remain hot, or if the decline in the data actually reflects weak demand, tech stocks may not be able to comfortably benefit from the “cooling inflation” tailwind.
Macro trading can be this awkward sometimes
post-image
NVDA-2.69%
AMD-5.65%
GLDX+1.46%
PAXG+1.16%
XAU+1.38%
Load More

Join 40 M users in our growing community

⚡️ Join 40 M users in the crypto craze discussion

💬 Engage with your favorite top creators

👍 See what interests you

Trending Topics

USSeptemberPPIBeatsExpectations

91.35k Views1.84k Discussing

US September PPI came in at 6.3% YoY, well above the 5.3% market expectation, pointing to renewed producer-side inflation pressure. Weekly jobless claims were 199K, broadly in line with forecasts. Could hotter inflation further reduce room for rate cuts, and what does it mean for $BTC, US stocks, and gold?

DrLinHanSpeaksAtOxfordUnion

135.63k Views1.86k Discussing

JapanAndKoreaStocksPlunge

47.27k Views1.75k Discussing

View More