




Square
Following
Hot
News
Profile
Share your thoughts
placeholder
Article
$BTC 10.12 Bitcoin Price Trend Analysis
Bitcoin is currently in a major Wave 2 correction, followed by a Wave 3 rise.
Wave 2 consolidation is highly random, and the intervening Wave X may unfold as a flat or zigzag pattern.
Opening a long position here is not recommended. Wave X is expected to continue fluctuating for some time; consider entering a trade after the pullback.
Risk warning: This is only an analysis of the market structure and does not constitute any trading advice.
#BTC走势分析 #比特币走势分析
post-image
BTC+0.78%
I’ve launched Bat Radar on Patreon 🦇
Along with U.S. index analysis and my trend entry and exit signals, Bitcoin and Ethereum analysis-my entry and exit signals, and gold and silver analysis, I’ll evaluate macroeconomic developments, important data releases, and earnings reports from the companies I review. My commentary on the overall market outlook, options flow, and darkpool trades after the market close will also be included in this membership.
Bat Radar costs $5 per month
Let me clarify the membership scope: Individual stock technical analysis, stock selection, trading plans, and portfol
post-image
INDEX+14.64%
BTC+0.78%
ETH+1.15%
XAU+0.28%
It looks like the price is gearing up to take off. $ATOM ‌
post-image
ATOM-3.14%
90% male middle-aged old-timers, I'm quite satisfied
Come on, I'll set up the platform and meet new friends every week
AI crypto sector, leave your name 👇
$BCH BCHUSDT 4H: Trend Line From $212.80 Still Holding
Drawing a trend line under the rising lows on the BCHUSDT 4-hour chart gives a clean reference for the current leg up. Anchor A sits on Sep 15 at $212.80, the candle low that started the sequence, and anchor B sits on Oct 8 at $268.40. The two points are 139 4H candles apart, roughly 23 days, which gives the line a gentle, steady slope rather than a steep one.
The line has done more than connect two points. Between the anchors, 1 other swing low formed right on the trend line, confirming the slope before anchor B printed. After anchor B, p
post-image
BCH+2.55%
A lot of people have been searching for lumia on Binance today.
This thing has a market cap of just 30 million U, but 64 million U was traded in a day, meaning the entire supply changed hands twice in one day. For the first three weeks, its daily volume was only around 2 million U.
People dug up on-chain data showing that six wallets jointly opened positions with more than 3x leverage on Aster, involving 11.7 million lumia, and they are already sitting on 940k U in unrealized profit.
I looked everywhere and couldn't find any positive catalyst. It was just a few whales lighting the fuse, while
post-image
LUMIA+6.29%
Get ready to work, brothers! If you haven’t signed up for the wctc event, hurry and register to secure your spot on the account-flipping king team!
post-image
$dope falling wedge pump coming
solana:33jENUQnjoitkMFpvNJcSHyLAHFWJuHwT6E3E8CNpump
33jENUQnjoitkMFpvNJcSHyLAHFWJuHwT6E3E8CNpump
#crypto
post-image
SOL+1.05%
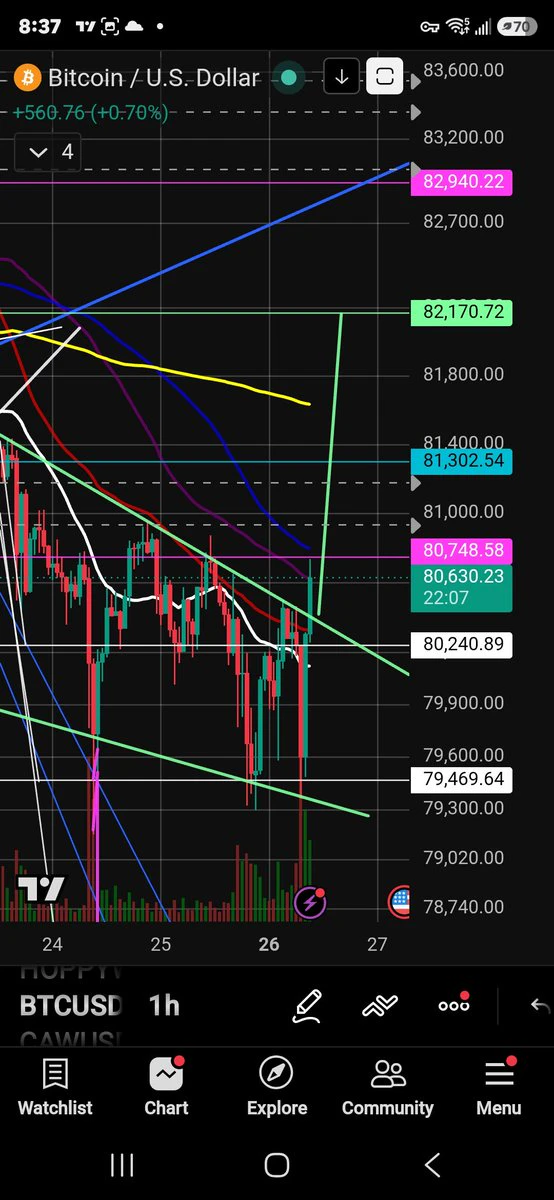
Bitcoin’s price volatility over the past two days has remained quite high. Recently, its price action underwent a sharp drop to a bottom followed by a rapid V-shaped reversal. On the 7th, it continued falling to a low of 80344 due to the Fed’s stimulus, after which the bulls quickly counterattacked, recovered the lost ground, and returned to the range. It subsequently broke out of the range and fluctuated at higher levels. The current price is fluctuating around 837. The chart is actually quite interesting: there was a major V-shaped rebound two days ago, followed by a smaller V-shaped rebound
post-image
BTC+0.80%
ETH+1.20%
#EthereumUpOver71%inQ3 ETH is printing a classic Wyckoff accumulation signature — and the next few weeks could decide the next big leg.
Ethereum has spent recent months hunting liquidity on both sides of a wide base roughly between $1,747 and $2,464. This kind of two-sided liquidity grab is exactly what you often see at the end of a prolonged corrective phase — the market shakes out weak hands on the downside, traps late shorts on the upside, and allows smarter money to quietly accumulate.
Right now ETH is trading around the mid-$2,500s after reclaiming higher ground. The structure still looks
post-image
ETH+1.15%
  • 6
  • 1
The subscribed ETH and BTC trades were all short positions entered at precise levels.
Congrats to everyone subscribed—you made a killing again.
post-image
ETH+1.20%
BTC+0.80%
Why is $LUMIA /USDT about to break the range when everyone expects a bounce?

$LUMIA /USDT - SHORT

Trade Plan:
Entry: 0.11350 – 0.11838
SL: 0.13940
TP1: 0.09834
TP2: 0.08661
TP3: 0.06902

Why this setup?
Why now? The daily trend is range-bound, but the 15m RSI sits at 34.96, showing sellers are finally exhausted after the 1h ATR of 0.009776 compressed the volatility into a tight coil. The entry zone between 0.11350 and 0.11838 aligns with the 1h price of 0.11597, giving us a precise trigger at 0.11594 to fade the range. If short sellers push from here, TP1 lands at 0.09834 and TP2 extends
post-image
LUMIA+6.36%
Another incident in the Strait of Hormuz? A tanker hit a mine and exploded, while 22 people were rescued—but tanker capacity looks set to get even tighter… Iran’s Islamic Revolutionary Guard Corps said a tanker hit a mine and caught fire in the Strait of Hormuz, while the UAE reported rescuing 22 people from another burning tanker. The two reports don’t line up, but tanker capacity was already stretched, and now another security incident has occurred—won’t freight rates and oil prices jump again? Folks, is this just a false alarm, or is the Red Sea route really about to face major changes?
10.12 BTC Intraday Market Update
BTC monthly-timeframe hidden divergence; on the weekly timeframe, guard against a downward move to erase the wick; the 3-day timeframe opened high, and MACD is about to form a death cross
The 2-day timeframe is primarily undergoing a high-level correction; the downside hidden divergence on the daily/12-hour timeframes is confirmed; bottom fractals have formed on the 4/6/8-hour timeframes, and MACD is bottoming below zero
Keep a close eye on the 15/30-minute timeframes for high-level short setups intraday; current resistance above is at 84427-84470
Major resista
post-image
BTC+0.80%
$FIL This shitcoin follows a very predictable pattern! Every time it gets pumped, it pulls back because it previously trapped over a billion retail investors. Short the rebound and you can make a profit—take profit at $1! ‌
post-image
FIL+8.75%
I really fucking am a trading genius; maybe the only thing I lack is capital!
post-image
Layout: Bitcoin, Ethereum, Dogecoin
live-cover
LIVE880
  • 3
$NEAR You should definitely hold on to good coins—they've already multiplied several times by now, and they're the ones that really make money
NEAR+9.82%
Load More

Join 40 M users in our growing community

⚡️ Join 40 M users in the crypto craze discussion

💬 Engage with your favorite top creators

👍 See what interests you

Trending Topics

GateAtTOKEN2049

41.64k Views21.91k Discussing

Gate brought a series of major events to TOKEN2049 Singapore! From the official launch of Gate Money to the F1 Red Bull driver meet-and-greet and the Gate Gala, we witnessed a new chapter of "One Gate, Borderless Finance." Which moment from TOKEN2049 stood out most to you?

LedgerLossesNear90Million

39.61k Views315 Discussing

GateWCTCS9GlobalTradingCompetition

34.74k Views5.21k Discussing

View More