The article "MOVE vs XLM: Comparing Two Innovative Blockchain Programming Languages" delivers an in-depth analysis aimed at investors by comparing the investment value of Movement Network (MOVE) and Stellar (XLM). It explores historical price trends, supply mechanisms, institutional adoption, technological ecosystems, and macroeconomic factors influencing both tokens. This comparison helps investors determine which token might be a better buy, offering strategies for long- and short-term investments alongside potential risks. Suitable for both novice and experienced investors, the article guides portfolio allocation between MOVE and XLM while emphasizing current market conditions and detailed price predictions.
Introduction: MOVE vs XLM Investment Comparison
In the cryptocurrency market, Movement Network (MOVE) vs Stellar (XLM) comparison has been an unavoidable topic for investors. The two not only show significant differences in market cap ranking, application scenarios, and price performance, but also represent different positioning in crypto assets.
Stellar (XLM): Since its launch in 2014, it has gained market recognition for its efficiency in cross-border payments.
Movement Network (MOVE): Introduced in 2024, it has been recognized for bridging the gap between Move and EVM ecosystems.
This article will comprehensively analyze the investment value comparison between MOVE and XLM, focusing on historical price trends, supply mechanisms, institutional adoption, technological ecosystems, and future predictions, attempting to answer the question investors care about most:
"Which is the better buy right now?"
I. Price History Comparison and Current Market Status
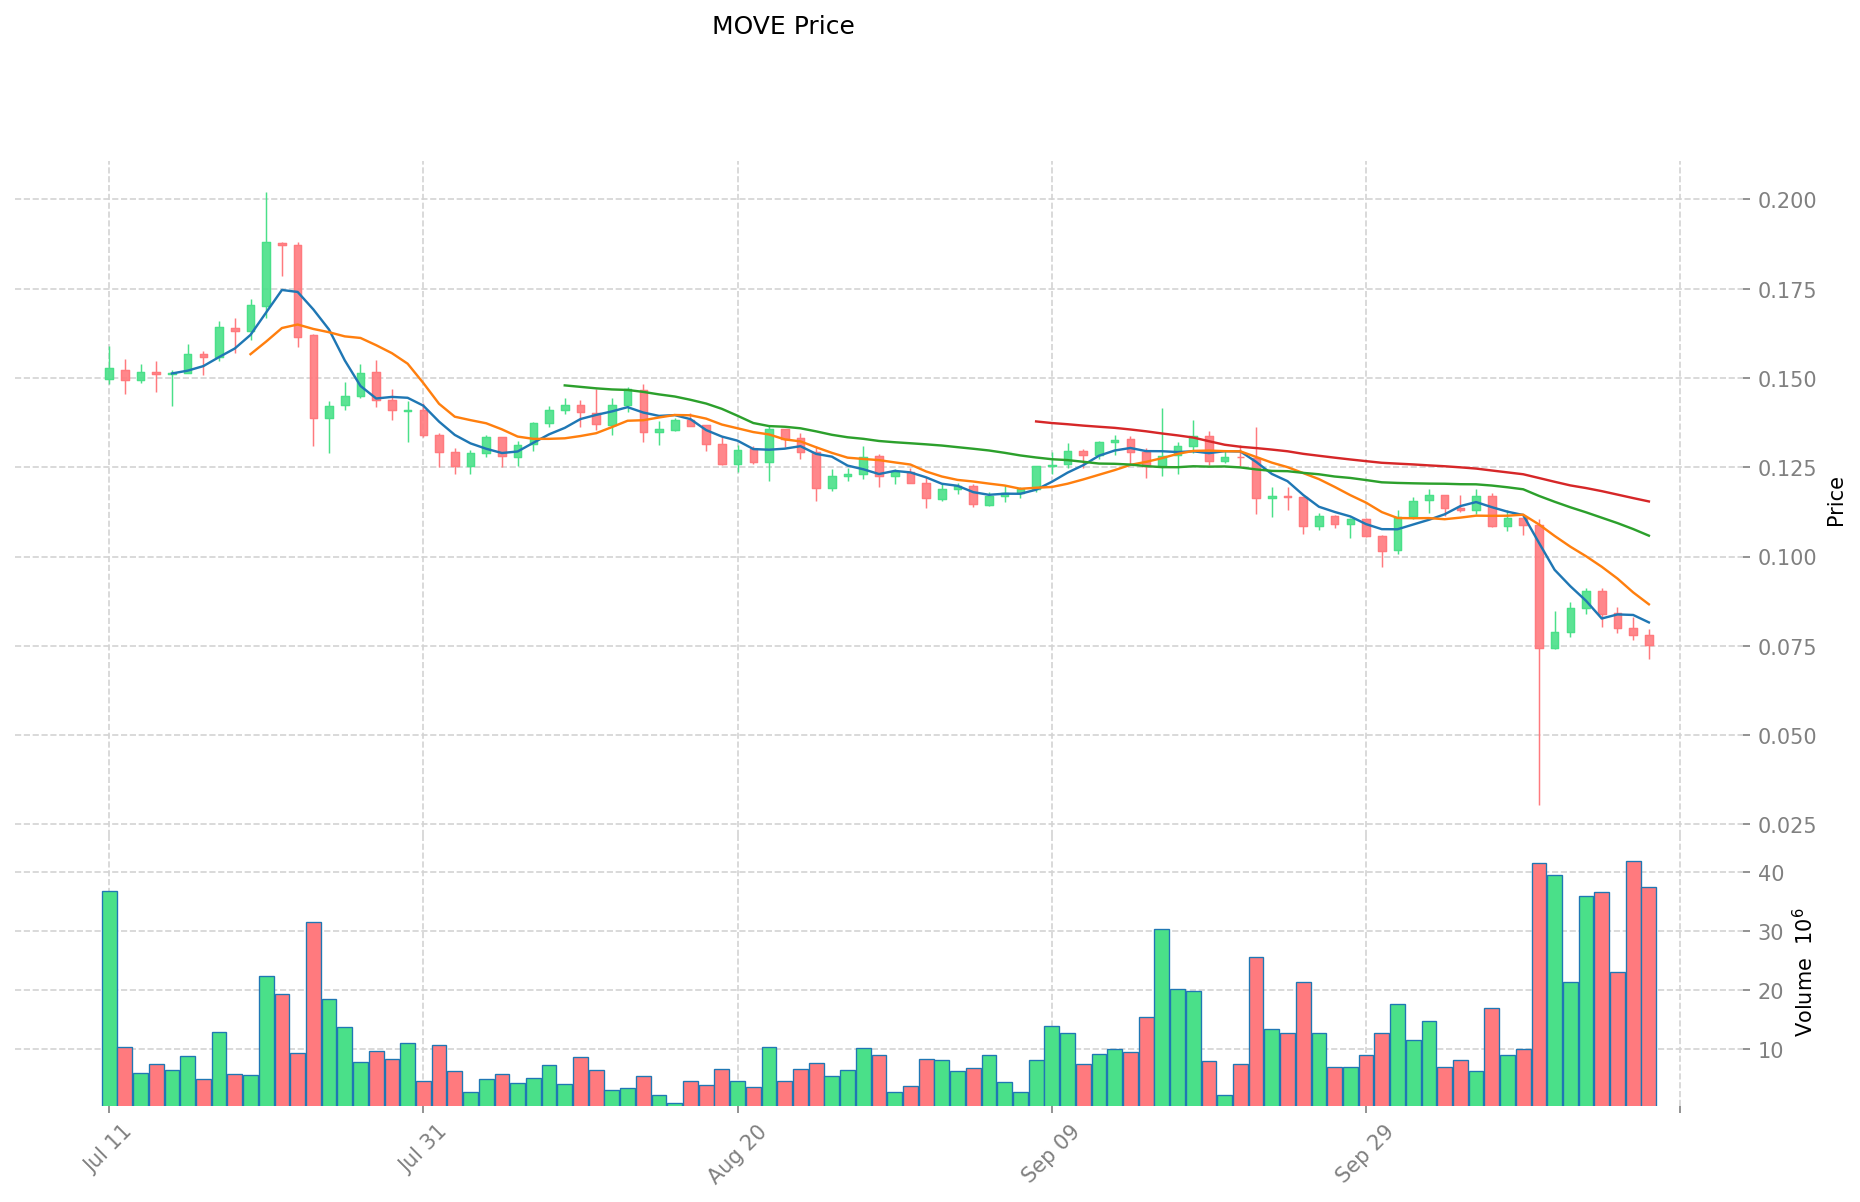
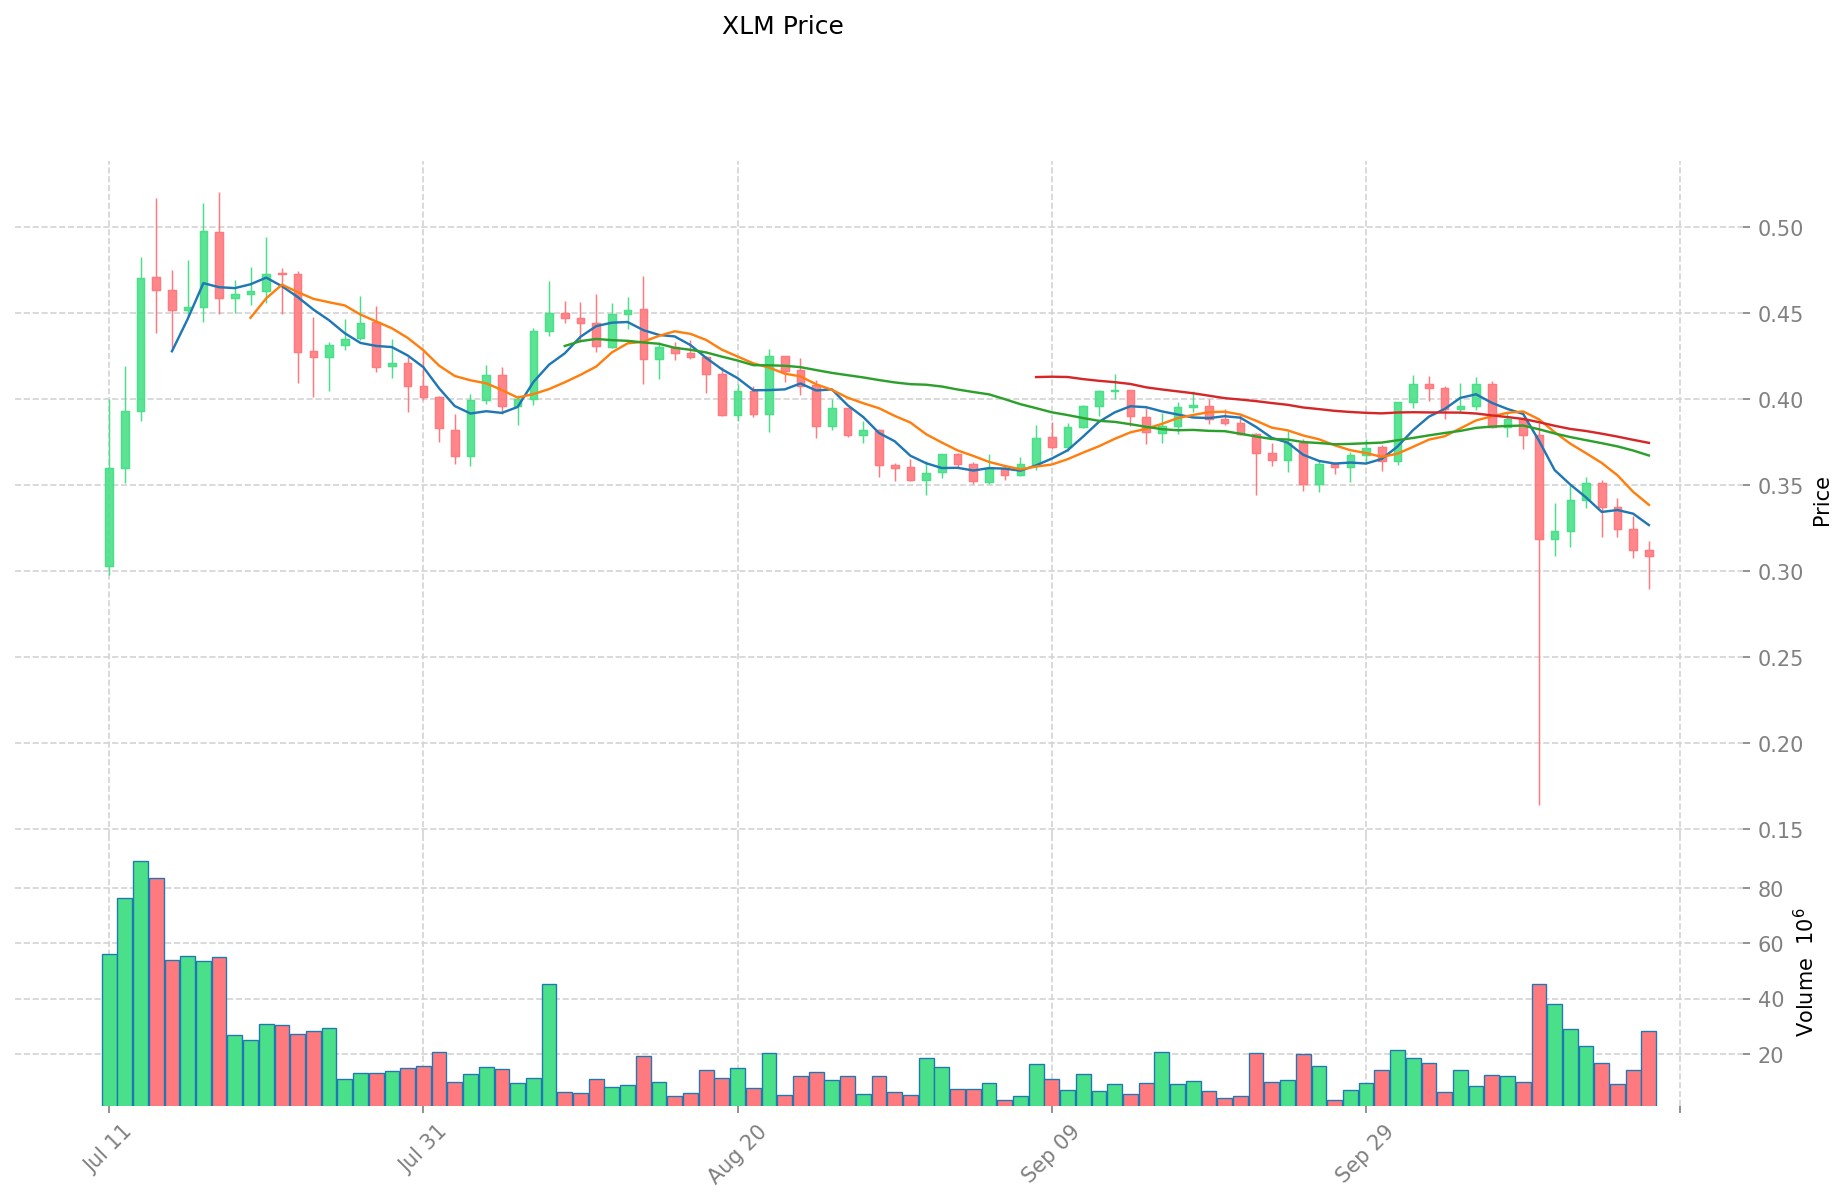
MOVE (Coin A) and XLM (Coin B) Historical Price Trends
- 2024: MOVE reached its all-time high of $1.34 on December 9, 2024.
- 2018: XLM reached its all-time high of $0.875563 on January 3, 2018.
- Comparative analysis: In the recent market cycle, MOVE dropped from its high of $1.34 to a low of $0.03033, while XLM has shown more stability, currently trading at $0.30965.
Current Market Situation (2025-10-18)
- MOVE current price: $0.0749
- XLM current price: $0.30965
- 24-hour trading volume: $2,794,122.81 (MOVE) vs $8,672,445.04 (XLM)
- Market Sentiment Index (Fear & Greed Index): 23 (Extreme Fear)
Click to view real-time prices:
- View MOVE current price Market Price
- View XLM current price Market Price
II. Core Factors Affecting the Investment Value of MOVE vs XLM
Supply Mechanisms Comparison (Tokenomics)
- MOVE: Fixed supply mechanism with a total cap of 10 billion tokens; 40% allocated to ecosystem and development
- XLM: Initial fixed supply of 100 billion tokens with annual 1% inflation until 2024 when the community voted to disable inflation
- 📌 Historical pattern: Fixed cap tokens like MOVE typically show greater price volatility during bull markets, while XLM's former inflation model provided stability at the cost of potential price appreciation
Institutional Adoption and Market Applications
- Institutional holdings: XLM has stronger institutional backing with organizations like IBM and Deloitte as partners; MOVE has limited institutional presence as a newer token
- Enterprise adoption: XLM has established partnerships in cross-border payments through the Stellar network, while MOVE focuses on mobile payment applications and gaming through the Move ecosystem
- Regulatory attitudes: XLM benefits from Stellar Development Foundation's proactive regulatory approach across jurisdictions; MOVE faces variable regulatory clarity depending on jurisdiction
Technical Development and Ecosystem Building
- MOVE technical upgrades: Integration of Move VM enabling safer smart contracts with formal verification
- XLM technical development: Soroban smart contracts platform launch enhancing Stellar's programmability beyond simple payments
- Ecosystem comparison: XLM has a more mature ecosystem for cross-border payments and remittances; MOVE is developing strengths in gaming applications and Web3 mobile payment solutions
Macroeconomic Factors and Market Cycles
- Inflation environment performance: XLM has historically shown lower correlation with inflation metrics than most cryptocurrencies
- Macroeconomic monetary policy: Both tokens show sensitivity to interest rate changes and dollar strength, with XLM demonstrating slightly more stability during market downturns
- Geopolitical factors: XLM's focus on cross-border payments positions it to benefit from increased global remittance demand; MOVE's exposure depends on adoption of its underlying technological applications
III. Price Prediction for 2025-2030: MOVE vs XLM
Short-term Prediction (2025)
- MOVE: Conservative $0.0500 - $0.0747 | Optimistic $0.0747 - $0.0919
- XLM: Conservative $0.2821 - $0.3100 | Optimistic $0.3100 - $0.4495
Mid-term Prediction (2027)
- MOVE may enter a growth phase, with expected prices of $0.0814 - $0.1264
- XLM may enter a bullish market, with expected prices of $0.3782 - $0.5742
- Key drivers: Institutional investment inflows, ETF developments, ecosystem growth
Long-term Prediction (2030)
- MOVE: Base scenario $0.1134 - $0.1260 | Optimistic scenario $0.1260 - $0.1562
- XLM: Base scenario $0.3926 - $0.6768 | Optimistic scenario $0.6768 - $0.8190
View detailed price predictions for MOVE and XLM
Disclaimer: These predictions are based on historical data and market analysis. Cryptocurrency markets are highly volatile and subject to change. This information should not be considered as financial advice. Always conduct your own research before making investment decisions.
MOVE:
| 年份 |
预测最高价 |
预测平均价格 |
预测最低价 |
涨跌幅 |
| 2025 |
0.0918687 |
0.07469 |
0.0500423 |
0 |
| 2026 |
0.108263155 |
0.08327935 |
0.04996761 |
11 |
| 2027 |
0.1264180533 |
0.0957712525 |
0.081405564625 |
27 |
| 2028 |
0.12220411819 |
0.1110946529 |
0.091097615378 |
48 |
| 2029 |
0.1353132872322 |
0.116649385545 |
0.0839875575924 |
55 |
| 2030 |
0.156216857121864 |
0.1259813363886 |
0.11338320274974 |
68 |
XLM:
| 年份 |
预测最高价 |
预测平均价格 |
预测最低价 |
涨跌幅 |
| 2025 |
0.4495 |
0.31 |
0.2821 |
0 |
| 2026 |
0.53165 |
0.37975 |
0.21266 |
22 |
| 2027 |
0.574182 |
0.4557 |
0.378231 |
47 |
| 2028 |
0.76211268 |
0.514941 |
0.31411401 |
66 |
| 2029 |
0.7151500608 |
0.63852684 |
0.4597393248 |
106 |
| 2030 |
0.818974524984 |
0.6768384504 |
0.392566301232 |
118 |
IV. Investment Strategy Comparison: MOVE vs XLM
Long-term vs Short-term Investment Strategies
- MOVE: Suitable for investors focused on gaming applications and Web3 mobile payment solutions
- XLM: Suitable for investors seeking stability and exposure to cross-border payment solutions
Risk Management and Asset Allocation
- Conservative investors: MOVE: 20% vs XLM: 80%
- Aggressive investors: MOVE: 60% vs XLM: 40%
- Hedging tools: Stablecoin allocation, options, cross-currency portfolio
V. Potential Risk Comparison
Market Risks
- MOVE: Higher volatility due to lower market cap and trading volume
- XLM: Potential market saturation in the cross-border payment sector
Technical Risks
- MOVE: Scalability, network stability
- XLM: Centralization concerns, potential security vulnerabilities in smart contract implementation
Regulatory Risks
- Global regulatory policies may have differing impacts on both tokens, with XLM potentially facing less scrutiny due to its established presence and regulatory compliance efforts
VI. Conclusion: Which Is the Better Buy?
📌 Investment Value Summary:
- MOVE advantages: Strong potential in gaming and Web3 mobile payments, fixed supply cap
- XLM advantages: Established cross-border payment network, institutional partnerships, relative price stability
✅ Investment Advice:
- Novice investors: Consider a higher allocation to XLM for stability
- Experienced investors: Balanced portfolio with both MOVE and XLM, adjusting based on risk tolerance
- Institutional investors: Focus on XLM for its established network and partnerships, with a smaller allocation to MOVE for exposure to emerging technologies
⚠️ Risk Warning: The cryptocurrency market is highly volatile. This article does not constitute investment advice.
None
VII. FAQ
Q1: What are the main differences between MOVE and XLM in terms of supply mechanisms?
A: MOVE has a fixed supply cap of 10 billion tokens, with 40% allocated to ecosystem and development. XLM initially had a fixed supply of 100 billion tokens with annual 1% inflation until 2024 when inflation was disabled by community vote.
Q2: How do MOVE and XLM compare in terms of institutional adoption?
A: XLM has stronger institutional backing with partnerships from organizations like IBM and Deloitte. MOVE, being a newer token, has limited institutional presence.
Q3: What are the key technical developments for MOVE and XLM?
A: MOVE has integrated Move VM for safer smart contracts with formal verification. XLM has launched the Soroban smart contracts platform, enhancing Stellar's programmability beyond simple payments.
Q4: How do the short-term price predictions for 2025 compare between MOVE and XLM?
A: For MOVE, the conservative estimate is $0.0500 - $0.0747, and the optimistic estimate is $0.0747 - $0.0919. For XLM, the conservative estimate is $0.2821 - $0.3100, and the optimistic estimate is $0.3100 - $0.4495.
Q5: What are the main risk factors for investing in MOVE and XLM?
A: MOVE faces higher volatility due to lower market cap and trading volume, as well as potential scalability and network stability issues. XLM risks include potential market saturation in the cross-border payment sector and centralization concerns.
Q6: How should investors allocate their portfolio between MOVE and XLM based on risk tolerance?
A: Conservative investors might consider allocating 20% to MOVE and 80% to XLM, while aggressive investors might opt for 60% MOVE and 40% XLM.
Q7: Which token is better suited for different types of investors?
A: Novice investors may prefer a higher allocation to XLM for stability. Experienced investors might consider a balanced portfolio of both MOVE and XLM. Institutional investors may focus on XLM for its established network and partnerships, with a smaller allocation to MOVE for exposure to emerging technologies.
* The information is not intended to be and does not constitute financial advice or any other recommendation of any sort offered or endorsed by Gate.