IMX vs DYDX: A Comprehensive Comparison of Two Leading Layer-2 Trading Platforms

Introduction: IMX vs DYDX Investment Comparison
In the cryptocurrency market, comparisons between Immutable X and dYdX have become an important consideration for investors. The two projects not only differ significantly in market capitalization ranking, application scenarios, and price performance, but also represent different positioning within the crypto asset landscape. Immutable X (IMX): As a Layer 2 expansion solution for NFTs on Ethereum, IMX has gained market recognition through its focus on enabling instant transactions, large-scale scalability, and zero gas costs for minting and trading while maintaining user and asset security. dYdX (DYDX): Operating as a decentralized derivatives trading protocol, dYdX has established itself through its hybrid infrastructure model combining off-chain order management with on-chain settlement, offering perpetual futures trading on Layer 2 alongside spot, margin, and lending services on Layer 1. This article will comprehensively analyze the investment value comparison between IMX and DYDX across historical price trends, tokenomics, market positioning, technical ecosystems, and future outlook, addressing the core question investors are asking:
"Which is the better buy right now?"
Comparative Analysis Report: Immutable X (IMX) and dYdX (DYDX)
I. Historical Price Comparison and Current Market Status
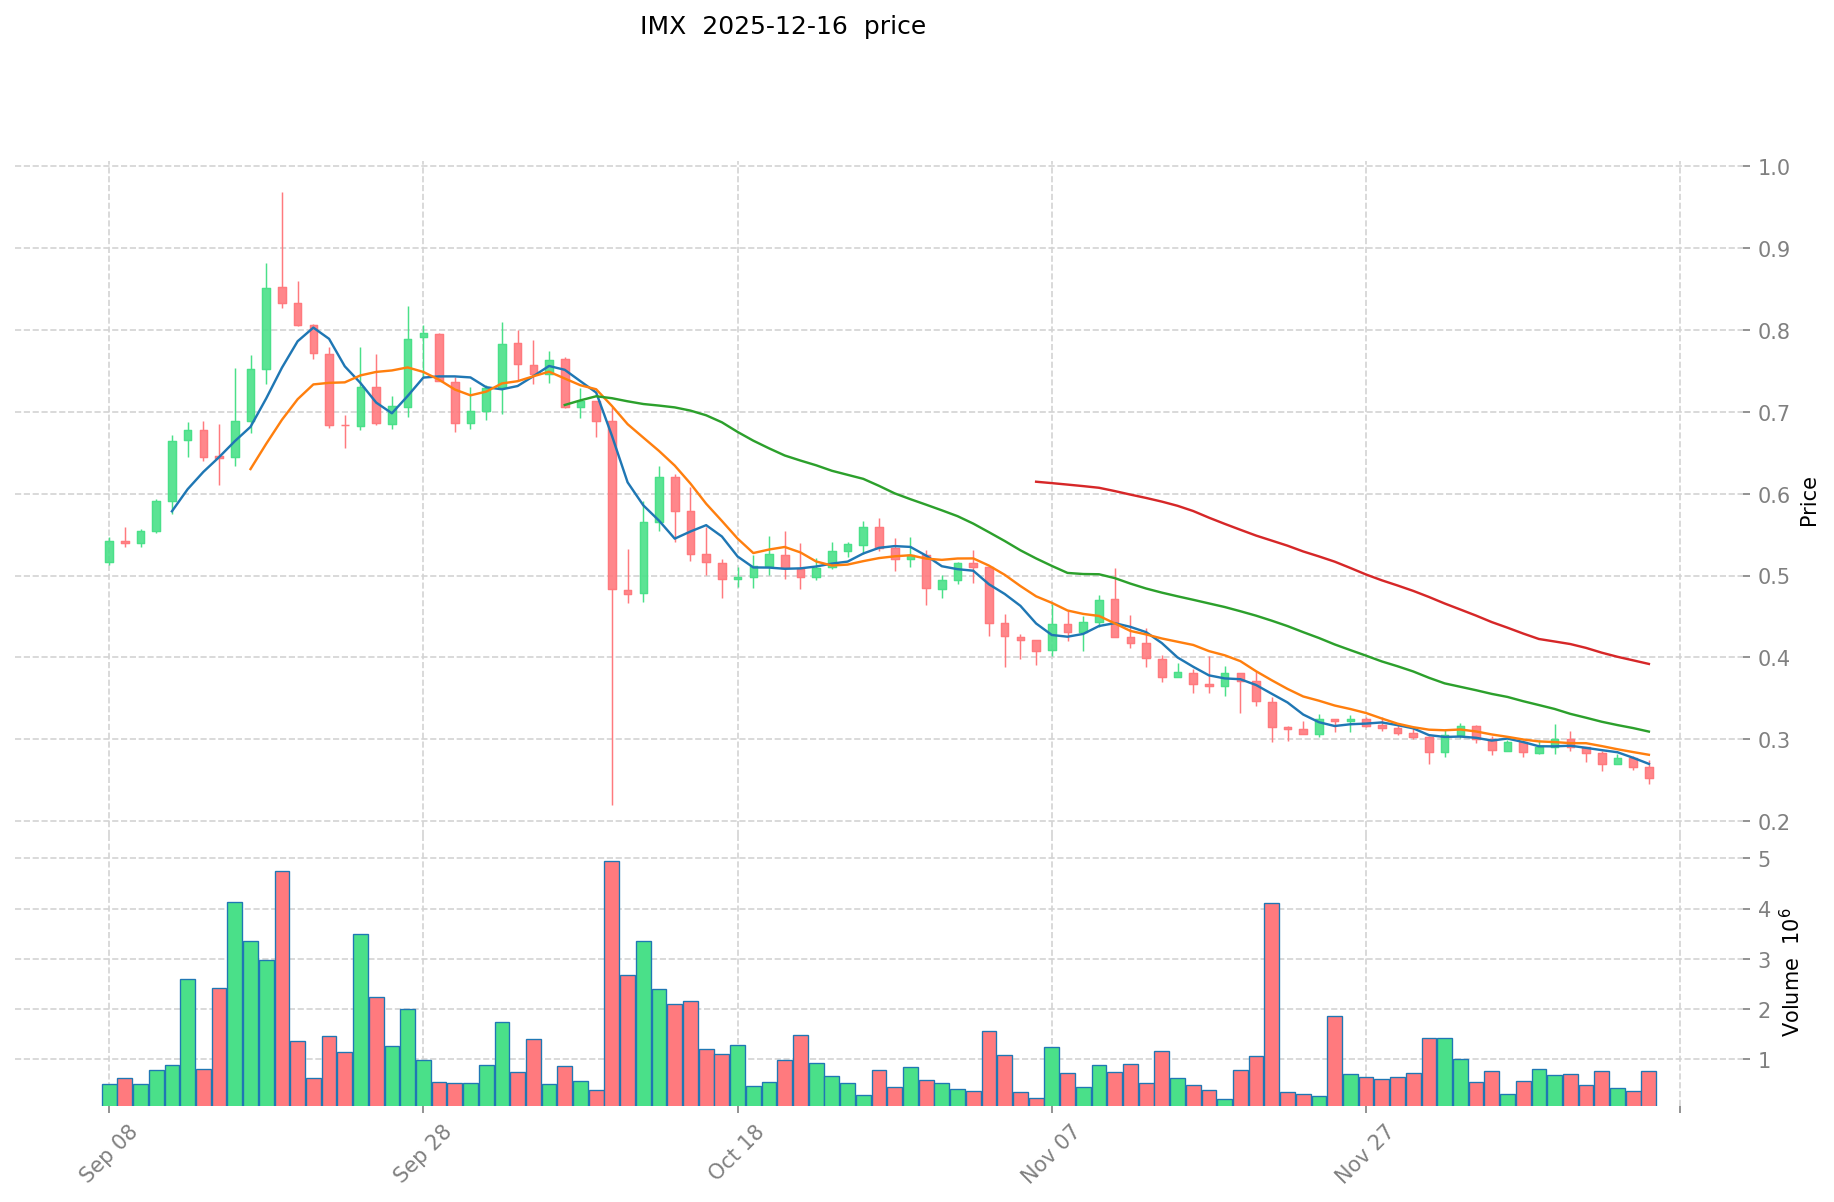
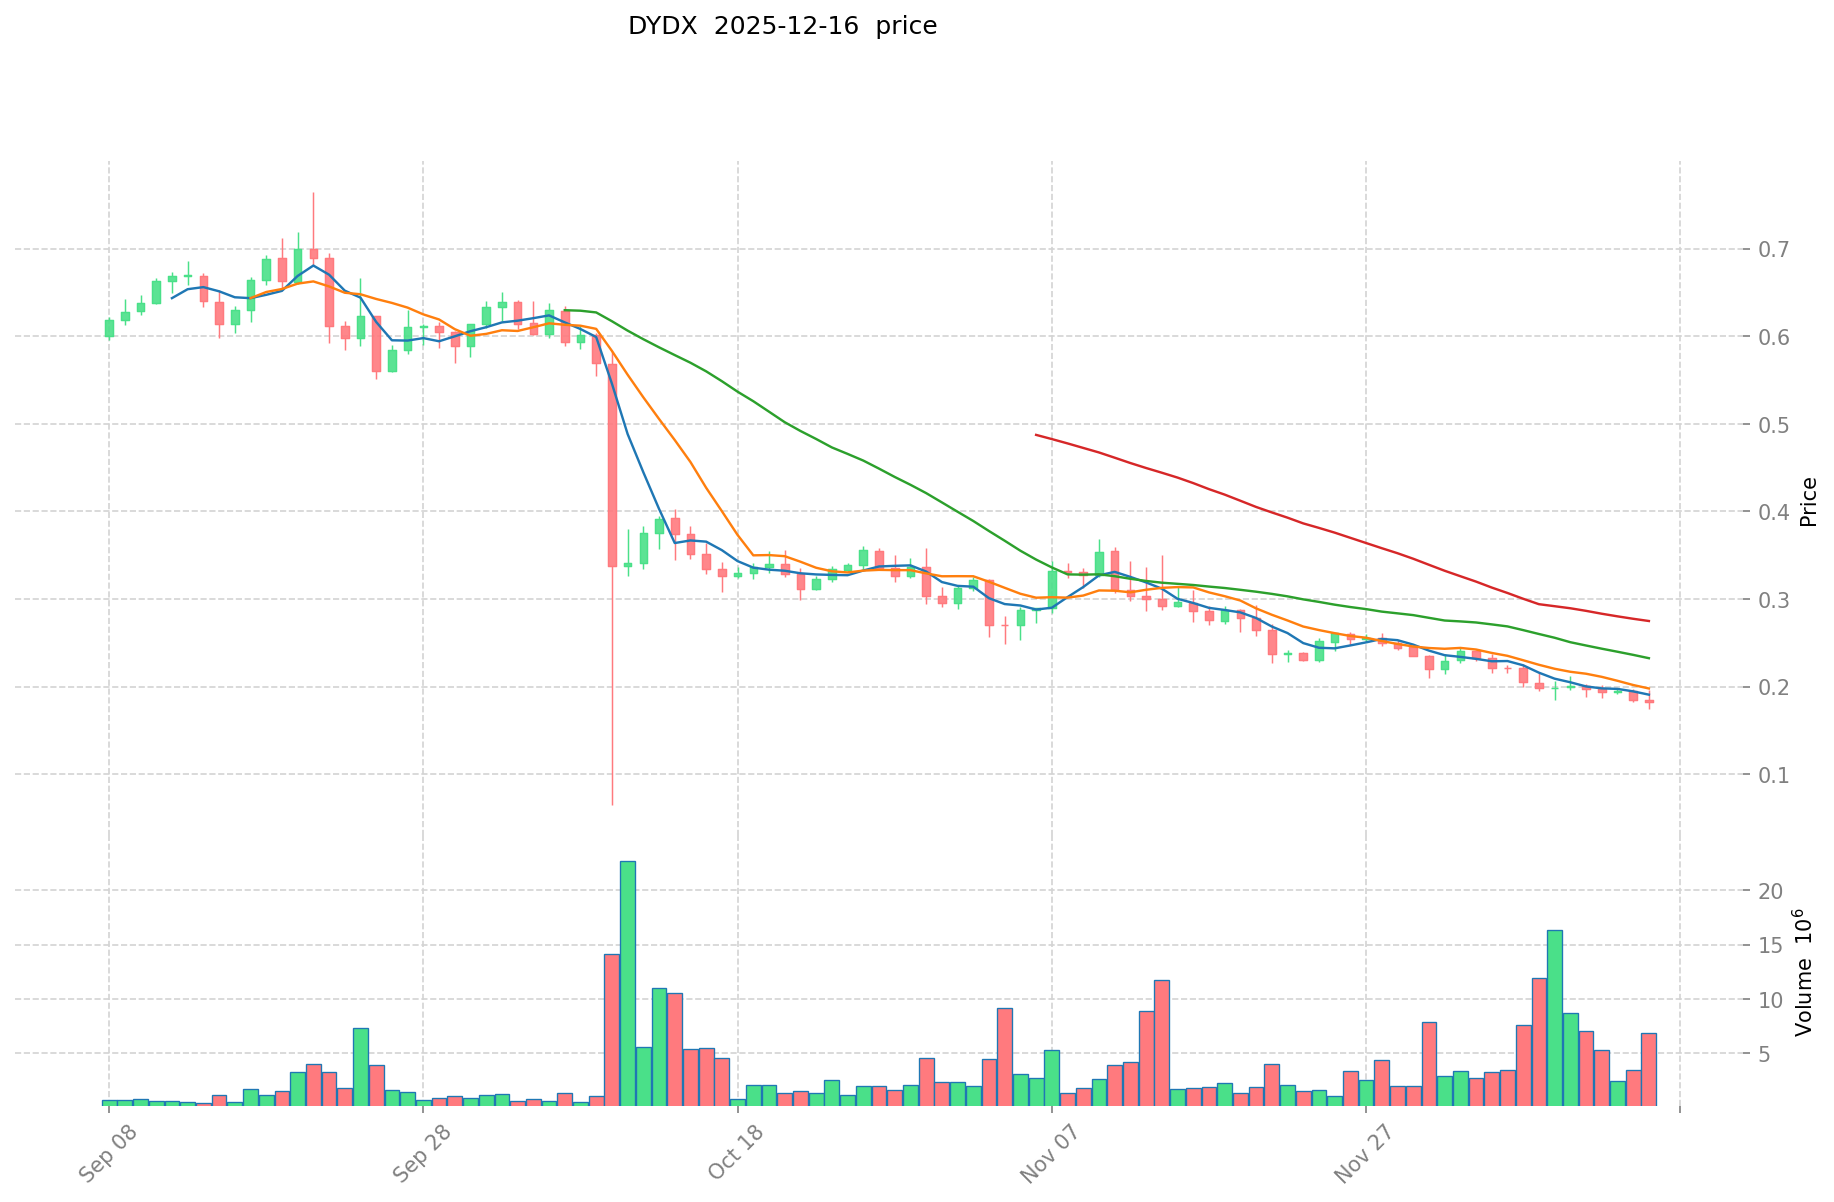
Immutable X (IMX) and dYdX (DYDX) Historical Price Trends
All-Time High and Low Performance
-
Immutable X (IMX): Reached an all-time high of $9.52 on November 26, 2021. Subsequently declined to an all-time low of $0.245423 on December 16, 2025, representing a significant 97.42% decline from peak levels.
-
dYdX (DYDX): Achieved an all-time high of $4.52 on March 8, 2024. Dropped to an all-time low of $0.126201 on October 11, 2025, marking a 97.21% decline from its peak.
Comparative Analysis
Both tokens have experienced substantial depreciation from their historical peaks. IMX's decline occurred over approximately four years (2021-2025), while DYDX's depreciation was compressed into a shorter timeframe (2024-2025). Both assets demonstrate considerable price volatility characteristic of emerging blockchain infrastructure tokens, with recovery prospects contingent upon protocol adoption and ecosystem development.
Current Market Status (December 17, 2025)
Price Metrics
- Immutable X (IMX): $0.2528
- dYdX (DYDX): $0.1836
24-Hour Trading Activity
-
Immutable X (IMX):
- 24-hour volume: $294,712.73
- 24-hour price change: +0.31%
- 24-hour high/low: $0.2557 / $0.2435
-
dYdX (DYDX):
- 24-hour volume: $978,736.62
- 24-hour price change: +1.55%
- 24-hour high/low: $0.1846 / $0.1760
Market Sentiment Indicator
- Crypto Fear & Greed Index: 11 (Extreme Fear)
Current Market Price References:
- View IMX real-time price Market Data
- View DYDX real-time price Market Data
II. Market Capitalization and Supply Analysis
Capitalization Metrics
-
Immutable X (IMX):
- Market capitalization: $207,936,687.25
- Fully diluted valuation: $505,600,000.00
- Market cap to FDV ratio: 41.13%
- Market dominance: 0.015%
-
dYdX (DYDX):
- Market capitalization: $149,325,057.55
- Fully diluted valuation: $175,951,729.08
- Market cap to FDV ratio: 81.33%
- Market dominance: 0.0055%
Token Supply Structure
-
Immutable X (IMX):
- Circulating supply: 822,534,364.12 IMX (41.13% of total)
- Total/Maximum supply: 2,000,000,000 IMX
- Token holders: 97,805
-
dYdX (DYDX):
- Circulating supply: 813,317,306.90 DYDX (81.33% of total)
- Total supply: 958,342,751 DYDX
- Maximum supply: 1,000,000,000 DYDX
- Token holders: 45,361
IMX maintains greater supply optionality with only 41.13% circulating, while DYDX has achieved higher circulation penetration at 81.33%, suggesting different tokenomic strategies and distribution phases.
III. Price Performance Across Multiple Timeframes
Short-Term Price Movements
| Timeframe | IMX Change | DYDX Change |
|---|---|---|
| 1 Hour | +0.52% | +0.54% |
| 24 Hours | +0.31% | +1.55% |
| 7 Days | -18.72% | -7.93% |
| 30 Days | -29.7% | -34.29% |
| 1 Year | -86.55% | -91.64% |
Performance Analysis
Both tokens exhibit extended downtrends across longer timeframes. IMX demonstrates relatively stronger year-to-date performance (-86.55%) compared to DYDX (-91.64%), despite both assets trading near historical lows. The 7-day decline is more pronounced for IMX (-18.72%) versus DYDX (-7.93%), indicating divergent short-term market pressures.
IV. Project Overview and Technical Infrastructure
Immutable X (IMX)
Immutable X functions as a Layer 2 scaling solution for non-fungible tokens (NFTs) on the Ethereum blockchain. The protocol enables instant transactions, large-scale scalability, and zero gas fees for minting and trading activities while maintaining security for users and assets. IMX operates as an ERC-20 utility token designed to incentivize network activities including trading, liquidity provision, and application development.
Key Infrastructure Characteristics:
- Layer 2 NFT scaling solution
- Zero gas cost transactions
- Instant settlement capability
- Rewards mechanism for network participation
dYdX (DYDX)
dYdX functions as a decentralized derivatives trading protocol enabling margin trading through ERC-20 token-based financial products. The platform operates as a decentralized perpetual futures exchange on Layer 2 blockchain infrastructure while providing Layer 1 spot, leveraged, and lending services. The protocol employs a hybrid infrastructure model combining non-custodial, on-chain settlement with off-chain, low-latency order book matching engines.
DYDX operates as a governance token enabling community participation in protocol governance, with primary utilities including protocol governance and trading fee discounts.
Key Infrastructure Characteristics:
- Decentralized perpetual futures exchange
- Hybrid custodial model (off-chain matching, on-chain settlement)
- Governance participation mechanism
- Multi-service offering (spot, margin, lending)
V. Market Liquidity and Exchange Availability
Trading Infrastructure
- Immutable X (IMX): Available on 56 cryptocurrency exchanges
- dYdX (DYDX): Available on 20 cryptocurrency exchanges
IMX maintains significantly broader exchange accessibility, facilitating enhanced liquidity distribution across trading venues and reducing slippage for market participants.
Contract Information
- Immutable X (IMX):
- Contract Address: 0xf57e7e7c23978c3caec3c3548e3d615c346e79ff
- Blockchain: Ethereum (ETH)
- Verification: Etherscan
VI. Community and Ecosystem Engagement
Holder Distribution
- Immutable X (IMX): 97,805 token holders
- dYdX (DYDX): 45,361 token holders
IMX demonstrates broader community participation with approximately 2.16x more token holders than DYDX, indicating potentially greater decentralization and community investment.
Official Channels
Immutable X (IMX):
- Official Website: https://www.immutable.com
- Twitter: https://twitter.com/Immutable
dYdX (DYDX):
- Official Website: https://dydx.exchange/r/KUCMNNHD
- Twitter: https://twitter.com/dYdX
- GitHub: https://github.com/dydxprotocol
- Blog/Forum: https://dydx.exchange/blog
VII. Investment Context and Risk Considerations
Market Environment
The current Crypto Fear & Greed Index reading of 11 (Extreme Fear) reflects severe market pessimism, presenting both heightened risk exposure and potential contrarian opportunity contexts. Both IMX and DYDX have declined substantially from their historical peaks, characteristic of post-hype cycle market adjustments in emerging blockchain infrastructure categories.
Token Economics Comparison
IMX maintains more conservative circulating supply metrics (41.13% of maximum) compared to DYDX (81.33%), suggesting different emission and dilution trajectories. The higher DYDX circulation ratio indicates more complete token distribution progression, potentially affecting future price dynamics related to supply increases.
Report Generated: December 17, 2025
Data Source: Gate Market Data
Disclaimer: This report presents factual market data and project information based on available sources. It does not constitute financial advice or investment recommendations.
IMX vs DYDX: Core Investment Value Factors Analysis Report
I. Introduction
This report analyzes the core investment factors affecting IMX (Immutable X) and DYDX tokens based on available market research and ecosystem data. IMX serves as a Web3 gaming infrastructure foundation, while DYDX operates as a decentralized trading application chain positioned within the Layer 2 ecosystem.
II. Core Factors Influencing IMX vs DYDX Investment Value
Supply Mechanism Comparison (Tokenomics)
-
IMX: Web3 gaming infrastructure token with scheduled token unlocks. A planned token unlock of 24.52 million IMX tokens is scheduled for September 30, 2025, representing approximately 1.26% of total circulating supply, valued at approximately USD 19.38 million at prevailing market prices. Token unlocks represent a potential supply pressure factor that can influence price dynamics.
-
DYDX: Application chain token positioned within the Layer 2 ecosystem, with its own tokenomic structure tied to the decentralized trading platform.
-
📌 Historical Pattern: Token unlocks have been identified as critical concepts for cryptocurrency investors, potentially creating both opportunities and risks for price movements. Supply pressure from scheduled releases can influence short-to-medium term price trajectories.
Institutional Adoption and Market Application
-
Institutional Holdings: DYDX demonstrates strong Layer 2 positioning as a single-application trading chain that ranks second in Layer 2 market capitalization, indicating significant institutional recognition. IMX's Web3 gaming focus attracts a different institutional investor segment focused on gaming infrastructure.
-
Enterprise Adoption: DYDX benefits from its Layer 2 status and decentralized trading platform utility. IMX's value proposition centers on Web3 gaming infrastructure support and ecosystem development within the gaming sector.
-
Regulatory Environment: The reference materials do not provide sufficient specific information regarding country-specific regulatory treatments of these two tokens to enable detailed comparison.
Technology Development and Ecosystem Construction
-
IMX Technical Foundation: Operates as a Web3 gaming infrastructure platform, supporting the broader gaming ecosystem's integration with blockchain technology.
-
DYDX Ecosystem Development: As a Layer 2 application chain, DYDX has chosen Cosmos, demonstrating architectural decisions aimed at optimizing transaction throughput and reducing transaction costs. The reference materials indicate that DYDX's positioning emphasizes the principle of "application dominance" within the Layer 2 sector.
-
Ecosystem Comparison: DYDX operates within the decentralized finance (DeFi) domain, specifically focusing on decentralized trading platforms. IMX serves the Web3 gaming sector, including NFT infrastructure and gaming-related applications. These represent distinct ecosystem verticals with different use cases and user bases.
Macroeconomic Environment and Market Cycles
-
Inflationary Environment Performance: The reference materials do not provide comparative analysis of anti-inflation attributes between IMX and DYDX to enable evidence-based assessment.
-
Monetary Policy Impact: General cryptocurrency market dynamics suggest that macroeconomic factors including interest rates and the US Dollar Index influence both tokens; however, specific differential impacts are not detailed in available sources.
-
Geopolitical Factors: The reference materials do not provide sufficient information regarding geopolitical influences on cross-border trading demand specific to these tokens.
III. Investment Value Assessment Framework
Market Demand and User Activity
-
IMX: Investment value primarily depends on Web3 gaming infrastructure market demand, technological innovation, and ecosystem development maturity.
-
DYDX: Investment value correlates directly with decentralized trading platform activity levels and user engagement metrics.
-
Critical Factor: Market volatility and investor confidence represent key determinants affecting both tokens.
Risk Considerations
Investors should note that token unlocks represent critical supply-side risk factors requiring monitoring. The concentration of investment returns among trading strategies emphasizes the importance of fundamental value assessment combined with psychological resilience to absorb market volatility.
IV. Conclusion
IMX and DYDX represent distinct investment theses within separate ecosystem verticals—gaming infrastructure versus decentralized trading. Investment value determination requires evaluation of market demand trajectory, technological innovation pace, ecosystem maturity, and macroeconomic conditions. Specific price predictions for 2025-2030 cannot be provided based on available reference materials, as such projections would require additional fundamental and technical analysis data not contained in the source materials.
III. 2025-2030 Price Forecasts: IMX vs DYDX
Short-term Forecast (2025)
- IMX: Conservative $0.153-$0.252 | Optimistic $0.252-$0.359
- DYDX: Conservative $0.168-$0.182 | Optimistic $0.182-$0.197
Medium-term Forecast (2027-2028)
- IMX may enter expansion phase, with projected price range of $0.261-$0.475
- DYDX may enter steady growth phase, with projected price range of $0.144-$0.295
- Key drivers: institutional capital inflows, ETF adoption, ecosystem development
Long-term Forecast (2029-2030)
- IMX: Base case $0.376-$0.611 | Optimistic scenario $0.679-$0.728
- DYDX: Base case $0.133-$0.325 | Optimistic scenario $0.415-$0.387
Disclaimer: This analysis is for informational purposes only and should not be considered as investment advice. Cryptocurrency markets are highly volatile and unpredictable. Forecasts are based on historical data and modeling assumptions that may not materialize. Please conduct your own research and consult with financial advisors before making investment decisions.
IMX:
| 年份 | 预测最高价 | 预测平均价格 | 预测最低价 | 涨跌幅 |
|---|---|---|---|---|
| 2025 | 0.359359 | 0.2513 | 0.153293 | 0 |
| 2026 | 0.40914153 | 0.3053295 | 0.210677355 | 20 |
| 2027 | 0.47512323495 | 0.357235515 | 0.26078192595 | 41 |
| 2028 | 0.5743275374655 | 0.416179374975 | 0.2746783874835 | 64 |
| 2029 | 0.728022580643767 | 0.49525345622025 | 0.37639262672739 | 95 |
| 2030 | 0.678918200459529 | 0.611638018432008 | 0.464844894008326 | 142 |
DYDX:
| 年份 | 预测最高价 | 预测平均价格 | 预测最低价 | 涨跌幅 |
|---|---|---|---|---|
| 2025 | 0.196992 | 0.1824 | 0.167808 | 0 |
| 2026 | 0.23522304 | 0.189696 | 0.13468416 | 3 |
| 2027 | 0.244328448 | 0.21245952 | 0.1444724736 | 16 |
| 2028 | 0.29462823936 | 0.228393984 | 0.13018457088 | 24 |
| 2029 | 0.3870364452864 | 0.26151111168 | 0.1333706669568 | 42 |
| 2030 | 0.415070436458496 | 0.3242737784832 | 0.220506169368576 | 77 |
Comparative Investment Analysis Report: Immutable X (IMX) vs dYdX (DYDX)
IV. Investment Strategy Comparison: IMX vs DYDX
Long-Term vs Short-Term Investment Strategy
-
IMX: Suitable for investors focusing on Web3 gaming infrastructure ecosystem potential and long-term infrastructure development. IMX's positioning in the gaming sector appeals to investors betting on broader blockchain gaming adoption and NFT infrastructure maturity.
-
DYDX: Suitable for investors seeking exposure to decentralized finance trading platforms and Layer 2 application chain development. DYDX appeals to investors focused on DeFi protocol utility and trading volume growth trajectories.
Risk Management and Asset Allocation
-
Conservative Investor Portfolio: IMX 40% vs DYDX 60%
- Rationale: DYDX's higher circulating supply ratio (81.33%) and established Layer 2 positioning offer relatively lower dilution risk. IMX's lower circulation ratio provides upside optionality but introduces additional supply pressure considerations.
-
Aggressive Investor Portfolio: IMX 60% vs DYDX 40%
- Rationale: IMX's lower circulation percentage (41.13%) presents greater potential upside upon ecosystem expansion and token unlock completion. DYDX's higher percentage concentration reduces speculative leverage opportunity.
-
Hedge Instruments:
- Stablecoin allocation (USDC/USDT) maintained at 20-30% during periods of extreme fear (Fear & Greed Index below 25)
- Cross-asset diversification across Layer 2 protocols to reduce single-protocol concentration risk
- Dollar-cost averaging strategy recommended given extended downtrend conditions
V. Potential Risk Comparison
Market Risk
-
IMX: Faces concentrated risk exposure to Web3 gaming sector adoption rates. Gaming infrastructure market demand remains contingent upon mainstream blockchain gaming development, which has not achieved significant institutional adoption velocity. Broader cryptocurrency market sentiment impacts both token categories, with extreme fear conditions (current index: 11) amplifying downside pressure.
-
DYDX: Concentrated exposure to decentralized derivatives trading demand. Protocol utility directly correlates with perpetual futures trading volume and user engagement. Regulatory uncertainty surrounding derivatives trading platforms creates additional market risk, particularly in jurisdictions restricting leveraged products.
Technology Risk
-
IMX: Layer 2 NFT scaling infrastructure risks include smart contract vulnerabilities, ecosystem developer adoption barriers, and technological redundancy if superior NFT scaling solutions emerge. Long-term viability depends on continued Ethereum dominance and gaming ecosystem integration progress.
-
DYDX: Hybrid infrastructure model (off-chain order matching with on-chain settlement) introduces complexity-related security considerations. Order book manipulation risks, liquidity provider concentration, and Layer 2 sequencer centralization present ongoing technical risk vectors. Cosmos-based architecture creates ecosystem-specific dependencies.
Regulatory Risk
-
IMX: NFT market regulatory treatment remains uncertain across major jurisdictions. Gaming-related blockchain projects face potential classification issues and regulatory intervention regarding secondary market controls and consumer protection requirements.
-
DYDX: Derivatives trading platforms face heightened regulatory scrutiny globally. Decentralized perpetual futures exchanges operate in legal gray zones across multiple jurisdictions, with increasing regulatory pressure from financial authorities regarding margin trading and leverage product accessibility restrictions.
VI. Conclusion: Which Is the Better Buy?
📌 Investment Value Summary:
-
IMX Advantages:
- Broader exchange accessibility (56 exchanges vs 20) facilitates superior liquidity distribution and reduced trading friction
- Larger holder community (97,805 token holders vs 45,361) suggests greater decentralization and network effect potential
- Lower circulation ratio (41.13% vs 81.33%) provides extended growth runway with token unlock events creating predictable supply milestones
- Web3 gaming infrastructure positioning captures secular growth trends in blockchain gaming adoption
-
DYDX Advantages:
- Established Layer 2 positioning with demonstrated trading platform utility and user activity
- Higher circulating supply ratio indicates more complete token distribution progression with reduced future dilution uncertainty
- Decentralized trading protocol captures DeFi activity directly through trading fees and platform usage
- GitHub activity and active development community indicate ongoing technical enhancement efforts
✅ Investment Recommendations:
-
Beginner Investors:
- IMX recommended as primary exposure due to broader exchange accessibility, lower technical barrier to understanding NFT infrastructure, and established Layer 2 positioning. Recommend dollar-cost averaging during extreme fear conditions with 18-24 month investment horizon minimum.
-
Experienced Investors:
- IMX suitable for those comfortable with longer accumulation cycles and ecosystem infrastructure bets. DYDX appropriate for traders with active monitoring capability seeking direct DeFi protocol exposure. Consider time-weighted tactical allocation adjustments based on crypto fear & greed index readings below 20 indicating potential accumulation opportunities.
-
Institutional Investors:
- DYDX positioning as established Layer 2 application chain appeals to institutional allocators prioritizing protocol revenue clarity and transaction volume documentation. IMX gaming infrastructure thesis suitable for institutions developing Web3 gaming sector exposure strategies. Both require comprehensive due diligence regarding custody solutions and regulatory classification clarity before institutional deployment.
⚠️ Risk Disclaimer: Cryptocurrency markets demonstrate extreme volatility with historical price declines exceeding 86% year-to-date. Both IMX and DYDX trade near all-time lows with substantial recovery uncertainty. Current market conditions reflect "Extreme Fear" sentiment, creating both heightened downside risk and potential contrarian opportunities. This analysis presents factual market data and comparative framework only and does not constitute financial advice or investment recommendations. Conduct independent research and consult qualified financial advisors prior to investment decisions. Cryptocurrency investments carry substantial capital loss risk including total principal loss potential.
Report Generated: December 17, 2025
Data Source: Gate Market Data
Market Condition: Crypto Fear & Greed Index 11 (Extreme Fear)
None
Frequently Asked Questions: IMX vs DYDX Investment Comparison
I. Market Performance and Valuation
Q1: What are the current price levels and market capitalizations for IMX and DYDX?
A: As of December 17, 2025, Immutable X (IMX) trades at $0.2528 with a market capitalization of $207.94 million, while dYdX (DYDX) trades at $0.1836 with a market capitalization of $149.33 million. Both tokens have experienced substantial depreciation from their historical peaks—IMX declined 97.42% from its $9.52 all-time high (November 2021), while DYDX declined 97.21% from its $4.52 all-time high (March 2024). The current Crypto Fear & Greed Index reading of 11 indicates Extreme Fear market conditions affecting both assets.
Q2: How do the token supply structures differ between IMX and DYDX?
A: IMX maintains a more conservative circulating supply structure with 822.53 million tokens (41.13% of 2 billion maximum supply), indicating significant supply expansion optionality. DYDX operates with higher circulation penetration at 813.32 million tokens (81.33% of 1 billion maximum supply), suggesting a more mature distribution phase. This difference implies varying dilution trajectories and future token unlock pressure dynamics, with IMX presenting greater supply-side upside but also increased scheduled release risks.
II. Technical Infrastructure and Ecosystem
Q3: What are the fundamental differences in technical positioning between IMX and DYDX?
A: Immutable X functions as a Layer 2 NFT scaling solution for Ethereum, enabling zero-gas-cost transactions, instant settlement, and large-scale scalability for digital asset minting and trading. In contrast, dYdX operates as a decentralized derivatives trading protocol utilizing a hybrid infrastructure model combining off-chain order book matching with on-chain settlement, offering perpetual futures trading on Layer 2 and spot/margin/lending services on Layer 1. These represent distinct ecosystem verticals—gaming infrastructure versus decentralized finance trading—serving different user bases and use cases.
Q4: Which token offers superior liquidity and exchange accessibility?
A: Immutable X demonstrates significantly broader market accessibility, trading on 56 cryptocurrency exchanges compared to dYdX's availability on 20 exchanges. This substantially wider exchange distribution provides IMX investors with enhanced liquidity depth, reduced trading slippage, and improved price discovery mechanisms across trading venues. The broader accessibility also facilitates institutional market participant entry and exit strategies more efficiently than DYDX's more concentrated exchange presence.
III. Investment Characteristics and Risk Profile
Q5: What are the key investment value drivers and risk factors differentiating these tokens?
A: IMX investment value depends primarily on Web3 gaming infrastructure adoption rates, ecosystem developer participation, and NFT market maturity—with primary risks including concentrated exposure to unproven gaming sector demand, smart contract vulnerabilities, and regulatory uncertainty regarding NFT secondary markets. DYDX value correlates directly with decentralized derivatives trading platform activity and user engagement metrics, with concentrated risks including leveraged derivatives regulatory restrictions, order book manipulation vulnerabilities, and hybrid infrastructure complexity. Both face cryptocurrency market sentiment risk, evidenced by current Extreme Fear conditions creating enhanced downside pressure.
Q6: What community engagement metrics distinguish IMX from DYDX?
A: Immutable X demonstrates substantially broader community participation with 97,805 token holders, representing approximately 2.16 times more holders than dYdX's 45,361 token holders. This significantly larger holder distribution suggests potential advantages in network effect development, decentralization characteristics, and community investment alignment. However, DYDX's more concentrated holder base may facilitate faster governance decision-making and protocol modification implementation, representing a trade-off between decentralization benefits and operational efficiency.
IV. Investment Recommendations and Strategy
Q7: What investment strategy recommendations apply for different investor profiles?
A: Beginner investors should prioritize IMX due to broader exchange accessibility, lower technical complexity for NFT infrastructure understanding, and established Layer 2 market positioning, implementing dollar-cost averaging during current Extreme Fear conditions with minimum 18-24 month investment horizons. Experienced traders may balance both tokens—IMX for longer ecosystem infrastructure accumulation cycles, DYDX for active monitoring strategies capturing DeFi protocol trading volume exposure. Institutional investors should emphasize DYDX's Layer 2 application chain positioning with documented transaction volume metrics, while considering IMX for Web3 gaming sector exposure strategies with comprehensive regulatory clarity verification.
Q8: How should portfolio allocation considerations address current market conditions and risk management?
A: Conservative investors should allocate 40% IMX / 60% DYDX, emphasizing DYDX's higher circulation completion (81.33%) and reduced dilution uncertainty. Aggressive investors may allocate 60% IMX / 40% DYDX, leveraging IMX's lower circulation percentage (41.13%) for enhanced upside optionality. All portfolios should maintain 20-30% stablecoin (USDC/USDT) allocation during Extreme Fear conditions (Fear & Greed Index below 25) and implement cross-Layer 2 protocol diversification to reduce single-protocol concentration risk. Current year-to-date declines exceeding 86% warrant heightened capital preservation focus and dollar-cost averaging methodology rather than lump-sum deployment.
Report Generated: December 17, 2025
Data Source: Gate Market Data
Disclaimer: This FAQ provides factual market analysis and comparative framework information only. It does not constitute financial advice or investment recommendations. Cryptocurrency investments carry substantial capital loss risk. Conduct independent research and consult qualified financial advisors before making investment decisions.
Share
How to Buy Cryptocurrency


Trending Cryptocurrencies


XZXX: A Comprehensive Guide to the BRC-20 Meme Token in 2025

Bitcoin Fear and Greed Index: Market Sentiment Analysis for 2025

Top Crypto ETFs to Watch in 2025: Navigating the Digital Asset Boom

5 ways to get Bitcoin for free in 2025: Newbie Guide

Bitcoin Market Cap in 2025: Analysis and Trends for Investors
2025 Bitcoin Price Prediction: Trump's Tariffs' Impact on BTC

# How Do Futures Open Interest, Funding Rates, and Long-Short Ratios Signal Crypto Derivatives Market Trends?
How Do MACD and RSI Technical Indicators Predict Litecoin Price Movement in 2025?
What is Litecoin (LTC) market overview: price at $80.11, market cap $6.5B, and 24h trading volume $235M?

Is Kaito (KAITO) a good investment?: A Comprehensive Analysis of Risk, Potential Returns, and Market Viability for 2024

Is Grass (GRASS) a good investment?: Analyzing Market Potential, Risks, and Future Prospects for 2024