Square
Following
Hot
News
Profile
Share your thoughts
placeholder
Article
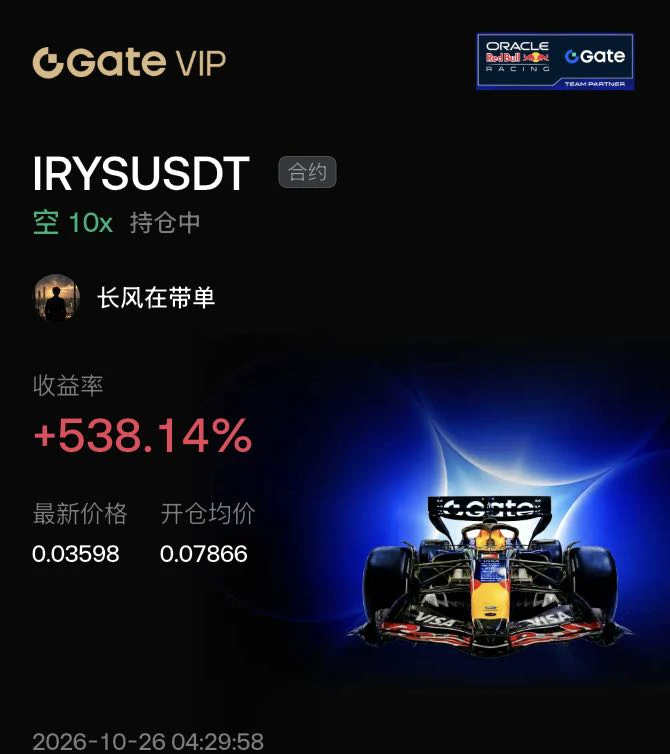
Remember that day when we said “$IRYS was about to explode”?
You hesitated; I took action.
I’d already made a big score on the short that day. Though I reduced my position later, trust me, taking profits is just part of everyday life.
Technical analysis is just a tool; conviction is what matters.
This run with Gate made me believe: those who persevere will ultimately succeed'. $JCT
post-image
IRYS-19.91%
JCT-1.11%
  • 1
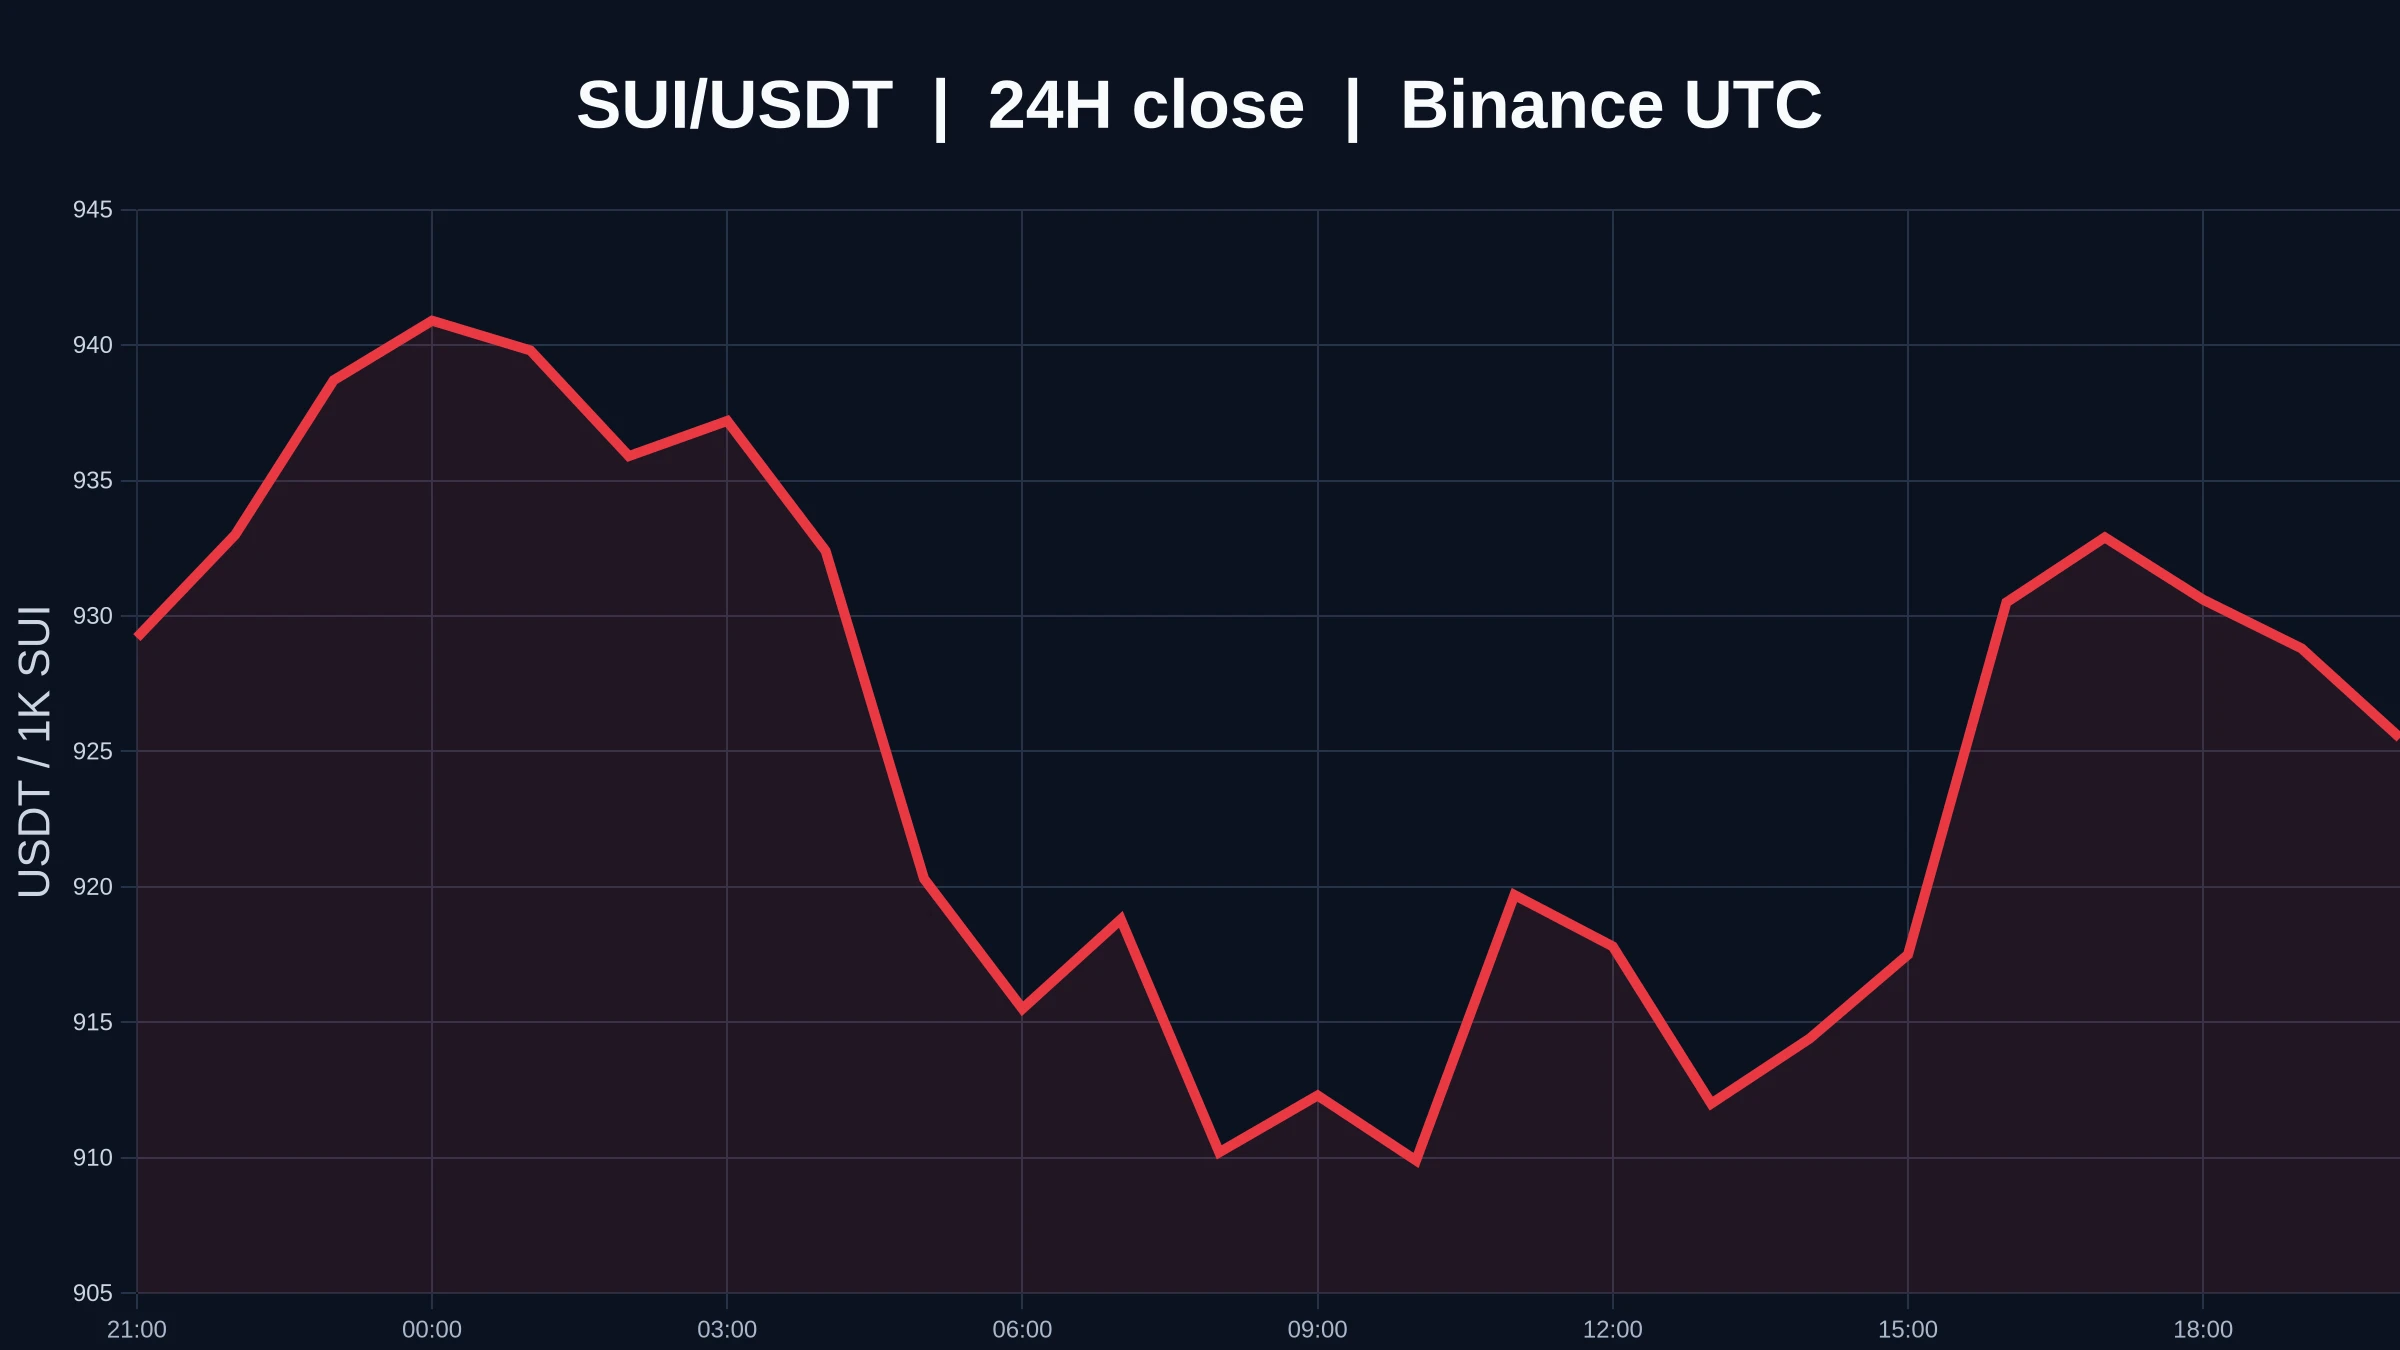
$SUI being oversold doesn't mean it's bottomed; rebound demand is growing, but a reversal still needs one more piece of evidence
$SUI is now trading at 0.9252 USDT, down -1.48% over 24 hours, and fluctuating between 0.904 and 0.9427. 1-hour support is at 0.904, resistance is at 0.9427, the 4-hour trend is weak, and trading activity is only 0.11x. In this snapshot, the price has already fallen to the lower end of the range, but neither timeframe is showing a reversal signal.
My view is that rebound demand has emerged, but until the structure stops weakening, I won't call oversold conditions a
post-image
SUI-0.70%
Trenches
STONK
S
bade
b
STONK
6GmA...UNgx
Market Cap
$.
Change
.
24h Vol
$.
Holders
.
BTC
B
bade
b
BTC
C5xp...pump
Market Cap
$.
Change
.
24h Vol
$.
Holders
.
CNPY
C
bade
b
CNPY
0xc6...ddd2
Market Cap
$.
Change
.
24h Vol
$.
Holders
.
ZIG
Z
bade
b
ZIG
0x8c...1145
Market Cap
$.
Change
.
24h Vol
$.
Holders
.
LAUNCH
L
bade
b
LAUNCH
AhBi...Qj6C
Market Cap
$.
Change
.
24h Vol
$.
Holders
.
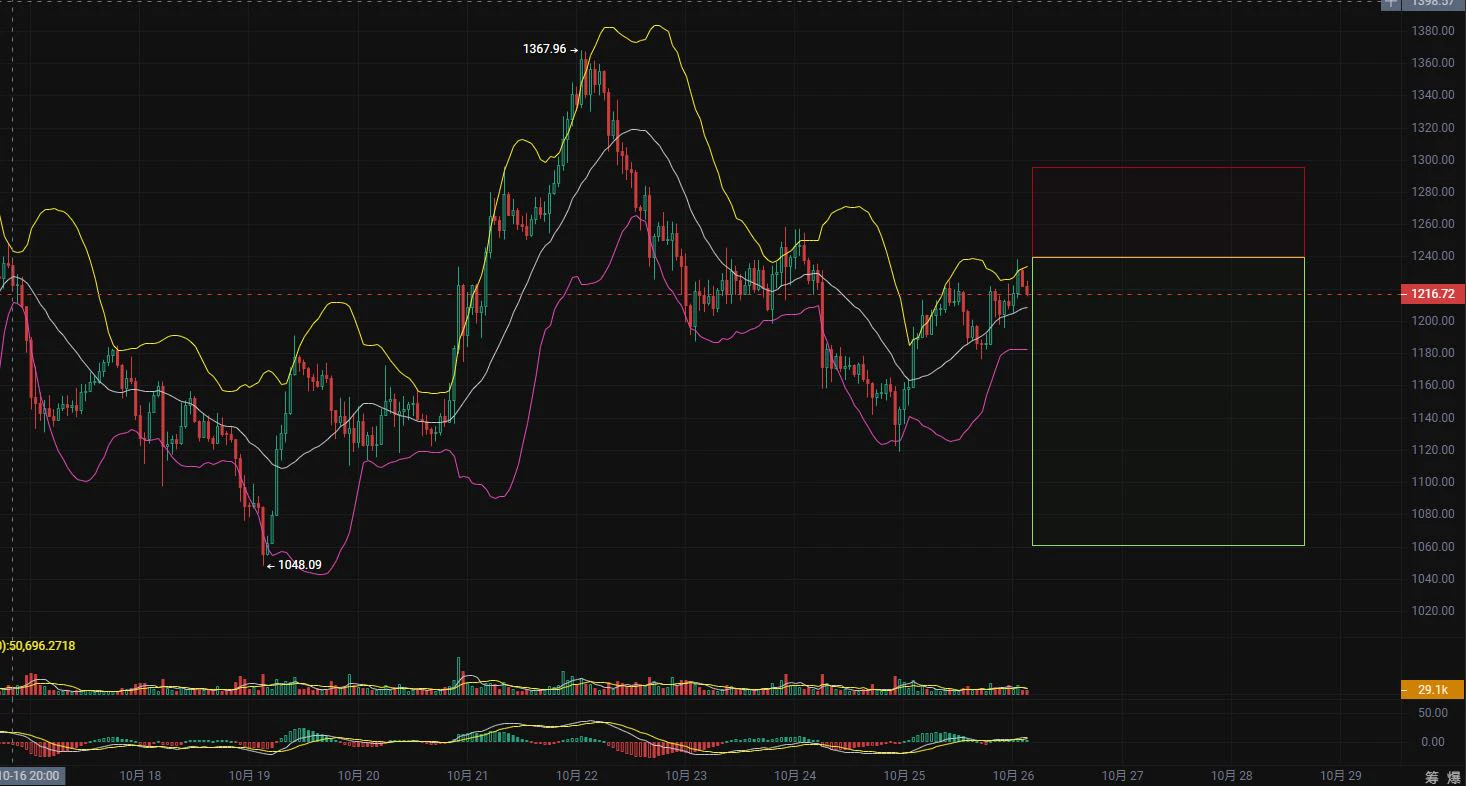
10.26 ZEC Long and Short Strategy (Public Version)
Long Strategy$ZEC
  Entry range: around 1080-1120
  Stop-loss defense: around 1040 (depending on entry price and position size)
Take-profit targets
  First target: around 1180
  Second target: around 1120
Third target: 1220 (in view if the second target is broken)
Fourth target: 1280 (in view if an evening trend develops)
Factors: The Bollinger Bands show signs of widening, and MACD is below the zero axis. As for market depth data, there are few large buy orders and more medium and small orders. Overall, retail traders
post-image
ZEC+1.71%
BTC+0.14%
ETH+0.37%
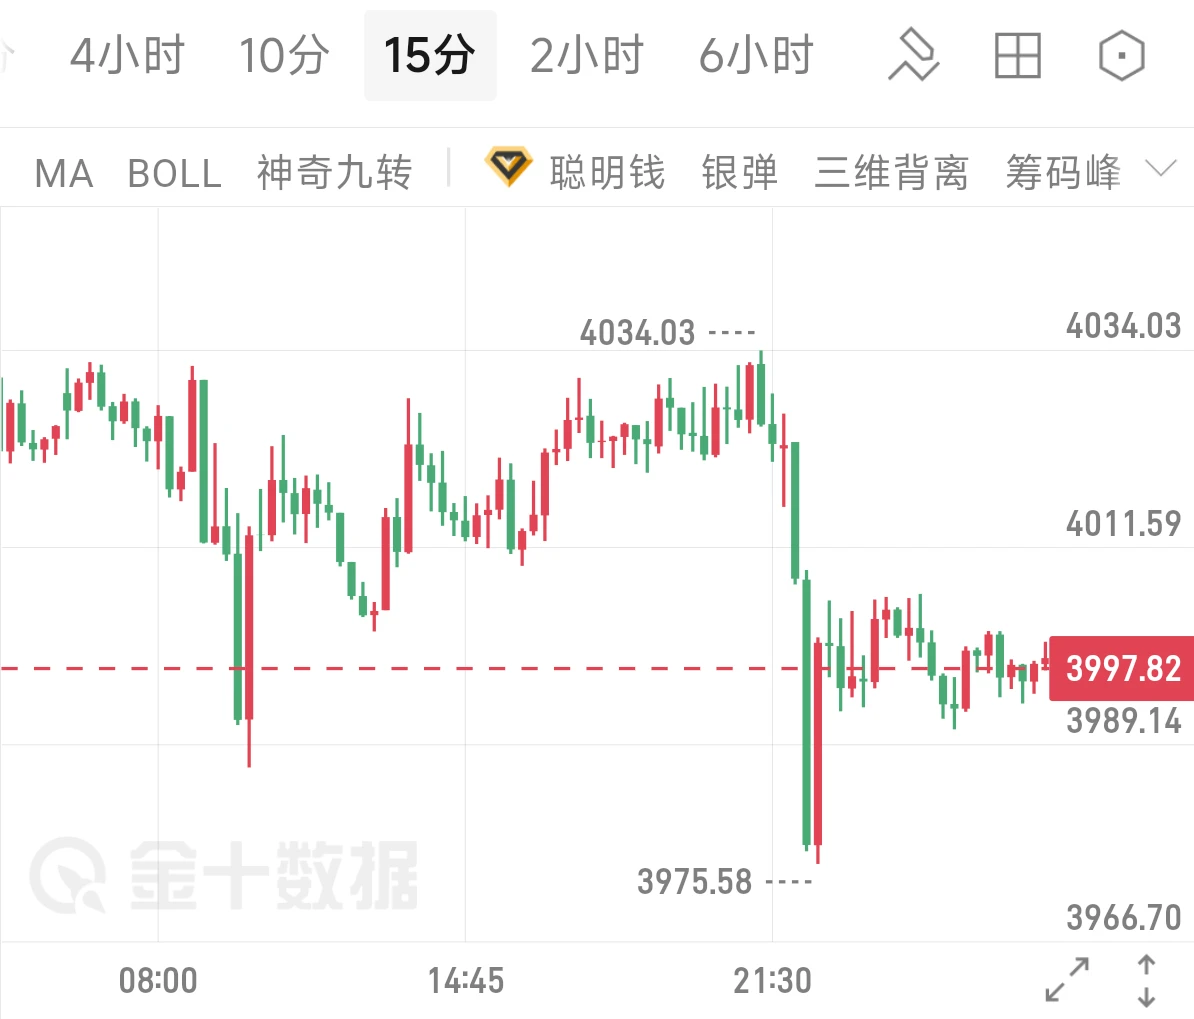
10.26 Jin Ce Gold Morning Brief: Gold plunges late in the session, breaking below 4000; does the bear raid have more downside room?
During the day, gold maintained an oscillating upward trend, touching a high near 4034 before bears launched a concentrated sell-off in the evening. Prices plunged in a straight line, quickly breaking below the 4000 psychological level and hitting a low of 3975. It is now weakly consolidating near 3997, with short-term bulls routed and bears back in control of the market.
News: Expectations for Fed rate cuts cooled again, Treasury yields rebounded after bottoming
post-image
XAUT+0.22%
I’m the Mid-Term Intelligence Guy
I recently noticed an influential trader in the community mention that $BT has pulled back about 9%, and he believes the next few weeks are still suitable for dollar-cost averaging.
A 9% drop in the current market is actually a fairly healthy correction in a bull market. Many people are still watching the previous extreme low, hoping the price will test it again, but that “liquidation wick” was the result of several negative factors hitting at the same time. Unless new bad news emerges, there’s no need to assume the price must return to the previous low—histo
post-image
ZEC+1.78%
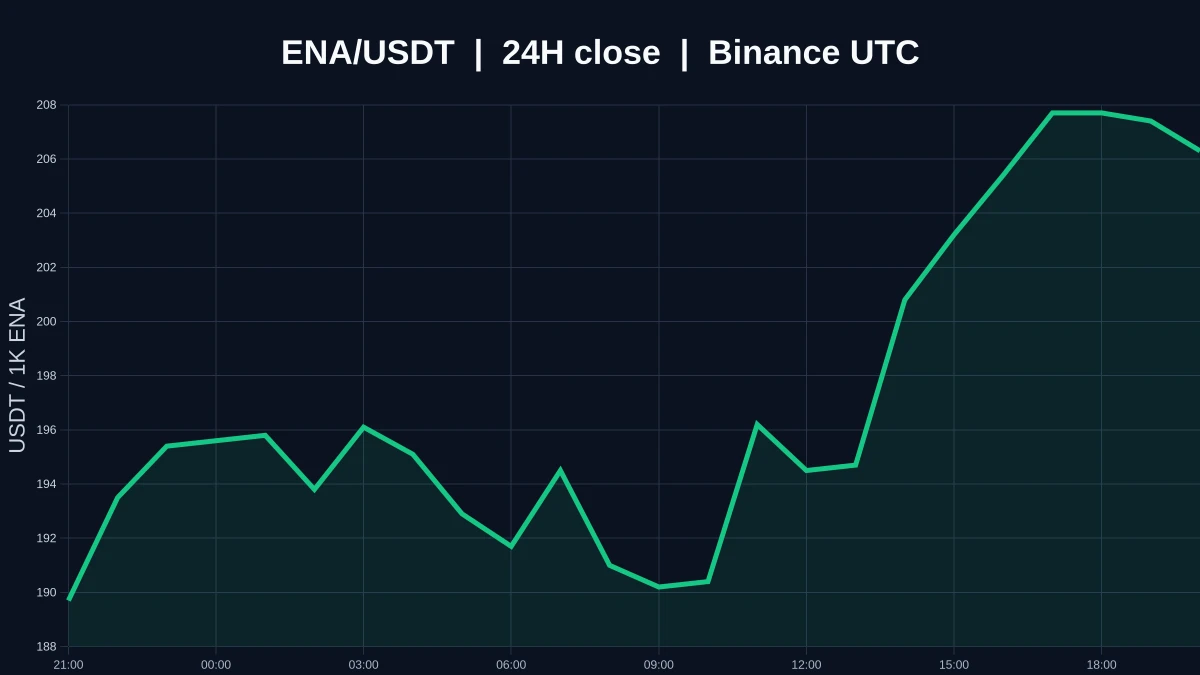
$ENA Current price: 0.2064, up 8.8% over 24H. The 1H trend is strong, with RSI at 74.8; the 4H trend is also relatively strong, with RSI at 49.2. Watch whether the price can hold above the 0.209 resistance and rebound after losing the 0.1887 support. Trading volume is only 0.28x the average, so confirmation is needed. Market volatility is high; for observation only.
post-image
ENA+8.90%
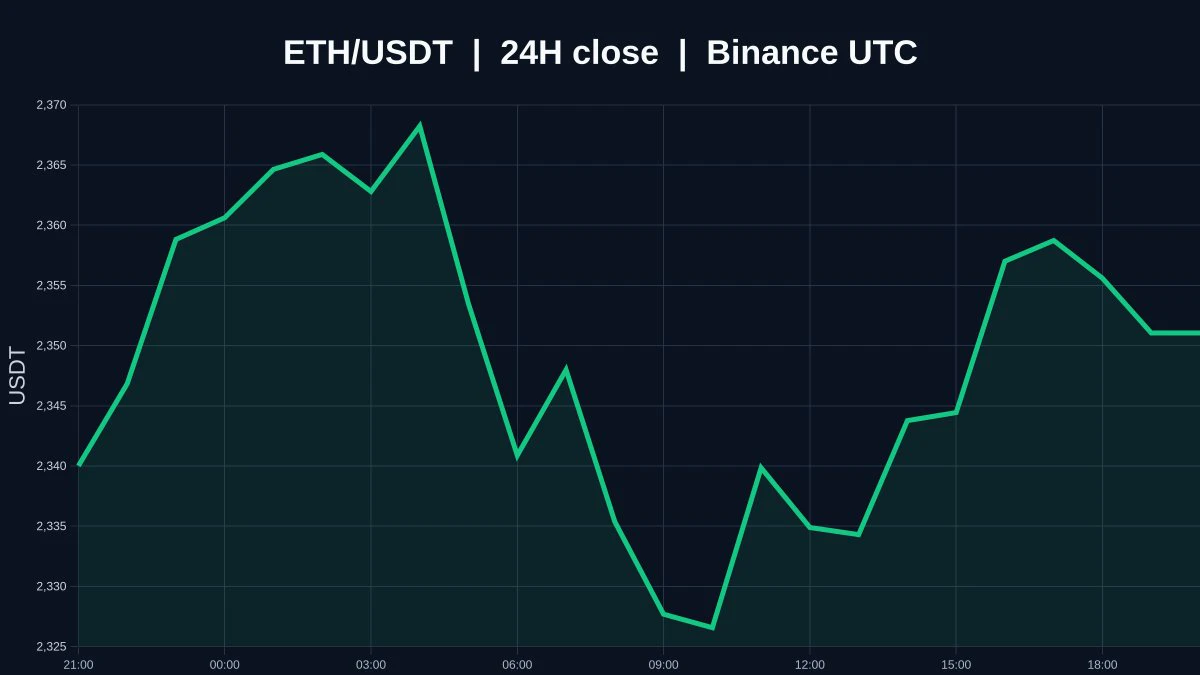
$ETH Currently trading at 2,351.05, up 0.35% over 24H (range: 2,318–2,371.52). The 1H trend is strong, with an RSI of 56; the 4H trend is weak, with an RSI of 35. If it breaks above 2,371.52 convincingly, watch for further upside; if it falls below the 2,318 support, the short-term structure may weaken. The market is volatile; for observation only.
post-image
ETH+0.40%
$SNDK Consensus EPS is around $46.2, already above the top of the company’s $44 to $46 guidance range, yet the share price has slid from its 52-week high of $2,354.39 on June 22 to $1,238.03, a pullback of about 47%. Earnings estimates are still being revised upward, but the stock is already being priced as if the cycle has peaked. $MU $WDC
STX SKHY
First, the timing: results are due after the market close on October 29 Eastern Time, with the conference call at 4:30pm EDT, or 4:30am on October 30 Beijing time. AMZN and INTC are also reporting that night.
Let’s break down the numbers.
Fiscal Q
post-image
SNDK-1.90%
MU+2.39%
WDC-2.93%
STX-1.81%
SKHY+4.01%
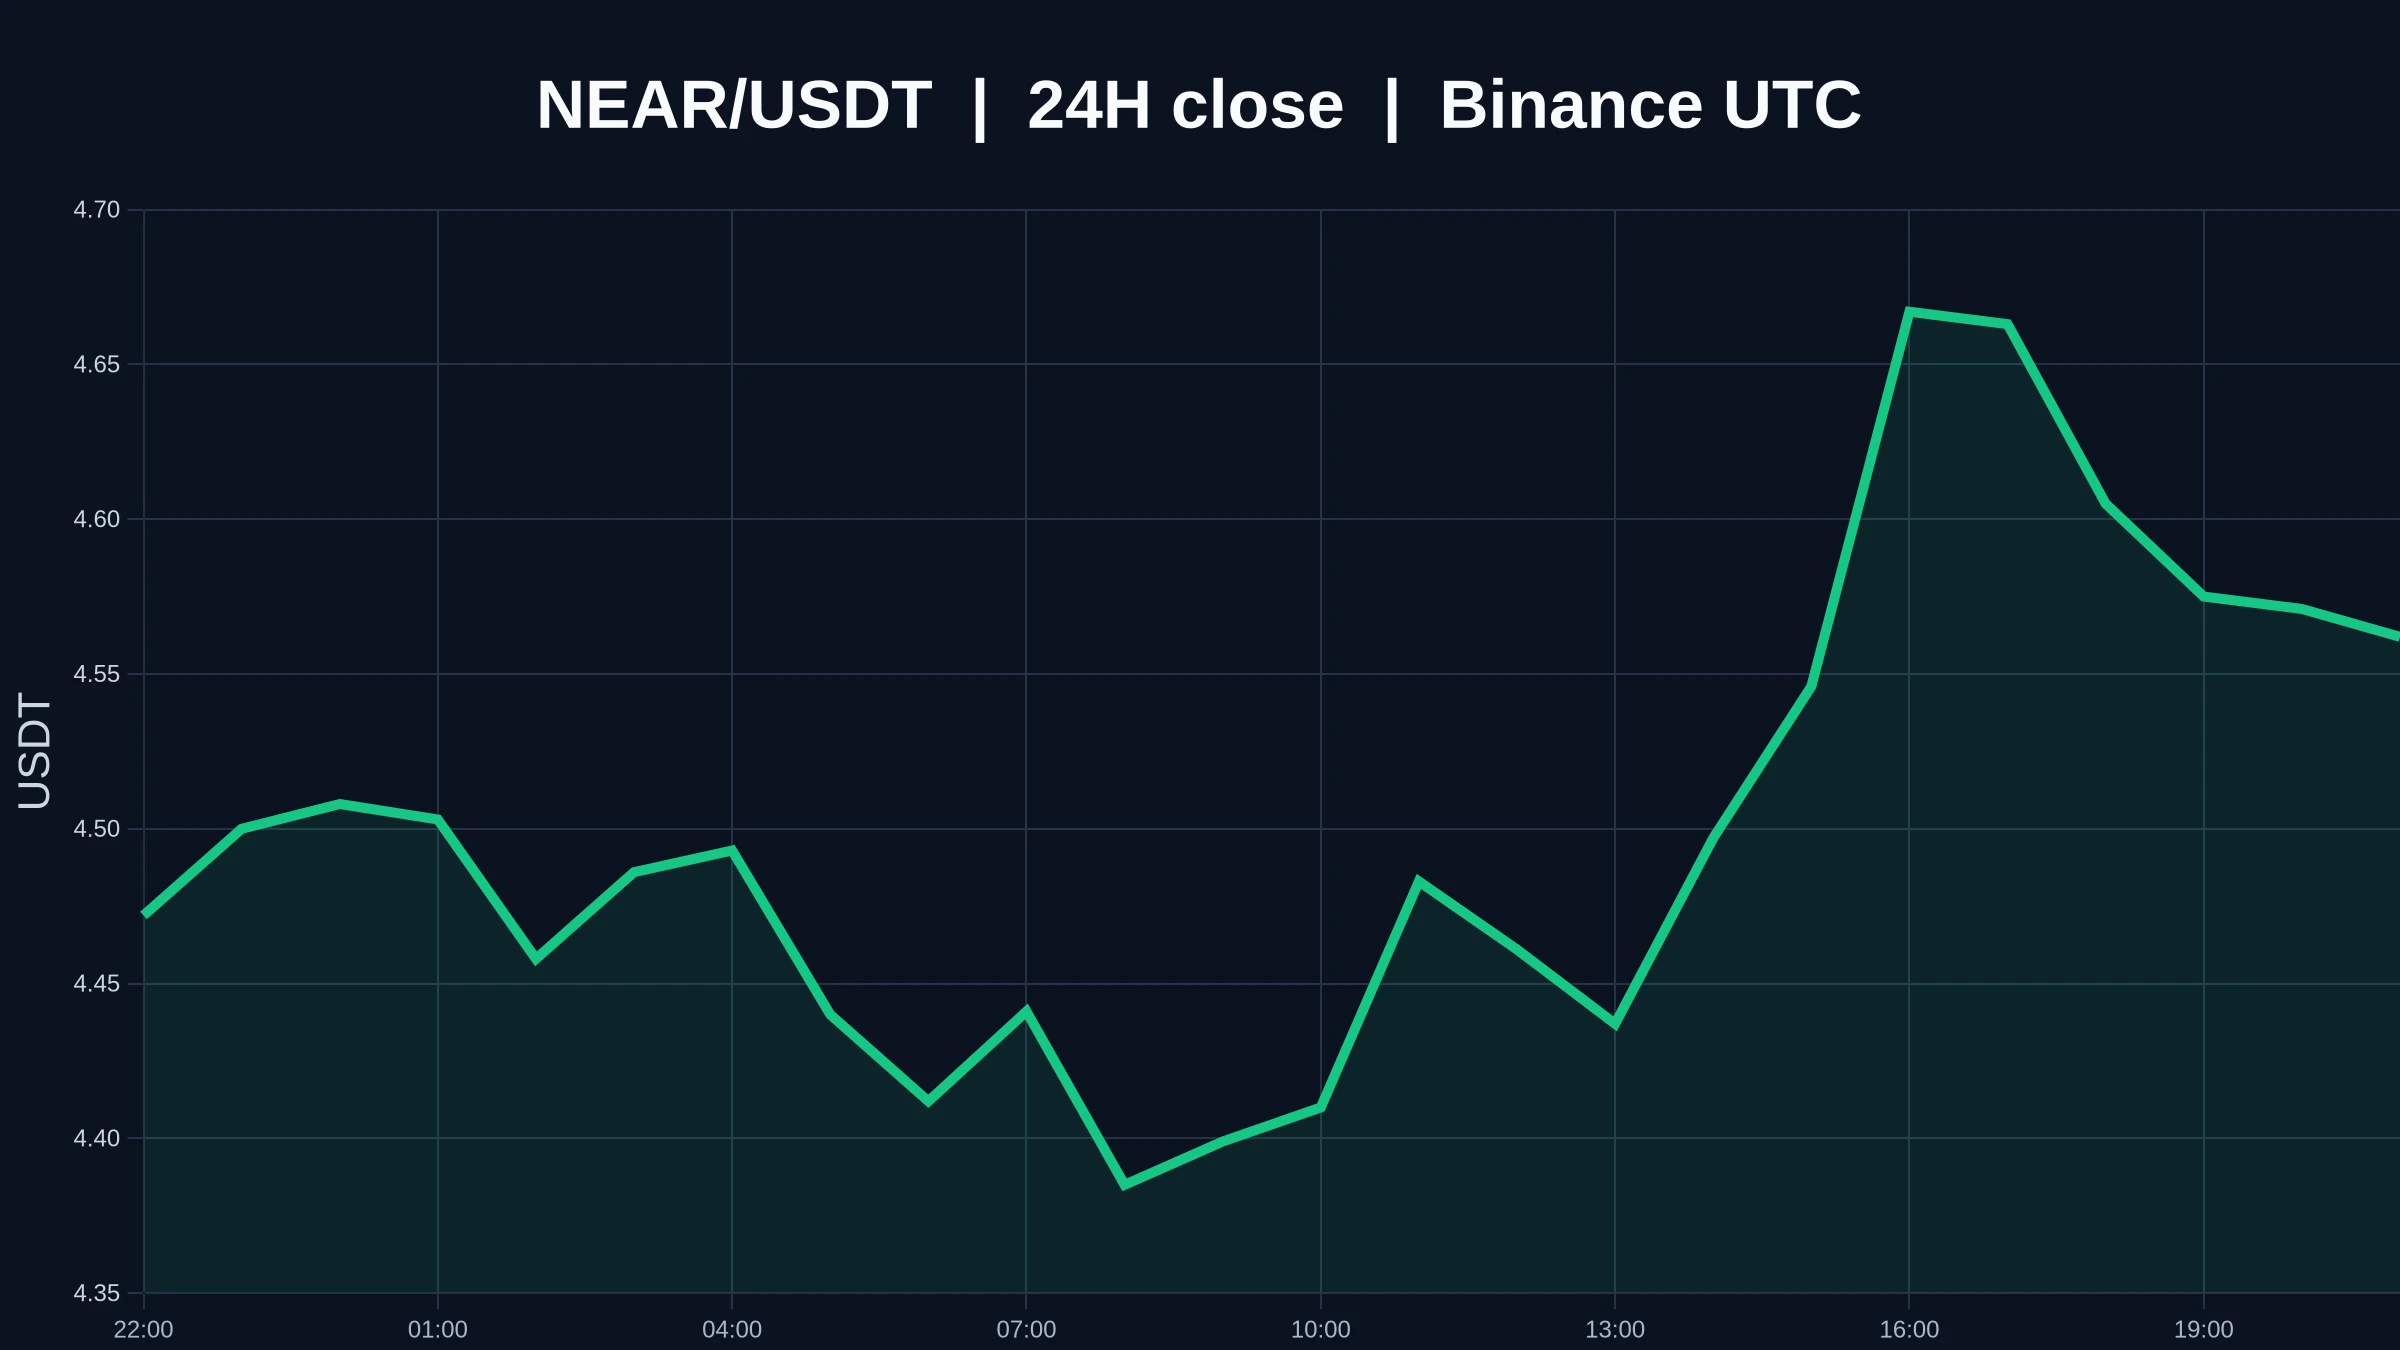
There’s no need to explain $NEAR emotionally today. The current price is 4.567, up 2.58% over 24 hours, with volume at 0.01x; all three are facts that can be checked.
I’ll first separate “what has happened” from “what will continue.” I’ll treat the short timeframe as a signal, not a conclusion; if the larger timeframe doesn’t confirm, the direction can still reverse. Focusing on just one favorable-looking timeframe can make a rebound look like a reversal, or a normal pullback look like the end of a trend. The reference points this time are 4.351 below and 4.699 above. If the move continues, th
post-image
$CL So my crude oil short position just got bigger again!
Opened at 104.3, added once at 103, and now added again! Average price is around 103.2 now, guys—let’s smash it! If it breaks below 101, I’ll keep adding all the way down to 90😂😂😂😂
post-image
CL-0.73%
TODAY MARKET UPDATES
live-cover
LIVE412
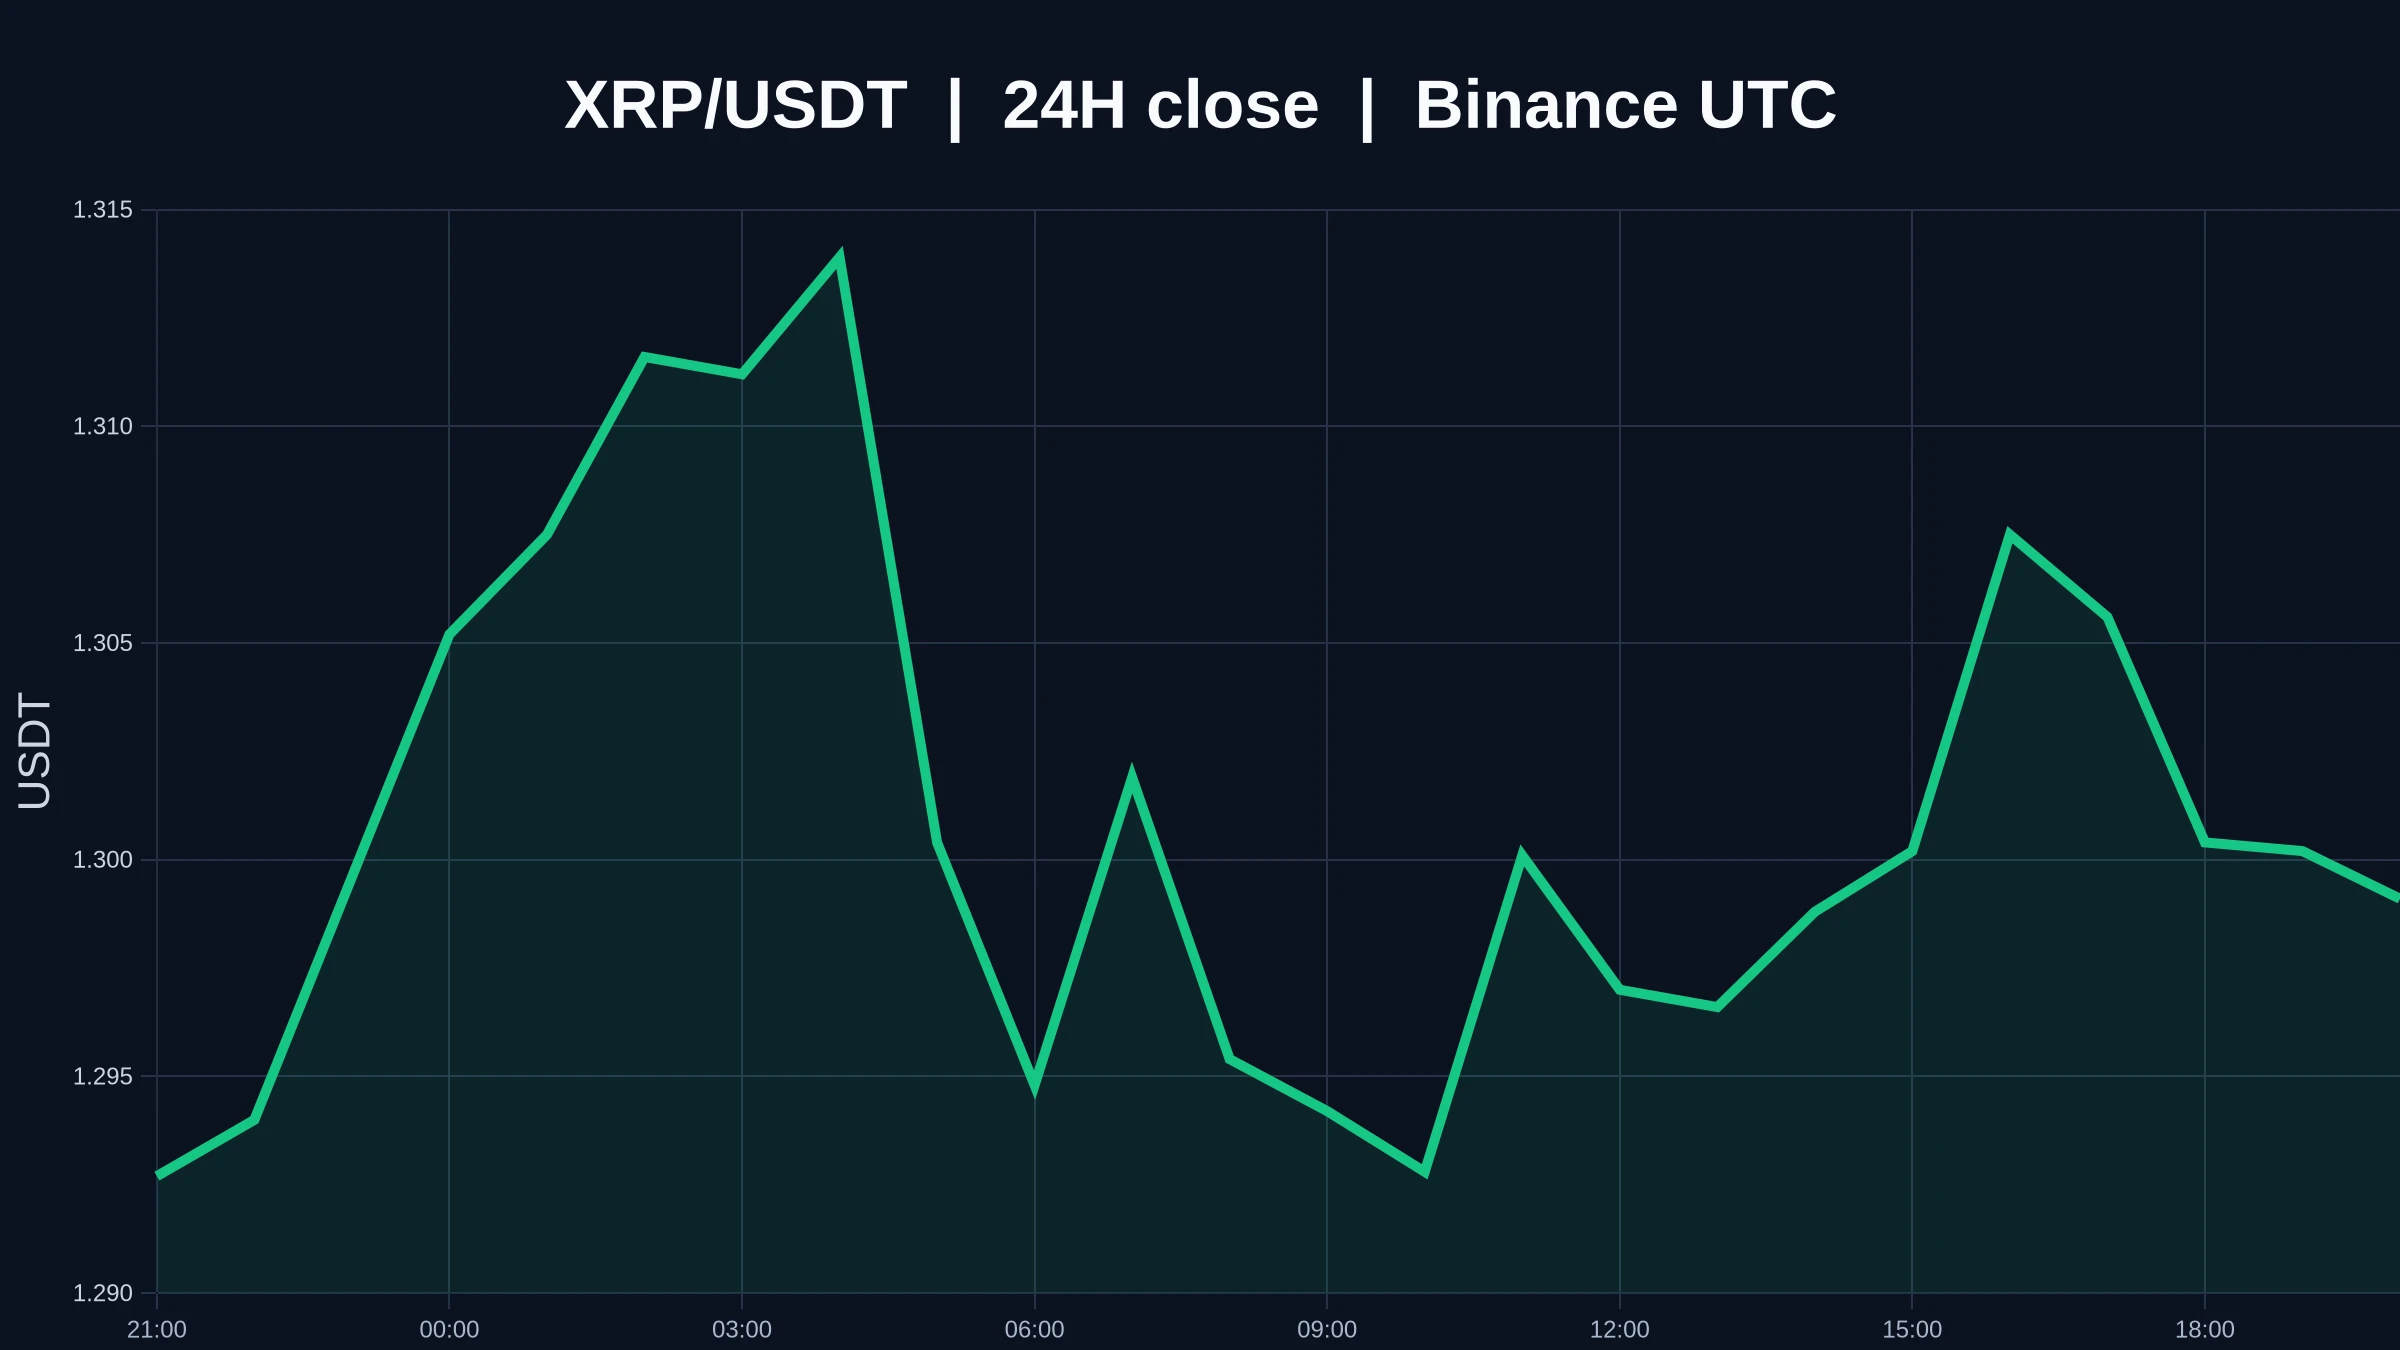
What matters this time for $XRP isn’t simply whether it “goes up” or “goes down,” but which of the two nearby boundaries is actually dealt with first after the price reached 1.3003. Rather than picking a side, check for alignment across timeframes first. The 1-hour chart reflects short-term flows, while the 4-hour chart reflects the broader structure. When the two timeframes point in opposite directions, it only means the market is choosing a direction; a short-term shift cannot be treated as a trend reversal.
The price is still looking for answers between 1.2891 and 1.3159. Only after it trul
post-image
XRP+0.80%
A whale/institutional entity holds ETH long positions worth over $270 million that are now on the ve
live-cover
LIVE1,506
This divergence across commodities is the real signal: financial demand is fading, while physical scarcity is growing. Copper and oil are moving in different directions, so don’t apply the same logic to every commodity. When trading, keep your hands steady—if you can’t see the picture clearly, don’t take a big position. Can your current position withstand this kind of divide? Tell us in the comments how you’re handling it.
post-image
XCU-0.02%
Check the transactions. God is good and crypto is a blessing ❤️
post-image
#HOOKED
The short position placed in the internal group this evening is set to take profit tomorrow 🙌🏻
Guys, let me share my personal take on BTC

BTC is now around 80.5k. Saturday’s sell-off broke below 80k, briefly touching 79k before recovering—showing that neither bulls nor bears are willing to give up the 80k level easily.

My directional view is clear: bearish in the short term, watchful in the medium term.

Reason: 82k is clear resistance overhead; a rebound to that level would let trapped holders break even. If 79k gives way, price will test the deeper support at 75k.

So there are just three things to do:

- If it rebounds to around 82k, don’t chase; that’s a zone to reduce pos
BTC+0.14%
$BTC On-chain data shows a daily net inflow of around 258 coins, with extra-large orders making up the main source of buying. But the price has continued to swing around the 80k level without moving decisively in either direction. Large holders seem to be quietly accumulating at lower levels, with no signs of an active short-term push higher.
$ET The net inflow is around 4,275 coins, with a relatively healthy fund structure and large buy orders appearing at the same time. Unfortunately, its ability to move independently is weak, and it is still being driven by Bitcoin’s pace.
$SOL The net inf
post-image
SOL+0.42%
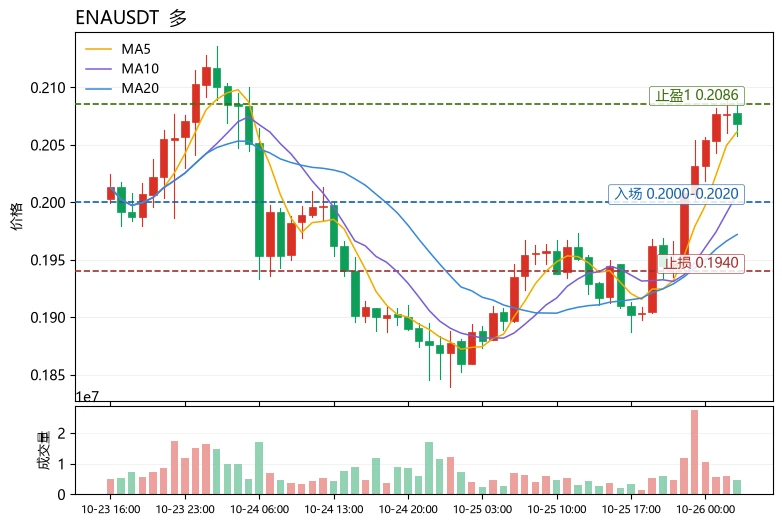
$ENA It is currently inadvisable to chase the rally. Consider entering a small long position only after a pullback to moving-average support, and set exit conditions in advance. Rationale: The price at 0.2068 is close to the Bollinger upper band at 0.208649, and the RSI at 68.3 is nearing overbought territory. After gaining over 10% in 24h, the market faces significant short-term profit-taking pressure; however, MA5 has crossed above MA20 and the MACD histogram is positive, so the medium-term structure remains bullish. The +0.0050% funding rate indicates crowded longs, while the Fear and Gree
post-image
ENA+8.90%
LTC+0.52%
SOL+0.42%
Load More

Join 40 M users in our growing community

⚡️ Join 40 M users in the crypto craze discussion

💬 Engage with your favorite top creators

👍 See what interests you

Trending Topics

USEarningsSeason

103.72k Views3.54k Discussing

The U.S. Q3 earnings season is in full swing, with major tech companies including Tesla and Meta reporting results. Market focus is shifting beyond revenue and profit toward AI spending, capital expenditure, margins and forward guidance. Which company’s earnings are you watching most closely?

GateWCTCS9GlobalTradingCompetition

733.89k Views8.12k Discussing

USConsumerSentimentNearRecordLow

12.87k Views306 Discussing

View More