Square
Following
Hot
News
Notifications
Profile
Share your thoughts
placeholder
Article
#Gate股票畅聊季 #美股财报季 Lessons from the US Stock Market Plunge: AI Investment Enters the Earnings-Delivery Era

Thursday night’s US stock market must have left everyone stunned. The Nasdaq plunged 5.52%, the Magnificent Seven lost $1.04 trillion in market value in a single day, and the entire market shed $2.9 trillion—equivalent to more than 7 trillion yuan. These aren’t just numbers; real wealth vanished into thin air.
Many people’s first reaction was: Is AI completely finished? Don’t rush to judgment. Recent policy documents, institutional research reports, and industry data all show that the ess
NAS100-0.07%
NVDA+2.80%
AMD+11.55%
WDC-1.36%
TSLA+4.26%
  • 1
🔹 Following the release of the non-farm payrolls data, the probability of a Fed rate hike in Decemb
live-cover
LIVE2,013
Trenches
ZIG
Z
bade
b
ZIG
0x8c...1145
Market Cap
$.
Change
.
24h Vol
$.
Holders
.
BTC
B
bade
b
BTC
C5xp...pump
Market Cap
$.
Change
.
24h Vol
$.
Holders
.
GM
G
bade
b
GM
0x13...7777
Market Cap
$.
Change
.
24h Vol
$.
Holders
.
Diamond
D
bade
b
Diamond
5VCE...pump
Market Cap
$.
Change
.
24h Vol
$.
Holders
.
STONK
S
bade
b
STONK
6GmA...UNgx
Market Cap
$.
Change
.
24h Vol
$.
Holders
.
ARIA | Long 🟢 | Bullish | 15-minute 24-hour: +12.83% | Volume: 35.5M USDT. Long rationale: Price above EMA200; EMA20/50/200 in bullish alignment; RSI14 at 67.8; MACD histogram positive; ADX14 at 21.8; volume is 1.44 times the 20-candle average; breakout from the 20-candle range. Entry: 0.15503 Stop-loss: 0.143574 Take-profit 1: 0.16935 | Take-profit 2: 0.177942 | Take-profit 3: 0.189399Entry price is for reference only; do not chase. The strategy is invalidated if the stop-loss level is hit. Technical analysis strategy only; not investment advice. $ARIA
post-image
ARIA+22.03%
AI tech stocks plunge across the board, and BTC gets caught in the fallout! Has crypto been dragged down this time too?

The market has been a little too lively lately! AI tech stocks suddenly plunged, sending jitters through the tech sector, while the crypto market came under pressure too. We thought crypto could move independently, but it turns out that when traditional financial markets sneeze, crypto catches a cold too.
Why is this happening? When risk appetite declines, investors often reduce their exposure to high-volatility assets. Although AI tech stocks and cryptocurrencies belong to
AMD+11.55%
  • 41
Crypto Market Updates on BTC/ETH
live-cover
LIVE2,392
#WCTCS9 #$ZEC
#ShareWeekly
Current ZEC Price: $1,347 USDT
ZEC is approaching an important technical decision point. After maintaining strong interest from buyers, the market is now testing whether bullish momentum can continue or whether sellers will create another correction. My focus is on daily price structure, weekly momentum, support and resistance levels, trading volume, and risk management.

1. One-Day Chart Pattern (1D)
On the 1-day timeframe, ZEC is showing a recovery structure, but the market still needs a confirmed breakout to establish stronger bullish momentum. The $1,349–$1,356
AMD+11.55%
#USNonfarmPayrolls
US Nonfarm Payrolls (NFP): Stronger Than Expected – What Does It Mean for the Markets?
The US Nonfarm Payrolls (NFP) report remains one of the most important economic indicators for global financial markets. Released monthly by the US Bureau of Labor Statistics (BLS), it measures the number of jobs added or lost across the US economy, excluding agricultural employment.
The latest October 2026 employment report, released on November 6, delivered a stronger-than-expected result, signaling renewed strength in the US labor market.
📊 Key Highlights of October NFP
Nonfarm Payro
XAU+0.38%
The boundary between traditional stock markets and digital asset infrastructure is narrowing. Gate has expanded its range of perpetual stock contracts to cover over 500 underlying assets across markets in the Americas, Hong Kong, South Korea, Japan, and Taiwan. According to an independent data platform, the exchange ranks second globally in terms of open interest for flagship contracts such as SPCX, SKHYNIX, SNDK, and SOXL. Additionally, an "Innovation Zone"—featuring 40 assets and offering leverage of up to 75x—has been launched.

This represents more than just a numerical increase; it signif
SPCX+0.20%
SKHYNIX+1.41%
SNDK-0.18%
SOXL-1.16%
SK Hynix-10.44%
#$AKE It’s a day off today, so there’s not much movement. Many people may not be able to resist trading altcoins, but I don’t recommend it. Its daily chart is heading straight down. It keeps getting pumped up, then crashes hard again. You can tell it’s a completely manipulated coin. Everyone should try to stay away and be careful not to get targeted for liquidation.
post-image
AKE+6.07%
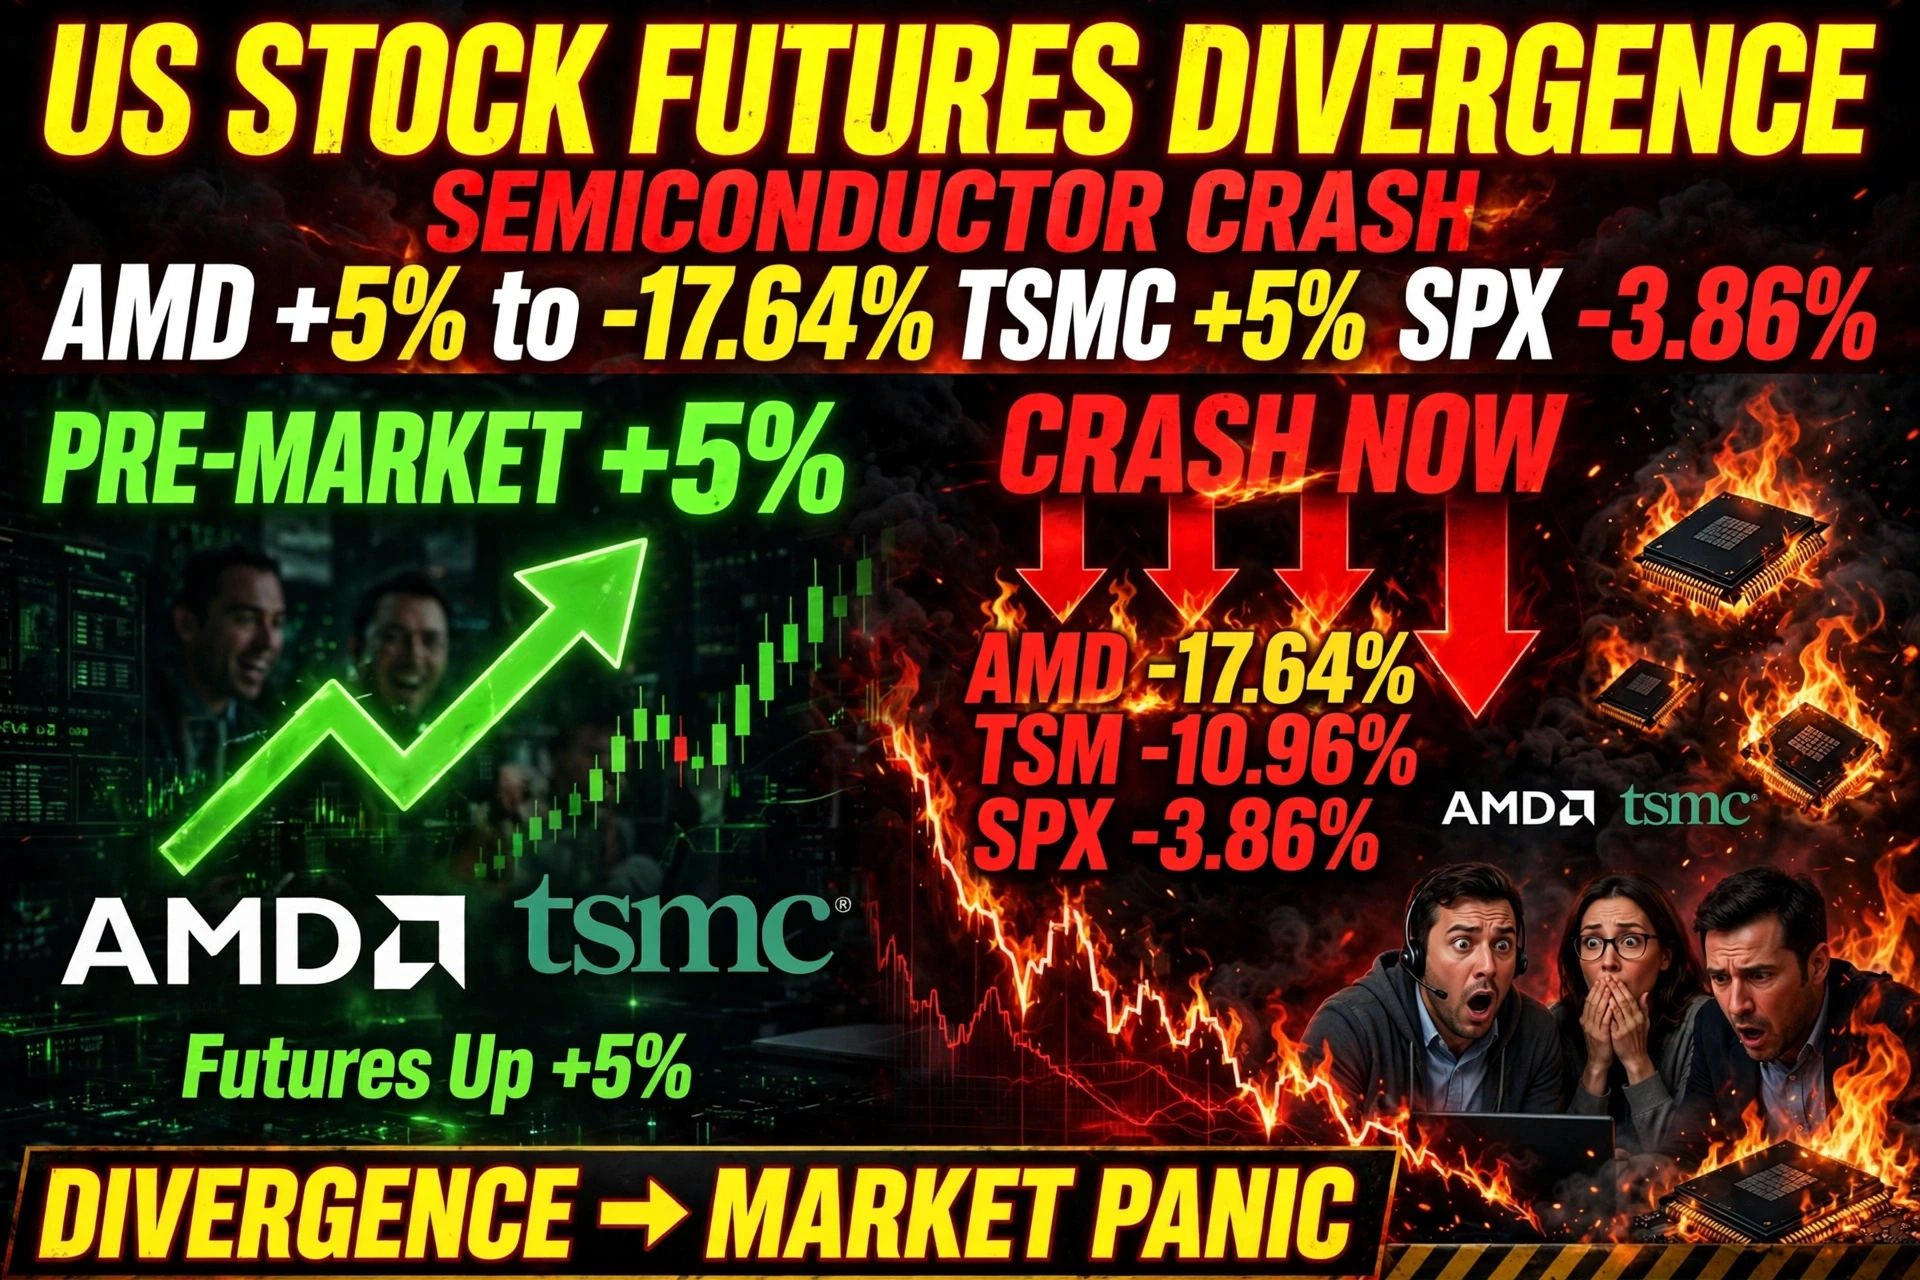
U.S. Stock Futures Diverge; Semiconductor Giants AMD and TSMC Rally

U.S. stock futures are diverging, with AMD and TSMC rallying over 5% in pre-market trading. However, the ticker tags tell a different story: AMD is down 17.64%, TSM is down 10.96%, and the SPX500 is down 3.86%.

This headline captures the chaotic nature of the current market, particularly in the semiconductor sector. "Diverging" futures mean investors are uncertain, with some indices pointing up and others down. The pre-market rally in AMD and TSMC suggests that there was highly positive sector-specific news overnight—perhap
post-image
AMD+11.55%
TSM+6.60%
SPX500+0.19%
#质押Launchpool瓜分45万VLX Gate Launchpool Session 386 is here: Stake BTC, ETH, or VLX to share 4,545,460 ValueX (VLX), with an estimated maximum annualized return of 47.40%.

The numbers look enticing. But today I want to talk about something less enticing—three questions you need to think through first.

I. 47.40% is an annualized peak estimate, not what you’ll actually earn
Launchpool’s annualized return is an extrapolated figure. Here’s a classic industry comparison: a 7-day campaign advertises a 300% annualized return, but the actual return is only about 5.75%—because annualization simply mul
post-image
VLX+0.00%
BTC-0.67%
ETH-1.26%
AI concepts are everywhere! Am I betting on the future, or on a pie in the sky someone else has sold me?

In today’s stock market, it seems that any company whose product has anything to do with AI automatically gets a ticket to the future of technology.
But I believe the AI companies truly worth watching should do more than attract attention with hype—they should deliver tangible results.
For example, do their products have real customers? Do their technologies have a competitive moat? Can their business models make money? Is their revenue growth sustainable?
If a company keeps announcing gra
MU+4.71%
  • 29
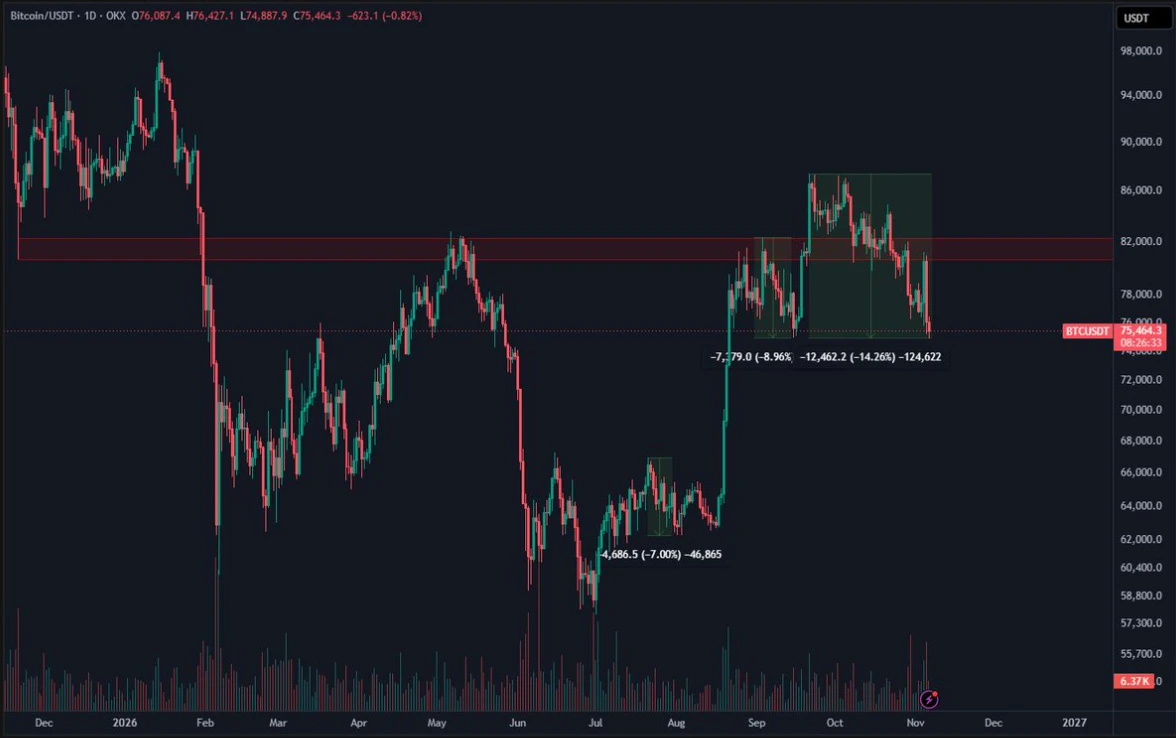
BTC is back above 76K, but I’m not celebrating too soon! These 3 risk signals are worth watching!

Seeing BTC climb back above $76,000, some people are already expecting the bull market to return. But I’d say the four most dangerous words in investing are “excessive optimism.”
There are currently three risks worth paying attention to.
First, short-term trends remain under pressure. Some technical indicators show that BTC’s daily momentum has not fully recovered, so a rebound alone isn’t enough to confirm a trend reversal.
Second, there may be selling pressure overhead. If the price faces susta
BTC-0.67%
  • 33
#WCTCS9 #$ZEC
#ShareWeekly
Current ZEC Price: $1,347 USDT
ZEC is approaching an important technical decision point. After maintaining strong interest from buyers, the market is now testing whether bullish momentum can continue or whether sellers will create another correction. My focus is on daily price structure, weekly momentum, support and resistance levels, trading volume, and risk management.

1. One-Day Chart Pattern (1D)
On the 1-day timeframe, ZEC is showing a recovery structure, but the market still needs a confirmed breakout to establish stronger bullish momentum. The $1,349–$1,356
ZEC+1.16%
What Is Correlation? Why Can Two Cryptocurrencies Often Rise and Fall Together Yet Still Have Different Risks?

In cryptocurrency trading, many people notice that when BTC rises, ETH often rises too; when the market falls, many altcoins also decline together.

This phenomenon of moving together can be analyzed using correlation coefficients. But an important question is: if two cryptocurrencies often rise and fall together, does that mean they have the same risk?

The answer is no.

First, what is a correlation coefficient?

A correlation coefficient is a statistical measure of the direction a
post-image
BTC-0.67%
ETH-1.26%
$BTC We are now seeing the largest pullback since the rebound from $58K to $87K . I don't need to tell you that corrections like this are normal for Bitcoin. Overall volatility is actually much lower than in previous years. However, for the higher-timeframe structure to regain proper bullish momentum, price needs to break back above $80K. Below this $73K-$76K area is an important higher-timeframe support zone to watch.
post-image
#StockTalkSeason #MSFT
#WCTCS9
My View on Microsoft (MSFT): Why I Remain Bullish Long-Term Despite Recent Volatility

I am currently net bullish on Microsoft over a 12–24 month horizon, while remaining selective on near-term entries after the sharp market swings of the past week.

The stock closed around $530–531 on November 6, 2026, after dropping roughly 3.6% on November 5 from the previous day’s close near $556. That put it about 5% below its recent 52-week high of $559.15 set on November 4. Year-to-date the shares are still up in the low double digits, and they sit roughly 50%+ above th
MSFT-0.95%
NVDA+2.80%
GOOGL+0.72%
AMZN-0.44%
Why do you need a 100% gain to break even after a 50% loss?

In cryptocurrency trading, many people see their assets fall by 50% and think that a 50% price rebound will restore their original capital.

But this is a common mathematical misconception.

Losses and the gains needed to break even are not symmetrical. The greater the loss, the higher the return needed to restore the original capital. That is why controlling drawdowns is more important than trying to make up for losses afterward.

First, why doesn’t a 50% gain make up for a 50% loss?

Suppose you initially invest 1,000 USDT.

After
post-image
How much capital should be allocated to a trade? Why do some traders get the direction right, yet their accounts continue to lose money?

Many people study entry signals, technical indicators, and market forecasts, but overlook a more fundamental question: How much risk should each trade take on?

Even if you correctly predict the direction of a trade, the outcome may still be poor if your position is too large, your stop-loss distance is unreasonable, or trading costs are underestimated.

Today, we compare three common position-sizing methods.

I. Fixed Position Sizing: Invest the Same Amount
post-image
Load More

Join 40 M users in our growing community

⚡️ Join 40 M users in the crypto craze discussion

💬 Engage with your favorite top creators

👍 See what interests you

Trending Topics

USAIStocksHitHard

15.28k Views3.64k Discussing

U.S. stocks sold off sharply on Thursday, November 5 (UTC). The Nasdaq closed down around 5.5%, entering correction territory, while the Philadelphia Semiconductor Index plunged roughly 12%, with chip stocks including $NVDA and $AMD posting steep losses. Beyond profit-taking, investors are growing concerned about the pace of AI data center construction, capital spending, and future returns on investment. The key question now is whether the AI sector’s lofty growth expectations need to be repriced. Where do you think the next opportunities will emerge: chip stocks, tech giants, or other sectors?

USNonfarmPayrolls

22.89k Views4.25k Discussing

StakeOnLaunchpoolToShare450KVLX

2.02k Views773 Discussing

View More