


Square
Following
Hot
News
Profile
Share your thoughts
placeholder
Article
🔐 Does holding your private keys mean you truly own your digital assets?
Not necessarily. It doesn't necessarily mean you can transfer all your assets without restrictions.
Private keys determine who can authorize transactions, but smart contract rules can also affect whether transactions can be executed.
Some contracts may include pause mechanisms, address restrictions, or upgrade permissions. However, the specifics must be assessed based on the actual code and permission settings; they cannot be generalized.
To assess control over your assets, you need to understand the rules they follow as
🌈 Gate Live Streaming Inspiration - Nov.5
Today's Topic Recommendations:
🔹Democrats Sweep Both Chambers of Congress as the Dow Surges Over 3%! But AI Stocks Fall Across the Board. Is a Major Sector Rotation Underway in U.S. Stocks?
🔹KOL View: Tom Lee Remains Bullish on the AI Trade! With Tech Stocks Facing Repeated Sell-Offs, Is This a Crisis or a Buying Opportunity?
🔹Chip Stocks Are Falling, but Demand Hasn't Weakened? With Democratic Regulatory Expectations Shaking Markets, Are Semiconductor Stocks Being Unfairly Punished?
🔹OpenAI Uncovers 948 Linux Vulnerabilities in One Run! As AI-Pow
post-image
DOW-3.21%
OPENAI-0.04%
BTC-0.65%
Trenches
ZIG
Z
bade
b
ZIG
0x8c...1145
Market Cap
$.
Change
.
24h Vol
$.
Holders
.
BTC
B
bade
b
BTC
C5xp...pump
Market Cap
$.
Change
.
24h Vol
$.
Holders
.
HIGH
H
bade
b
HIGH
7ymF...high
Market Cap
$.
Change
.
24h Vol
$.
Holders
.
STONK
S
bade
b
STONK
6GmA...UNgx
Market Cap
$.
Change
.
24h Vol
$.
Holders
.
LEEROY
L
bade
b
LEEROY
98HE...pump
Market Cap
$.
Change
.
24h Vol
$.
Holders
.
Market Review of the Congressional Power Shift: Democrats Take Control of Both Chambers; Why Bitcoin Fell Before Rebounding
I. Key Event: A Shift in Power in the U.S. Congress
In this U.S. election, Democrats staged a major comeback, winning seven key Senate seats and taking control of the House of Representatives, completely reshaping the balance of power in Congress.
The vote was essentially a collective backlash by voters against surging oil prices, the situation in the Middle East, and the previous administration’s policies. It also directly changed the regulatory outlook and political env
BTC-0.67%
Still holding steady at 0.01
post-image
  • 4
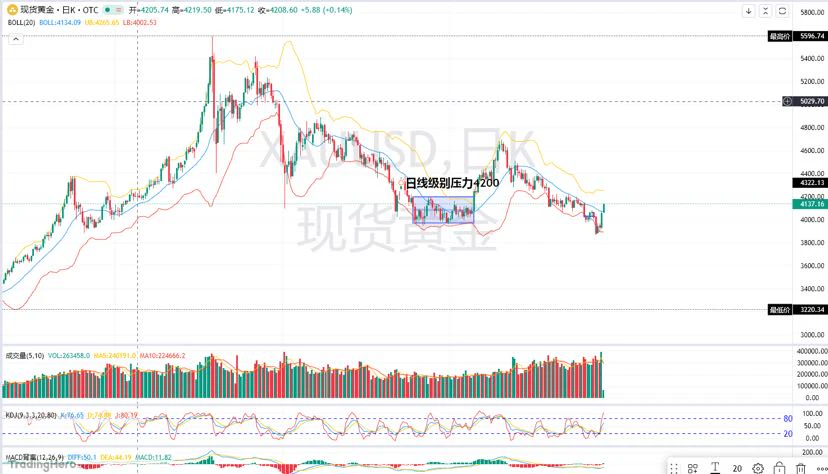
The daily chart is currently facing resistance at 4200. Price spent a long time consolidating inside this blue box previously, with the top of the range around 4200, a high-volume area. It is now approaching this level. Once it touches 4200, there will be trapped buyers all the way above, along with panic sellers from when price previously broke below this level. 4200 is currently the toughest ceiling hanging over the bulls. A high-volume breakout and hold above it would confirm a genuine daily-chart reversal. If price cannot break through, it will most likely continue to form a base.
Why was
post-image
XAU+0.38%
XAUT+0.34%
BTC-0.65%
  • 1
MORNING MARKET UPDATE
live-cover
LIVE1,478
#BTC重返8万 #每周来晒 #广场交易达人 #WCTCS9 BTC Market Analysis
BTC is currently around $80,650, up 4.9% in 24 hours, and has indeed reclaimed the $80,000 level. But this rebound has mainly been driven by short liquidations, while spot inflows have yet to catch up, so near-term price action is more likely to be choppy.
Here are the main things to watch
ETF flows: There have been cumulative net outflows of about $1.157 billion over the past three trading days, so this source of buying has yet to return.
U.S. stocks and macro factors: Falling Treasury yields and a rebound in U.S. stocks have supported this r
ThisIsTranslateContent:
#BTC重返8万 #广场交易达人 #WCTCS9 BTC Price Analysis
BTC is currently around $80,650, up 4.9% in 24 hours, and has indeed climbed back above $80,000[1]. But this rebound is mainly driven by forced short covering, while spot market inflows have yet to catch up, so near-term trading is more likely to be choppy.
Key factors to watch
ETF flows: Net outflows totaled around $1.157 billion over the past three trading days, so this source of buying has yet to kick in.
U.S. stocks and macro: Falling Treasury yields and a rebound in U.S. stocks have supported this recovery; U.S. employment data on November 6 will affect rate expectations.
· Leveraged positions: When the price quickly rebounded from $75,700, concentrated short liquidations amplified the gains. This type of buying often lasts only until the positions are closed.
Several key price levels
$81,000–$82,000: Near-term resistance; a move up to this level could easily be followed by a pullback.
$80,000: The key support level now. A daily close below it could lead to another test of around $77,600.
$85,000–$87,500: The area with the heaviest concentration of underwater holders and sell orders, making a near-term breakout difficult.
Two possible scenarios
If BTC holds above $80,000, ETFs see consecutive inflows, and trading volume expands: upside opens up, with $90,000 as the next target.
If BTC falls back below $80,000: Previous downward pressure will return, and the price could retest $77,600.
For now, trading within a range looks more suitable. Wait for ETF inflows to return and for the daily close to hold above $80,000 before deciding whether a new uptrend has begun.
Whether this rebound can last mainly depends on whether new money enters the market. A price rise accompanied by inflows into ETFs and stablecoins would indicate a more sustainable move.
On-chain data: See who holds the coins
Exchange balances: A decline means coins are being withdrawn and held, easing selling pressure; a rise suggests people are preparing to sell.
SOPR: Above 1 means most sellers are making a profit; below 1 means people are selling at a loss.
Long-term holder activity: Little movement in older coins suggests large holders are not selling.
Realized market cap: If it rises along with the price, that suggests new money is entering; if only the price rises, existing funds are probably just changing hands.
Market indicators: See whether money is flowing in
ETF net flows: Consecutive days of net inflows would show institutional buying has returned.
Total stablecoin market cap: A rise means money on the sidelines is still waiting to enter.
Trading volume: A rally on rising volume is much more solid than one on declining volume.
Funding rates: A return to neutral means leveraged chasing has cooled, making the market healthier.
Watch for these signals
Bullish: Consecutive ETF inflows, growth in the total stablecoin supply, and closes holding above $80,000.
Bearish: A fall below $80,000, a return to net ETF outflows, and a marked increase in exchange balances.
ETF outflows have yet to show a consistent slowdown, and the total stablecoin supply has not reached a new high, so this looks more like a short-term rebound; a trend reversal still needs confirmation from fund flows.$BTC

repost-content-media
BTC-0.67%
  • 4
$ETH ‌
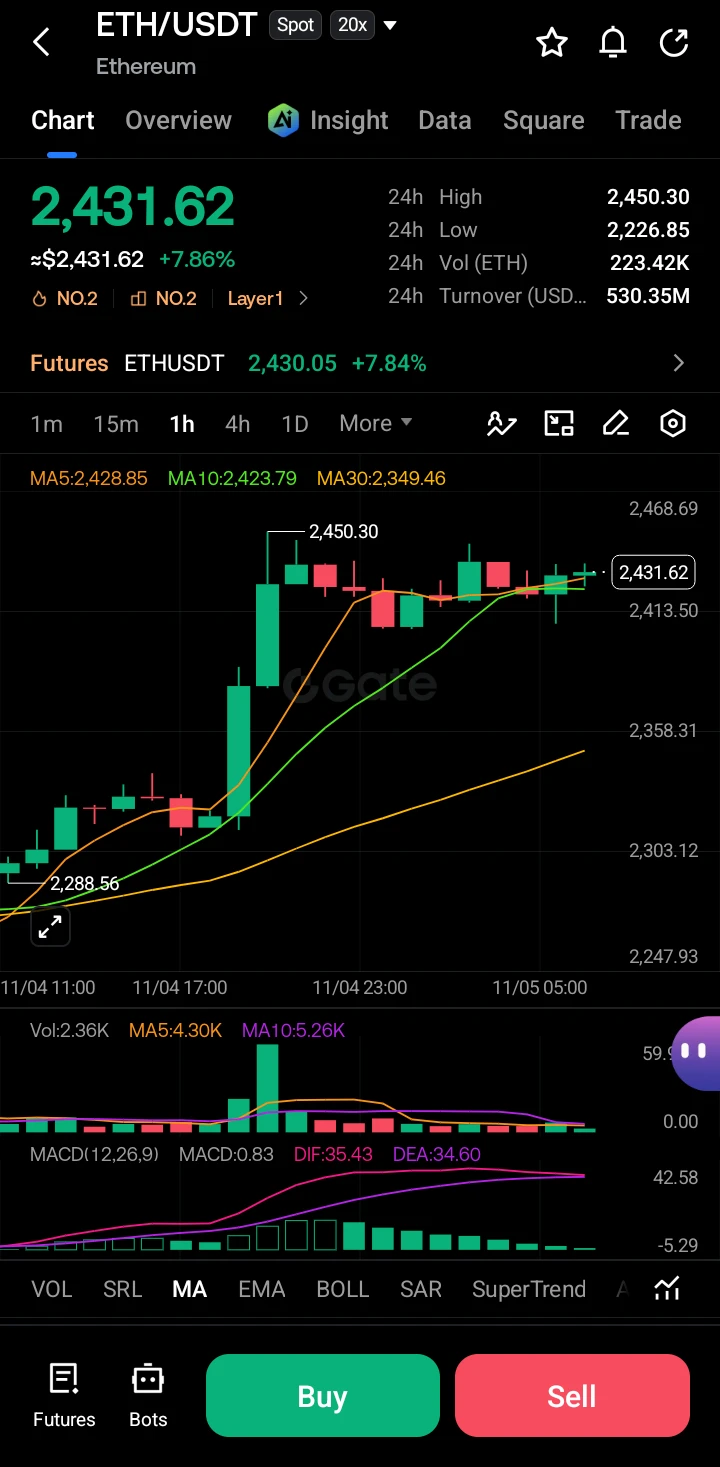
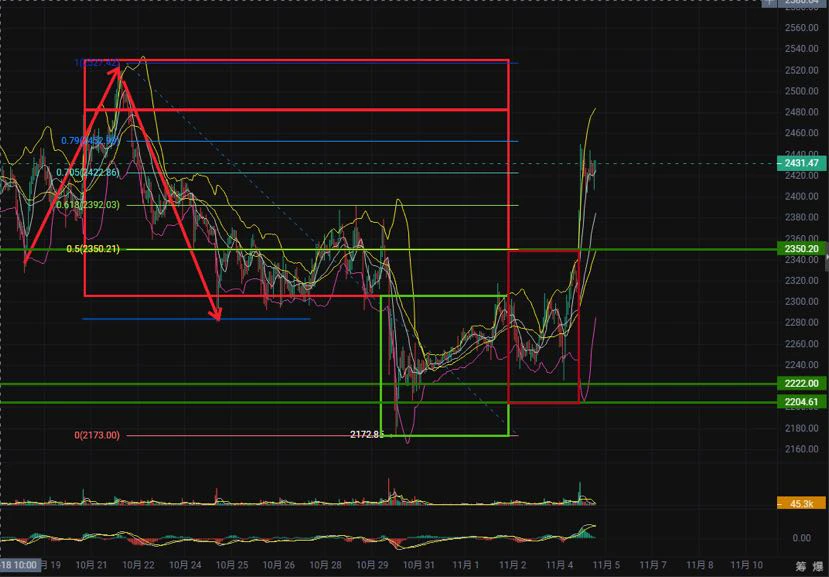
ETH/USDT is showing strong bullish momentum, currently trading at 2,431.62 (+7.86%). After a massive impulsive breakout from the 2,289 level, the price hit a high of 2,450.30 and is now entering a high-level consolidation phase, holding tightly near its recent peak.
· Resistance: 2,450.30 (Recent Swing High)
· Immediate Support: 2,423 - 2,428 (MA5 & MA10 cluster)
· Strong Support: 2,349 (MA30 dynamic support)
The 1H chart displays a textbook pump followed by a tight flag formation. Price is resting perfectly on the MA5 (2,428) and MA10 (2,423), showing buyers are aggressively defending
post-image
ETH-1.26%
  • 8
  • 2
December Rate Hike Expectations Heat Up! If Nonfarm Payrolls Deliver a Strong Report, Does the Fed Still Have Reason to Wait?
The Fed’s biggest headache right now may not be an economy that’s too weak, but one that’s holding up too well! If the labor market continues to show resilience and consumer spending and wages remain strong, inflation could prove harder to bring down. That would naturally fuel discussion of a December rate hike. But rate hikes aren’t decided by a show of hands based on employment figures alone; the inflation outlook, financial conditions, and the economy’s ability to wi
GT-2.24%
  • 18
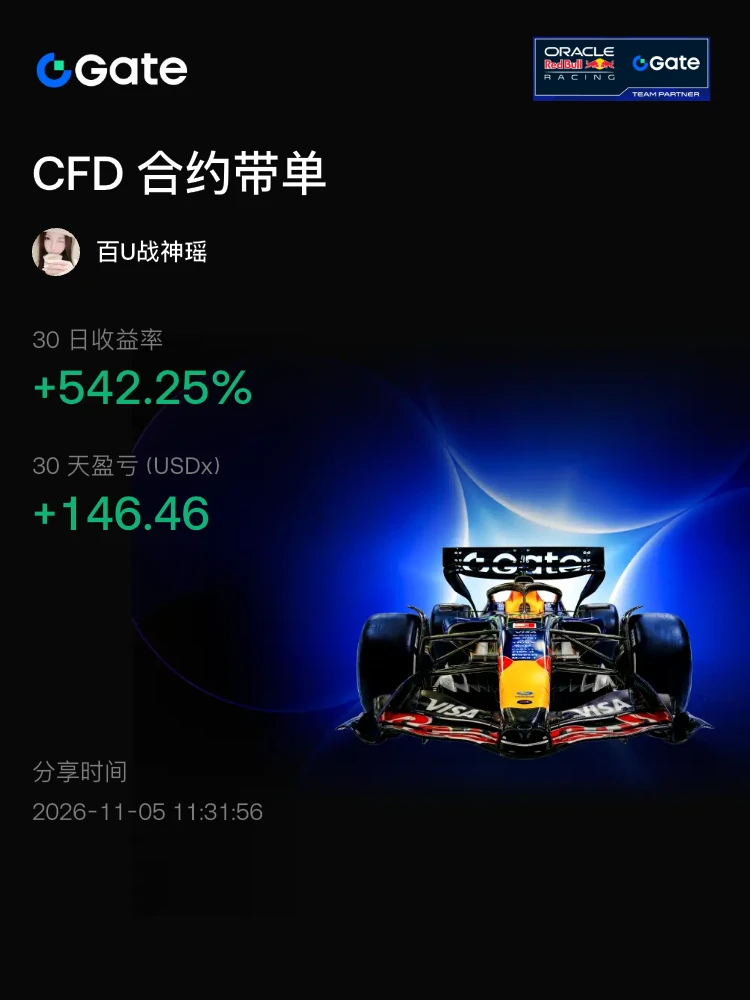
Profiting from both longs and shorts in a single day—that was November 4.
Short when it’s time to short, go long when it’s time to go long, with every directional switch perfectly timed. Not one losing position held, not one trade left waiting to break even.$BTC ‌$ETH ‌#BTC重返8万
post-image
BTC-0.65%
ETH-1.23%
The overall climate really is bad right now: hiring an all-purpose workhorse, with nightclub duties included, salary 5,000 a month, one day off per week 😰
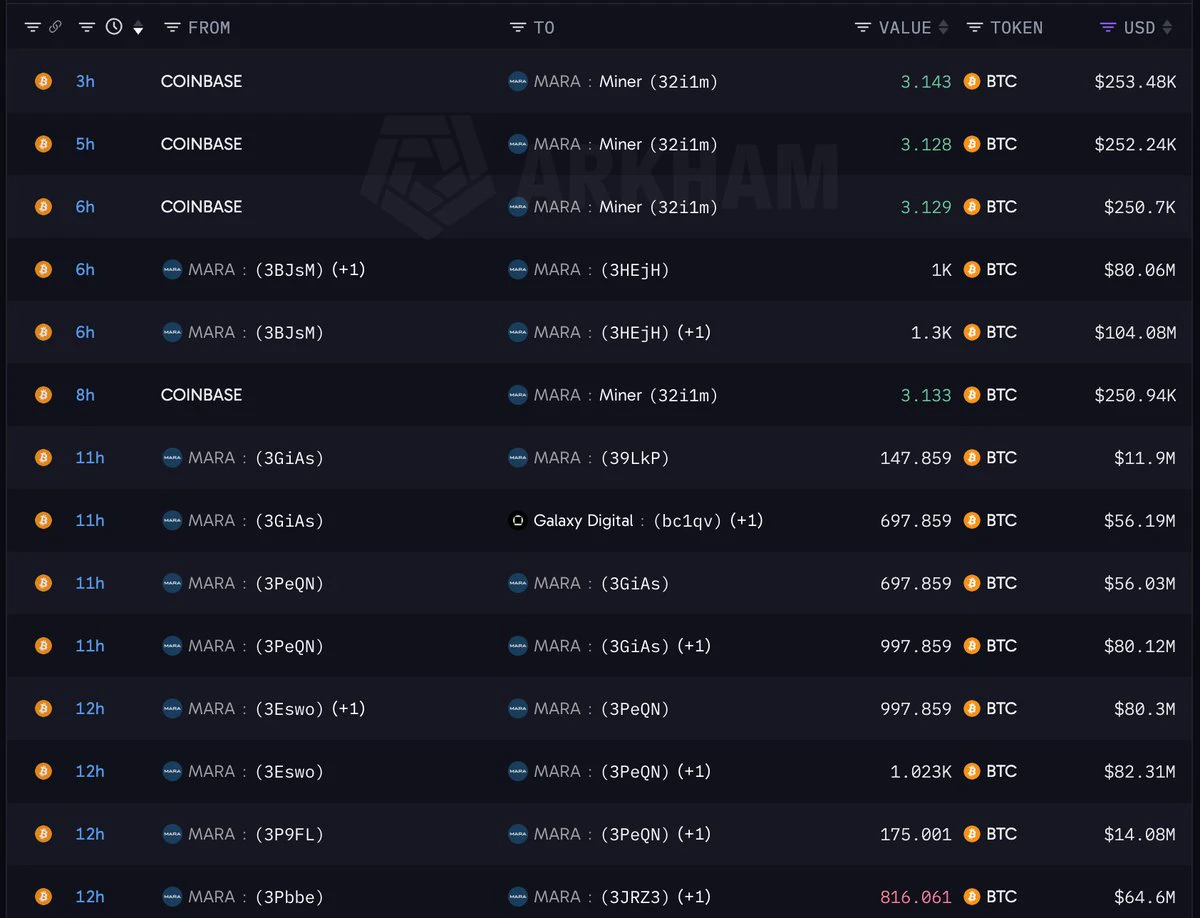
Bitcoin miner MARA Holdings (@MARA) appears to be dumping $BTC again.
Over the past 12 hours, #MARA transferred 1,650 $BTC ($132.8M) to Galaxy Digital, Copper, and other platforms.
post-image
BTC-0.67%
MARA-4.24%
GLXY-16.94%
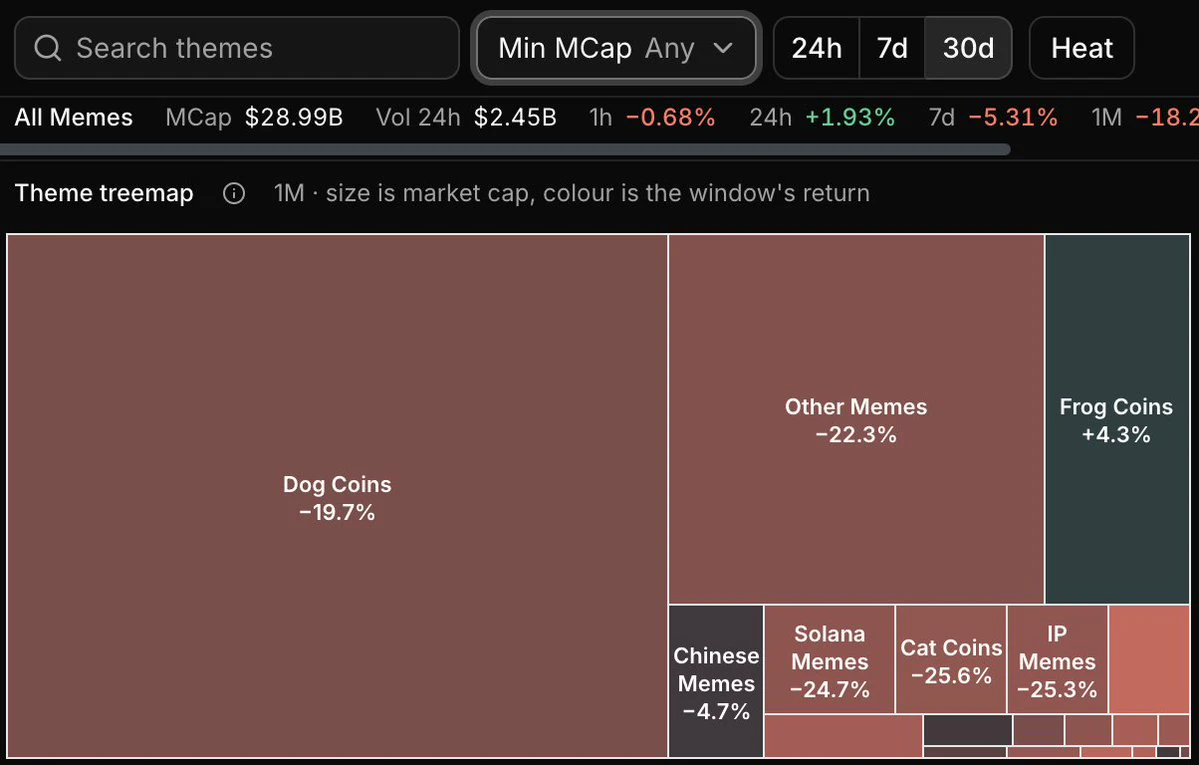
Over the past 30 days, in the Meme market, all sectors broadly saw significant pullbacks except the Frog Coins sector led by $PEPE , which edged higher.
The overall Meme market cap is currently around $28–29 billion, down about 81% from its December 2024 peak of around $150.6 billion.
Personally, I think Meme will persist as an asset class over the long term, but its form will change. The old mass-production model no longer works; the quality bar will rise. The projects that survive in the future will mostly have strong communities, powerful cultural symbols, or some real-world use cases layer
post-image
MEME-0.94%
PEPE+0.97%
morning updates
live-cover
LIVE1,879
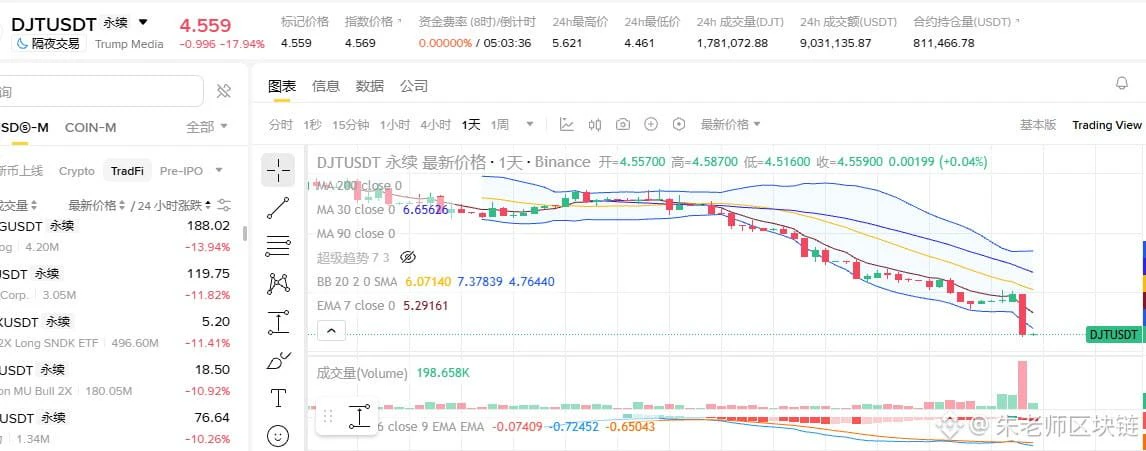
Everything Trump-related, from stocks to crypto, is getting absolutely crushed! 😂
post-image
TRUMP-0.95%
  • 8
  • 2
11.5 ETH public strategy
[Short strategy] $ETH
  Entry range: around 2480-2500
  Stop-loss: 2520
Take-profit tiers
  First target: 2460
  Second target: 2420
Third target: around 2380
Fourth target: below 2350
Trading factors: Price has returned to the upper Bollinger Band, creating short-term selling pressure. Short-term moving averages are turning upward, and short-term bullish momentum is strong. This is a recovery pattern after being oversold, with the rally outperforming BTC. Market depth shows a slight bullish edge; the ratio is expected to even out, forming a tr
post-image
ETH-1.23%
BTC-0.65%
Bitcoin plunges and rebounds again, putting U.S. policy in the spotlight! Is $80,000 a starting point or a test?
BTC's recent moves have been like a roller coaster, first making bulls' hearts race, then leaving bears questioning their life choices. After briefly falling below a key price zone, it quickly rebounded and challenged $80,000 again, sending market sentiment through a 180-degree turn.
But behind this move, U.S. policy expectations deserve close attention. The U.S. midterm elections have changed the balance of power in Congress, potentially affecting future crypto market structure leg
PEPE+1.05%
AMD+0.88%
  • 1
#BTC重返8万 #每周来晒 In the short term, U.S. policy and political expectations are the main drivers, leveraged liquidations are the amplifier, and geopolitical developments are a background variable—but the three are not on equal footing: “policy sets the direction, leverage sets the amplitude, and geopolitics sets the mood.”

① U.S. policy expectations: the main theme of this market move

The immediate trigger for this move above $80k was the U.S. midterm elections on November 4. When early vote counts indicated that Democrats might win control of both chambers, the crypto market fell; after Trum
BTC-0.67%
  • 5
#BrentCrudeFallsBelow100
Brent Crude Below $95: The Oil Market Is Repricing Geopolitical Risk, but the Supply Story Is Not Over
The oil market is experiencing a major reversal, and the most important development is not simply Brent crude falling below $100. It is the speed at which traders are removing the geopolitical premium that had pushed energy prices significantly higher.
On November 5, Brent crude fell to approximately $93.65 per barrel, while US West Texas Intermediate (WTI) declined to around $86.98. Both benchmarks extended their losses for a fourth consecutive session, following a
XTIUSD-1.45%
  • 9
Dell’s Alienware Area-51 sells out the moment it goes on sale?
A few days ago, when I checked, the 5090 configuration was only A$14,000. With the education discount, it came to around A$12,000—basically getting a whole PC for the price of the graphics card. I hesitated for a bit, and then it was gone.
This time, it came back in stock at a straight A$4,000 increase. The same configuration was A$18,000, or around A$15,000 after the education discount. I hesitated again, and it sold out instantly.
WTF, are 5090s really this in demand now??
I heard standalone 5090s in the US are already going for
Load More

Join 40 M users in our growing community

⚡️ Join 40 M users in the crypto craze discussion

💬 Engage with your favorite top creators

👍 See what interests you

Trending Topics

BTCBackAbove80K

16.93k Views41.11k Discussing

After a sharp dip, Bitcoin climbed back above $80,000 on May 9 and is currently trading around $80,200. Over 50,000 traders were liquidated in the past 24 hours amid fierce long-short battles. The recurring Iran-U.S. tensions remain the primary short-term variable. Following U.S. airstrikes, Iran\'s Revolutionary Guard claimed to have breached the Strait of Hormuz defense line, leaving the ceasefire outlook uncertain. On the technical side, the daily SMA20 ,$77,970 serves as key support, with the RSI recovering from oversold levels to 43. The $80,000 level is both a psychological barrier and a bull-bear dividing line.Holding above it could lead to a challenge at $85,000, while a break may trigger a retest of the $77,000 area.

DemocratsWinBothChambers

15.81k Views417 Discussing

GateLaunchesTaiwanStockTrading

13.86k Views277 Discussing

View More