Share your thoughts
placeholder
Article
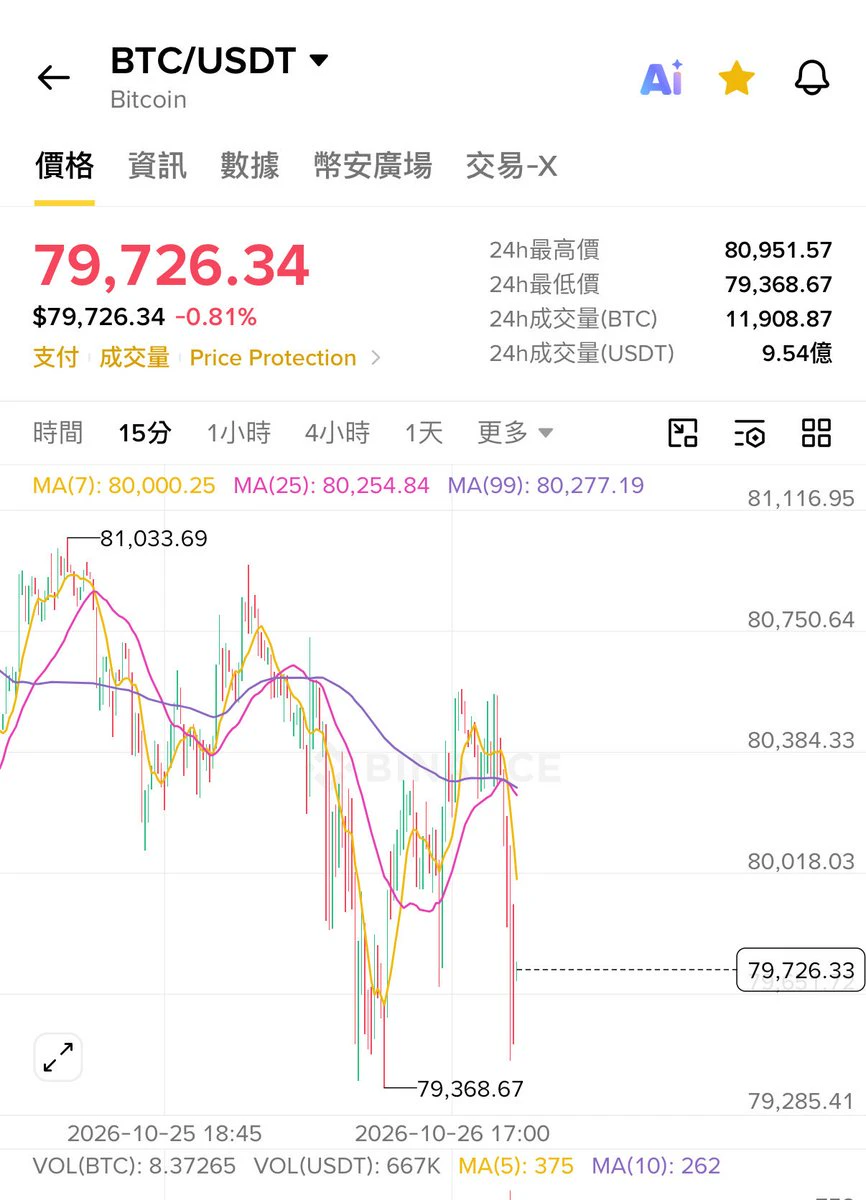
$LINK is showing a clear shift in momentum on the 15M chart.
Price was trading near the $11.82–$11.89 area before a sharp sell-off pushed it down to around $11.48.
Since then, LINK has bounced, but the recovery is still struggling around $11.63–$11.70.
What I’m watching:
• Support: $11.55–$11.48
• Resistance: $11.70 → $11.82
• Key recovery area: $11.82+
If LINK can reclaim and hold above $11.70, the recovery could gain strength. But losing the $11.48 area would make the chart structure more bearish.
For now, I’d rather wait for confirmation than chase the move.
Levels matter more than emotion
post-image
LINK-2.52%
  • 6
To transform
First and foremost, you need to attract cash flow
To attract cash flow
First and foremost, you need to streamline
To streamline
First and foremost, people must be at the center
To do that, there is only one way
Learn
Learn
and Learn
Learn...Learn more....Learn forever.
post-image
This was purely the market being in a good mood and casually tossing out some gold coins, which just happened to hit me on the head 🪙. When I checked the chart after lunch, $ETH was still playing dead, with no volume on the move up and a weak rebound—everything about it looked like it was waiting for a breakdown. I didn’t rush in; I waited for it to break below the line I had in mind before shorting, with an entry price of around 2473.39. I didn’t expect the afternoon move to go so smoothly. At 2448.72, it had already moved a good distance from my entry, and the +174.05% return came in insta
post-image
ETH-0.96%
XRP-4.28%
LAB-27.77%
Market Analysis
live-cover
LIVE1,219
#GateMeme
🐶 BIG CAP VS LOW CAP MEME COINS — WHICH ONE IS BETTER TO TRADE?
Meme coins can look similar, but the trading environment can be completely different depending on their market capitalization, liquidity, and age.
💎 BIG-CAP MEME COINS
• Better Liquidity
Higher market cap usually comes with deeper trading activity and more market participants. This can make entries and exits more manageable, especially when compared with very small tokens.
• Cleaner Market Structure
Big-cap meme coins often have enough trading history for traders to identify recurring support, resistance, momentum, an
Smart money is quietly accumulating silver at these exact levels.

$XAG /USDT - LONG

Trade Plan:
Entry: 64.13 – 64.49
SL: 62.07
TP1: 65.99
TP2: 67.11
TP3: 68.79

Why this setup?
Why now? The daily trend is range-bound, but the 1h ATR of 0.717788 signals a breakout is imminent. The 15m RSI at 28.36 shows oversold conditions, suggesting a reversal is due. The entry zone between 64.13 and 64.49 aligns with the 1h price of 64.31, offering a precise long setup. Targets are 65.99 and 67.11, but the trade invalidates if 65.95 breaks.

Debate:
Are we hitting TP2 at 67.11 or getting trapped by the
XAG-5.28%
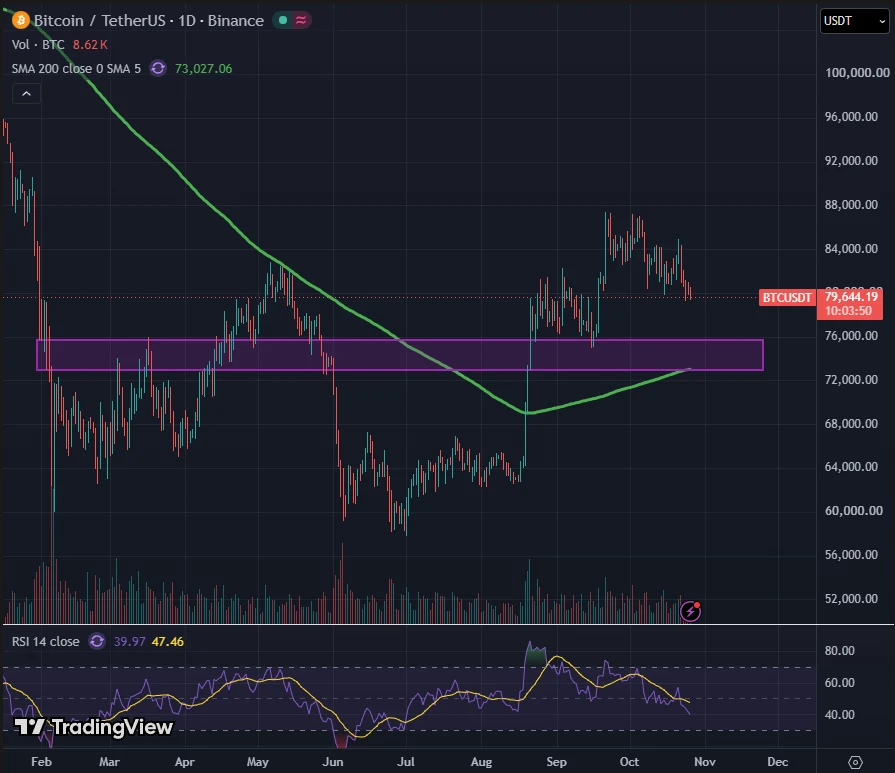
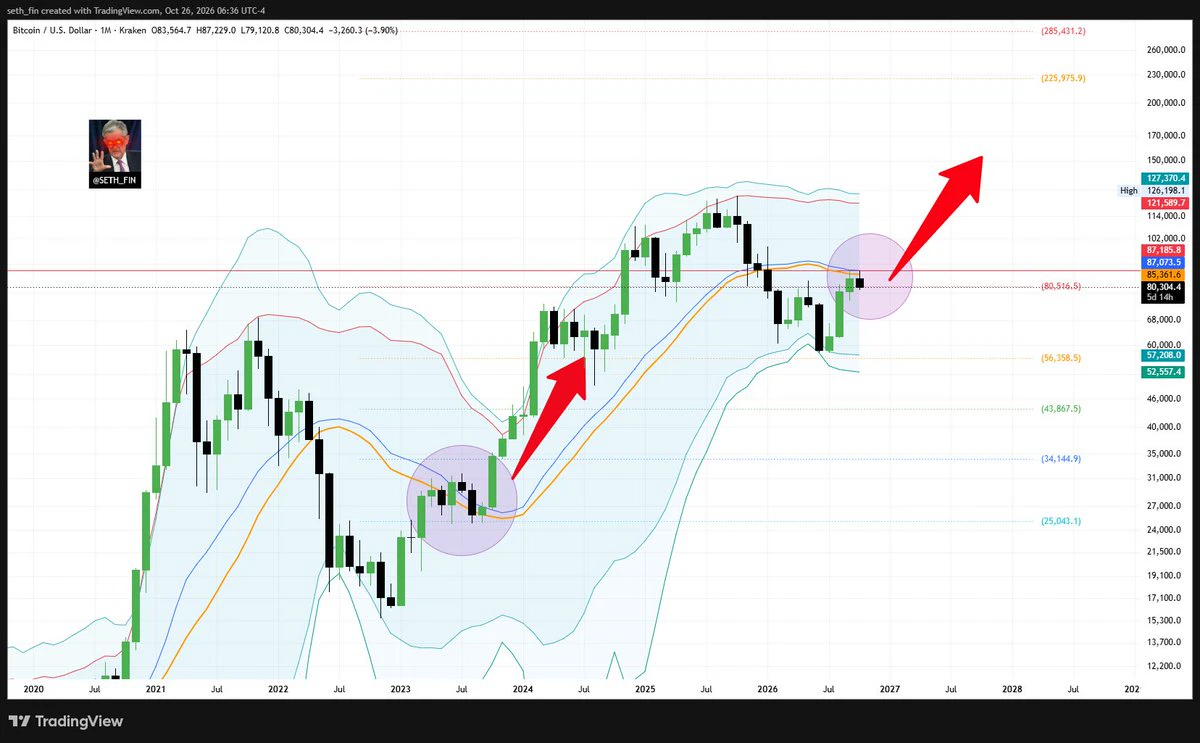
The bottom was so obvious at $57.7K
Yet most retail didn't buy
Not because they didn't want to
But because their economy didn't let them
High interest rate and high inflation made its mark on the common people
#Bitcoin
post-image
BTC-1.72%
Excuse my squiggly
When my girl was 4 she was already out drawing me🤣 BUT, you get the general idea
Setup looks similar to 26 pullback
Does this mean the bull run is dead? Don't think so, NOT YET
Structural break likelier later in cycle
JUICY DETAILS
post-image
No trades yesterday on public challenge
Gonna look to find some today we got some nice wiggle room being + 13k on the week
Been a fun journey so far let’s turn it into 7 fig
Gm:)
post-image
【Subscription-exclusive · 9.11 ETH precise levels】Short position strategy in progress
🔴 Direction: Short 💰 Entry levels: 2,445 - 2,455 (build position in batches) 📊 First tranche: 2,450, 30% of total position 📊 Second tranche: 2,480, 20% of total position (add on rebound) 🛑 Stop-loss: 2,510 (stop-loss on breakout above the previous high, approximately 2.4% loss) 🎯 Target 1: 2,400 (first target, approximately 2.0% profit) 🎯 Target 2: 2,360 (second target, approximately 3.7% profit) 🎯 Target 3: 2,320 (third target, approximately 5.3% profit)
📈 Technicals: The four-hour chart has broken
ETH-0.96%
BTC-1.72%
#FARTCOIN Let the mortal world be our companion, live freely and carefree, gallop on horseback, and share the splendor of this world.
post-image
FARTCOIN-13.05%
While I was away using the restroom, the candlestick chart had already wiped out my losses for me.
That afternoon surge a few days ago looked strong on the surface, but the volume failed to follow. It was simply being pushed up to find someone to be the last buyer. I opened a short position around 0.2933, said little, and simply waited for the outcome.
When I refreshed just now, the price had already fallen to 0.1664, and my unrealized profit had reached +850.56%. The earlier grind was enough to make me want to slam the table, but once it finally played out, the result was genuinely satisfying
post-image
BTC-1.72%
SNDK-4.05%
$LPTH
If this stock wants to continue its rally, it must hold blue average
post-image
LPTH-2.27%
☀️ GM! PPI is about to take the market’s temperature 🌡️
❄️ Cooling down? 🔥 Heating up? Or just right? BTC and ETH are already waiting
👇 What’s your call for the market after PPI?
💬 Join the conversation on Gate Square: https://www.gate.com/post
post-image
BTC-1.72%
ETH-0.94%
Just hit CoinGecko’s trending searches, then the market dumped 6.4%: DOGE’s wave of attention is for unloading
Well, $DOGE had just climbed onto CoinGecko’s trending searches, only to drop 6.4% in 24 hours to a current price of 0.0836. I’m bearish; I see any rebound as an opportunity to unload.
Current status: The intraday range is 0.0823–0.0894. The daily MACD has just formed a death cross above the zero line, while RSI at 54.2 is not oversold; MA7 remains above MA30.
Bearish logic: First, the hype has peaked—the token is trending while the market is dumping; second, longs are crowded—the lon
DOGE-5.66%
With this trend, I don’t even need to think—the account is dancing on its own. The last thing I saw before bed a few days ago, $TAO had held after the pullback, the key level hadn’t broken, and buying pressure was strengthening, so I casually reminded everyone: don’t panic, the structure is still intact. Then I woke up to find it had done all the work itself.

225.0 climbed all the way to 241.8, with +359.83% right there in front of us. It was really sluggish at first, but the result is truly satisfying. Those already on board should be waking up laughing.

Take 70% off first—don’t get gree
post-image
TAO-6.45%
XRP-4.28%
ETH-0.96%
(New Streamer ) Market predictions
live-cover
LIVE1,055
VTHO VeThor. VeChain’s gas token. There is no single major bullish announcement today in public reports; the driver is a surge in trading volume (some data shows spot volume increased more than tenfold). VET itself is also attempting to break out of a multi-year downtrend, with the VIP-255 / InterStellar upgrade on September 16 (aligned with Ethereum’s new features). VTHO has greater elasticity than VET, so it was pushed up first. Intraday volatility is very high, and the high once stood far above the current price.
$VTHO
post-image
VTHO+40.41%
MET trading is very thin. Today is sentiment spillover, not a new narrative.
$MET
post-image
MET+6.00%
$BTC $1T+ Stimulus ≠ Another 2020
Trump’s proposed $5,000 dividend could cost over $1T if approved. �
Reuters +1
But 2020 wasn’t just stimulus.
QE + near-zero rates + falling real yields + weaker dollar created the liquidity regime that accelerated $BTC .
Today, the key question is:
Will new fiscal liquidity reach risk assets — or be absorbed by higher yields and inflation?
For BTC, liquidity matters more than the headline.
#BTC #Macro #Crypto
post-image
BTC-1.72%
Load More

Join 40 M users in our growing community

⚡️ Join 40 M users in the crypto craze discussion

💬 Engage with your favorite top creators

👍 See what interests you