Square
Following
Hot
News
Notifications
Profile
Share your thoughts
placeholder
Article
$ICNT It went live on a major European payment platform on November 17–18, and its price rose from around 0.33 to about 0.52, pushing it into the top gainers during those two days.

Your entry price is in the pullback from that peak.

It then continued lower: down 11.3% on 11/19, flat around 0.34 on the 20th and 21st, and down another 10.5% during the day today. The new users brought in by the launch were a one-off; once the hype faded, the price returned to reflecting real demand.

Today the broader market’s fear index was between 7 and 11, indicating extreme fear, and the crypto market as a
post-image
ICNT-10.47%
AKE+6.39%
  • 2
  • 1
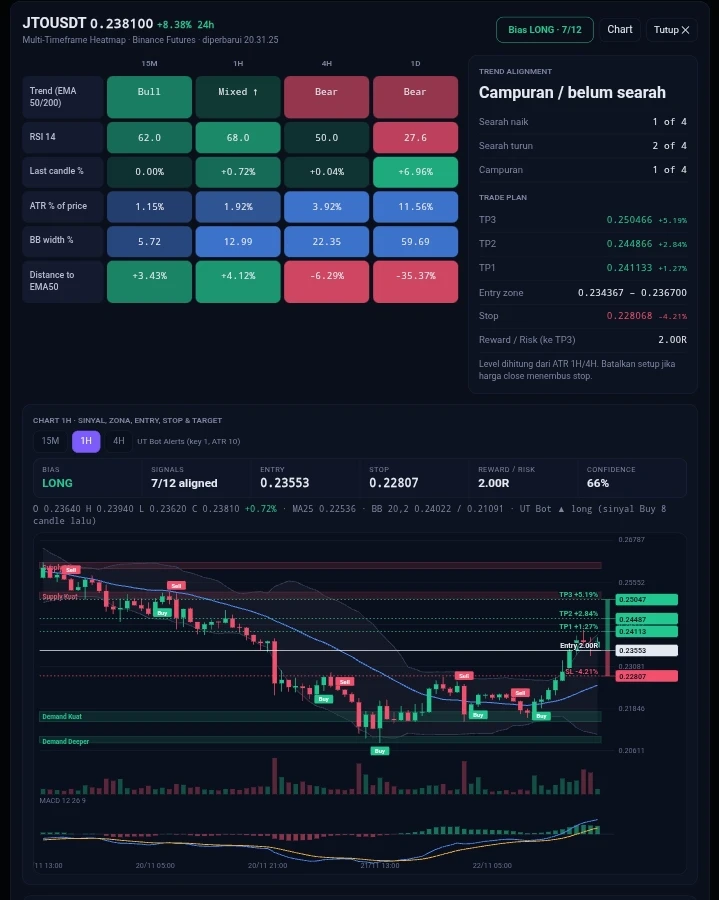
$JTO LONG · Low confidence
Aligned: bias of 12 signals and derivatives analysis are both LONG.
Derivatives data is not yet available; using basic anomaly rules
#NvidiaEarningsInFocus ‌
post-image
JTO-0.68%
  • 1
Trenches
IDOL
I
bade
b
IDOL
0x3b...ab07
Market Cap
$.
Change
.
24h Vol
$.
Holders
.
PIEVERSE
P
bade
b
PIEVERSE
0x0e...25a9
Market Cap
$.
Change
.
24h Vol
$.
Holders
.
JAGENT
J
bade
b
JAGENT
0x8e...ae15
Market Cap
$.
Change
.
24h Vol
$.
Holders
.
Singularity
S
bade
b
Singularity
7R4M...pump
Market Cap
$.
Change
.
24h Vol
$.
Holders
.
CLAUDIA
C
bade
b
CLAUDIA
2j5S...W2ZM
Market Cap
$.
Change
.
24h Vol
$.
Holders
.
I have 30 coins + Bitcoin that I follow for months for trading and investing, and to provide better service to subscribers
But do I stick with them forever? Of course not.
I’m not just a technical analyst who looks at charts; I follow the coins themselves, their projects, and their flows to decide whether to stick with them or remove them from my investment list
I don’t consider any coin a constant unless its continued existence is stable, because money is precious
So when you’re thinking about buying a coin, don’t buy it for the chart
Buy it for its actual movement alone, and then look at the
post-image
#BTCReboundFaces60KTest
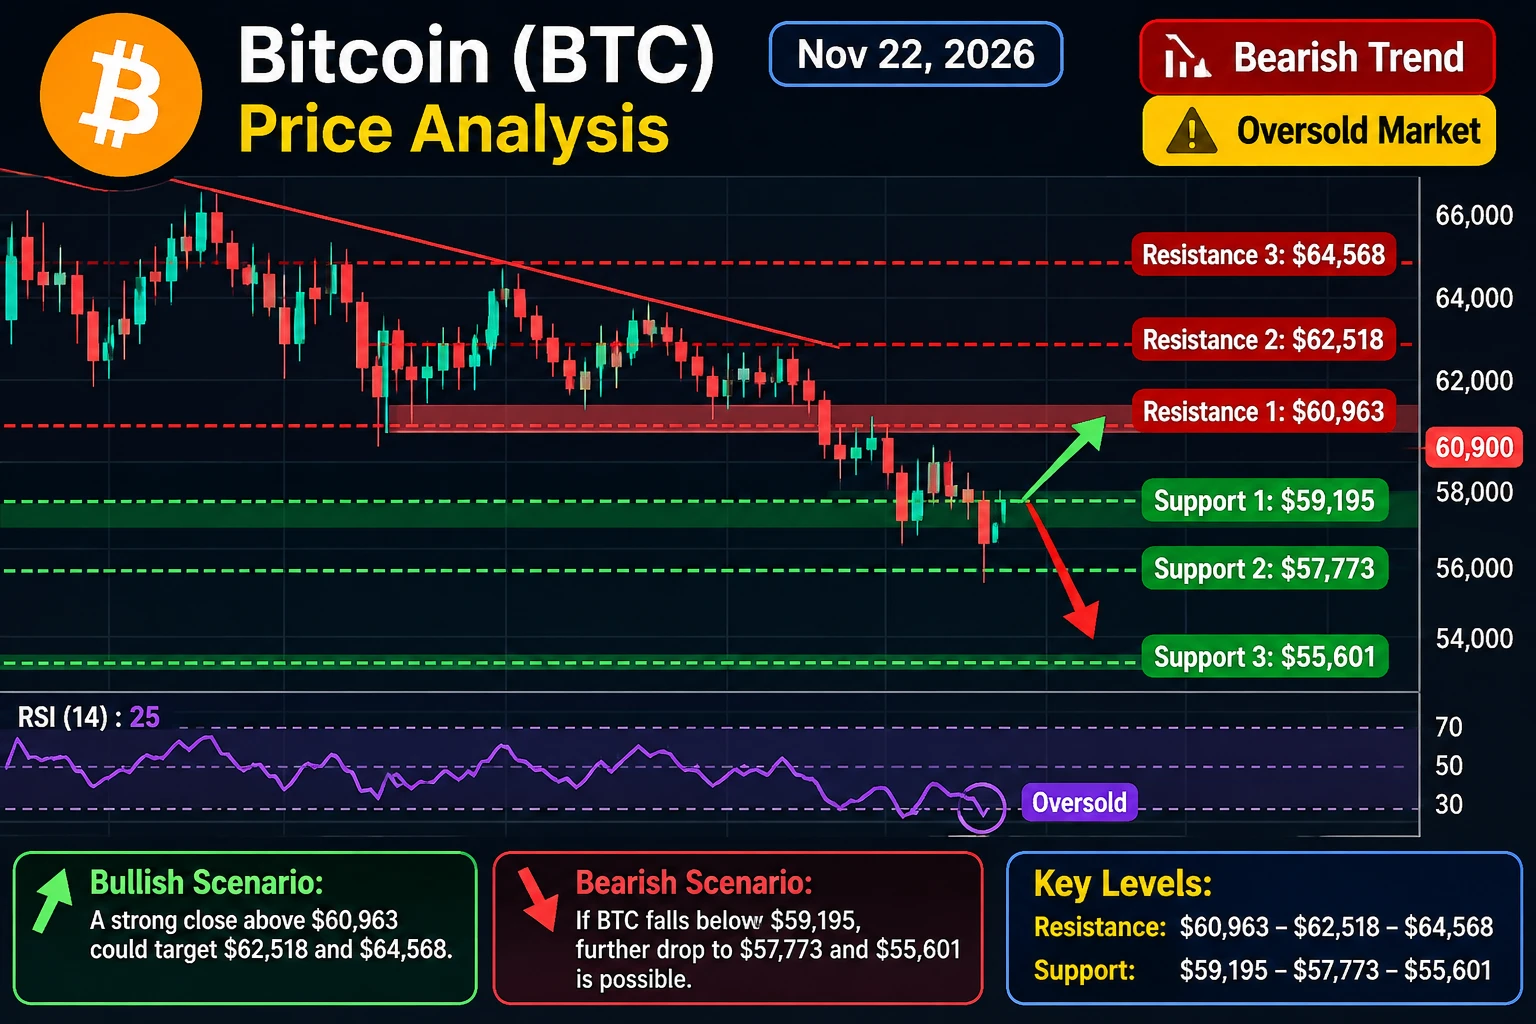
(BTC) Price Analysis – November 22, 2026

Current market overview

Bitcoin is trading around the $60,900 area, showing significant selling pressure. The daily technical outlook remains bearish, although oversold conditions could allow a short-term recovery. COINOTAG +1
| Level | Price |
| ------------ | ------- |
| Resistance 1 | $60,963 |
| Resistance 2 | $62,518 |
| Resistance 3 | $64,568 |
| Support 1 | $59,195 |
| Support 2 | $57,773 |
| Support 3 | $55,601 |
Bullish scenario: A strong daily close above $60,963 could open the way toward $62,518 an
post-image
AAPL-1.83%
RKLB+0.81%
BTC-0.65%
  • 2
🔥 GATE.IO ⚡ | CRYPTO MARKET ALERT | WHATS NEXT FOR BTC? 📊🚀
live-cover
LIVE2,221
BTC-0.67%
SOL-0.77%
ETH-1.26%
What is a dApp?
A dApp, or decentralised application, is an app whose key logic and funds live in smart contracts, not only on a company's server. You usually connect a wallet instead of creating a password account.
The website you click is still often hosted in the normal way, so you must make sure you are on the real site before you sign anything.
📱 Read every wallet pop-up carefully; a fake dApp can ask you to approve a transfer you did not intend.
💡 Key takeaway: a dApp is an app that talks to smart contracts through your wallet.
post-image
  • 1
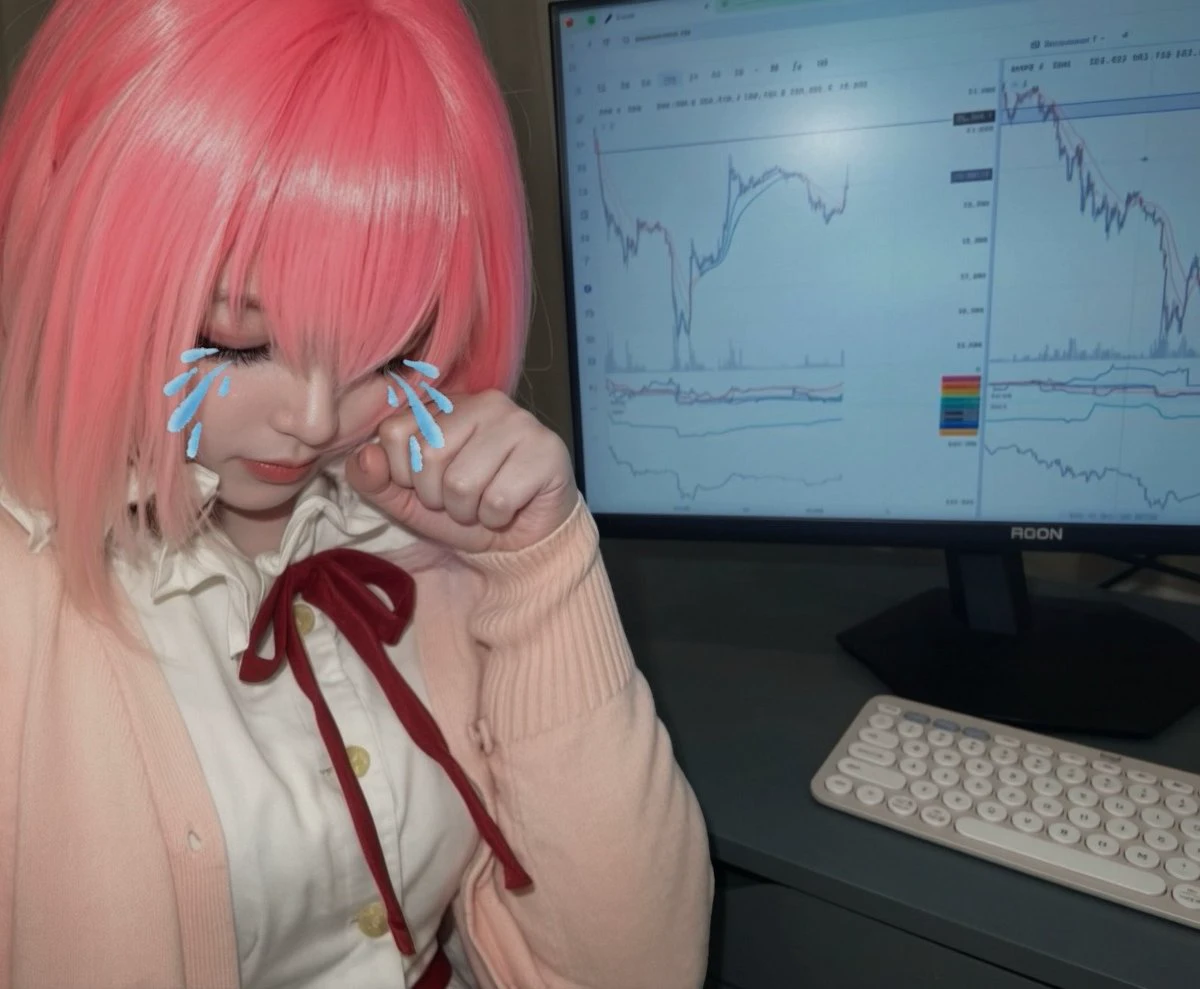
Putting it on gives you the urge to go all in
#FX戦士くるみちゃん
post-image
#BTCReboundFaces60KTest #ShareWeekly

BITCOIN RECOVERS TO $60,750 AFTER BREAKING BELOW $60,000: IS THIS THE START OF A STRONGER BOUNCE OR JUST A TEMPORARY RELIEF RALLY?

Bitcoin is sending an interesting signal to the market. After briefly falling below the psychologically important $60,000 threshold, BTC has recovered to approximately $60,750, bringing fresh attention to the battle between buyers and sellers. This recovery is important because it shows that buyers are still willing to enter the market when prices move lower. However, the bigger question is whether this rebound has enough str
BTC-0.67%
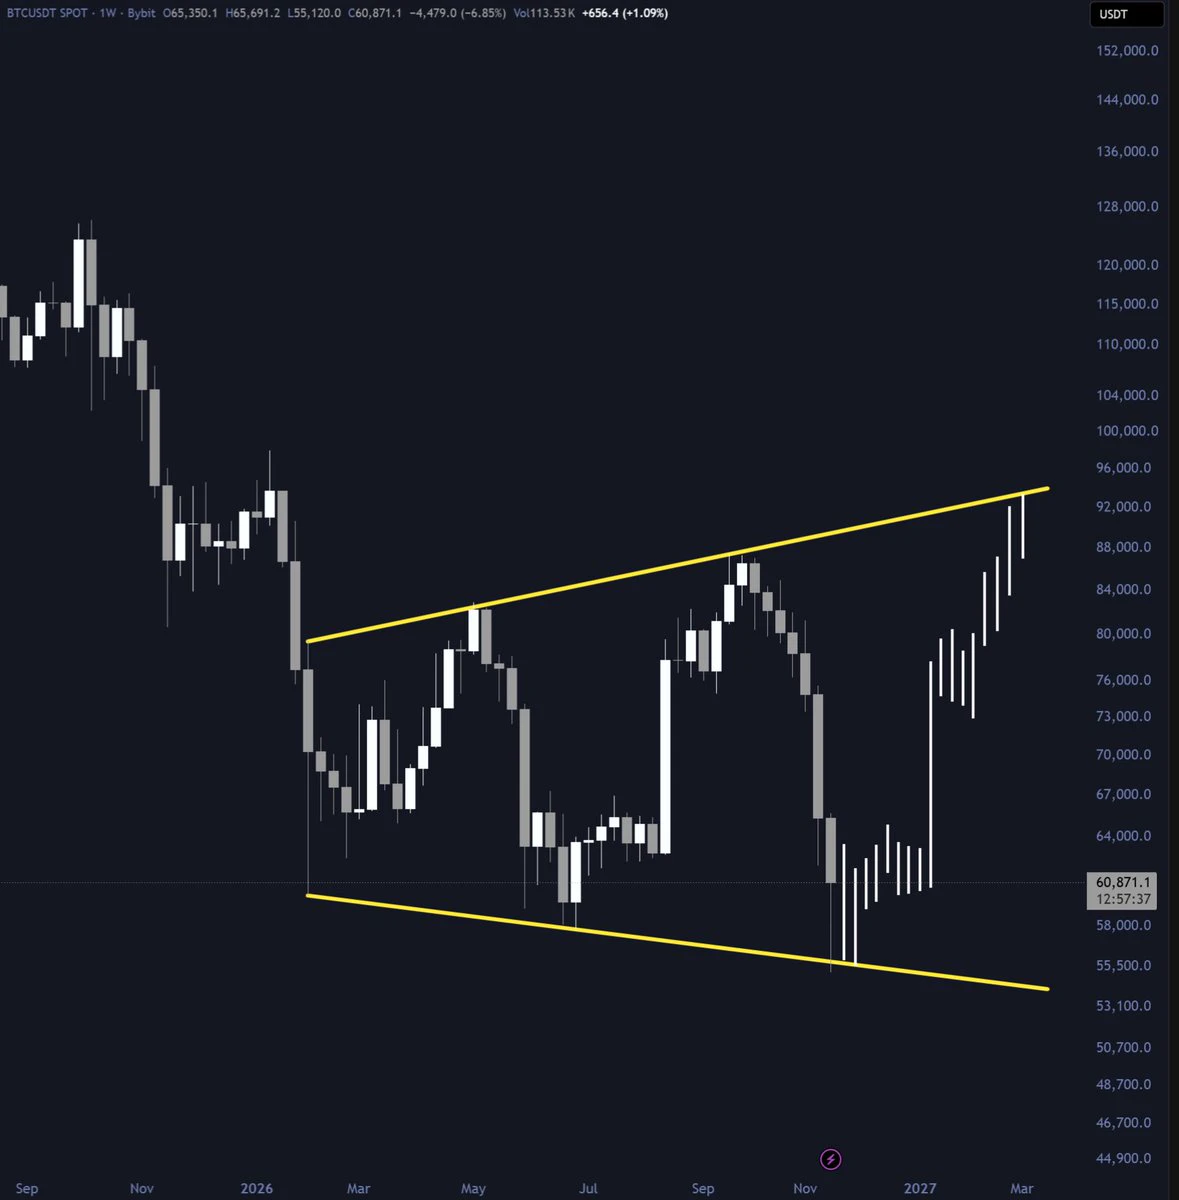
$BTC has tapped the lower channel
Last 2 times this happened, Bitcoin rallied 35% or more
Will history repeat again?
post-image
BTC-0.67%
$ARIA It's up 20.97% in 24 hours, a standout gain lately. Let's compare it with another kind of setup.
First, volume. A trading volume of 17.0M at a price around $0.25 means turnover is solid; this isn't a flimsy pump driven by a handful of orders. That kind of volume means real money is in the mix, not just retail traders hyping themselves up.
Next, the price action. The 24-hour high is 0.2558, the low is 0.2069, and it’s now at 0.2542, closing almost right at the high. It’s like a car holding its gear on an uphill climb—no rolling back, but it hasn’t let up near the top yet. Chasers and earl
ARIA+22.03%
  • 1
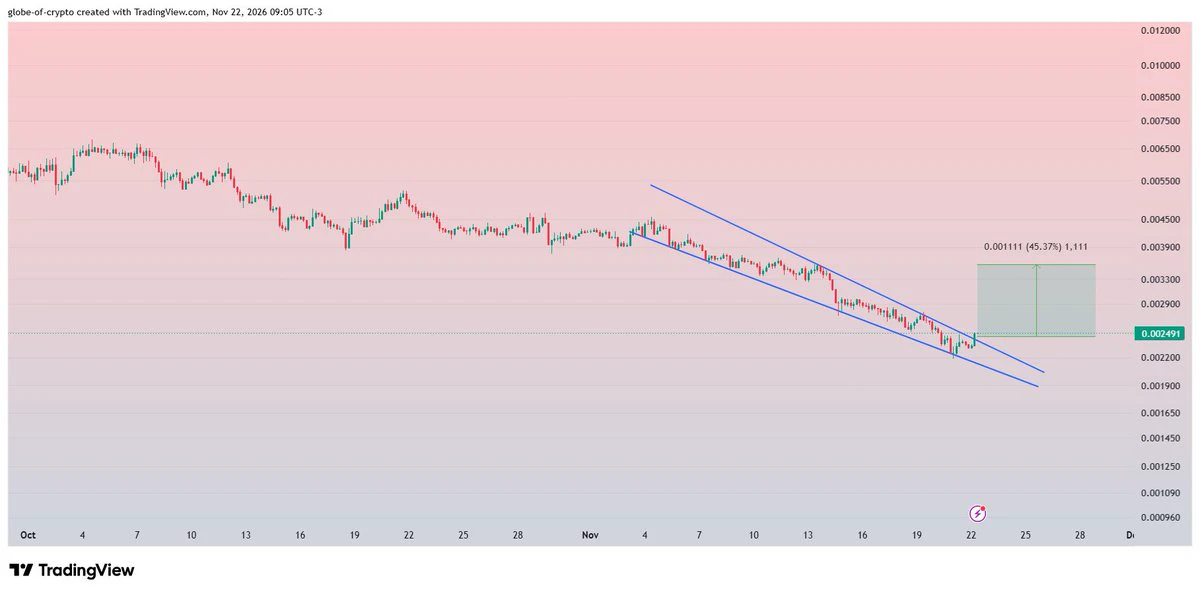
$PUMP #PUMP
Broken Falling Wedge on 4H chart.
Positive retest could provide 40-45% recovery move during coming sessions✍️
post-image
PUMP-8.75%
Bitcoin really did rise as predicted. Nice! I’m waiting and getting ready to enter a short position—bring it on!
$BTC
post-image
BTC-0.67%
  • 2
  • 2
Dear, there’s an old problem with on-chain transfers: once your wallet address is public, your balance, funding sources, and where your funds go can basically all be traced.
Thankfully, @americanfort_io American Fortress gives us another option.
It uses @name instead of an address, so the other party can transfer funds simply by entering your name.
What’s more, a new stealth address is automatically generated for each incoming payment, and your name is not publicly linked to your balance or transaction history.
Users can now reserve a name in advance. Once the wallet launches in the first quar
post-image
BTC Fall below 60k
live-cover
LIVE3,242
BTC-0.67%
#ThreeLaunchpoolProjectsNowLive
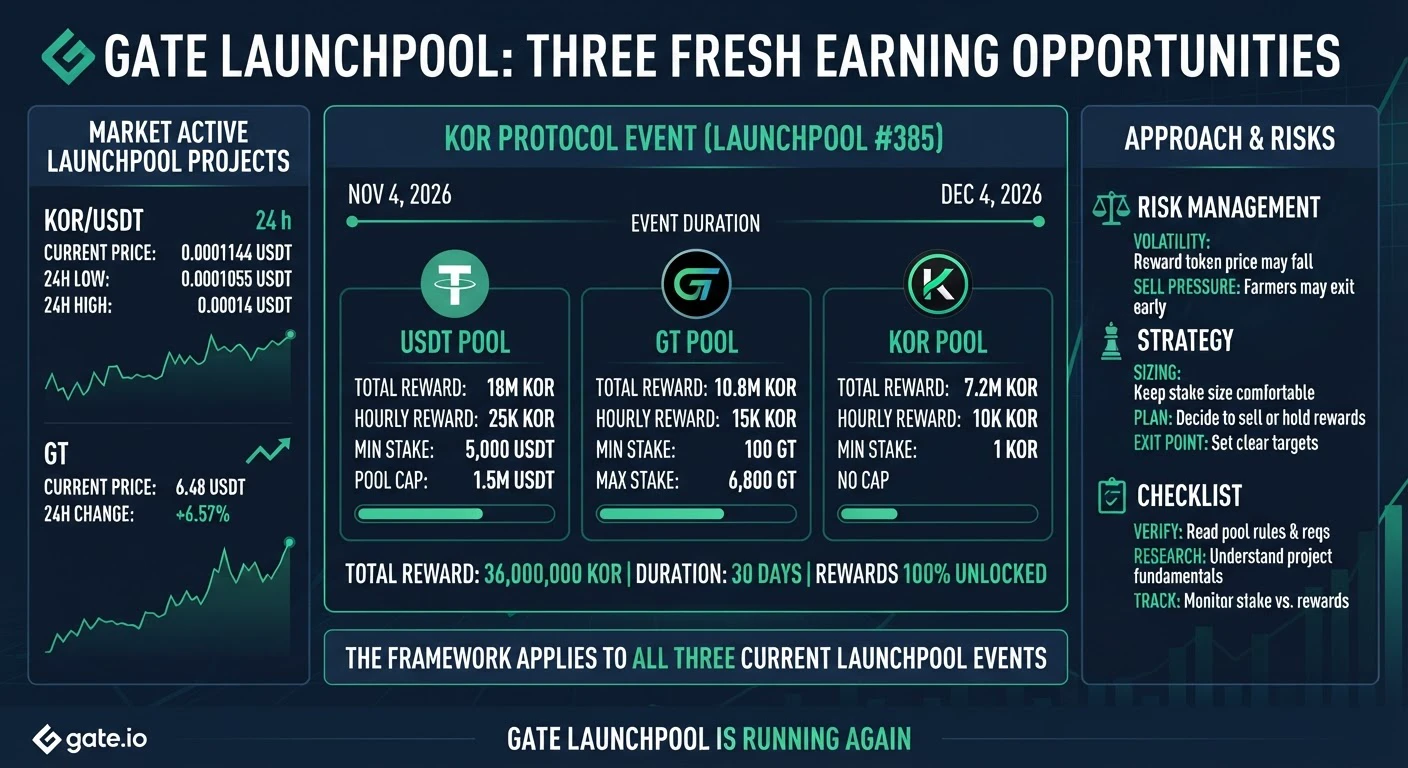
Gate Launchpool Is Running Again: Three Fresh Earning Opportunities, and How I Would Approach Them

Launchpool is one of the most practical ways I know to earn new token exposure without buying at the launch price, and right now Gate has several events open at the same time. The one I want to break down in detail is the KOR Protocol event, Launchpool #385, which began on November 4, 2026 and runs for a full month until December 4, 2026. Gate's bi-weekly report for November 1 to 15 also confirms that Gate launched two Launchpool projects in that window, so the o
post-image
GT-2.41%
BTC-0.67%
ETH-1.26%
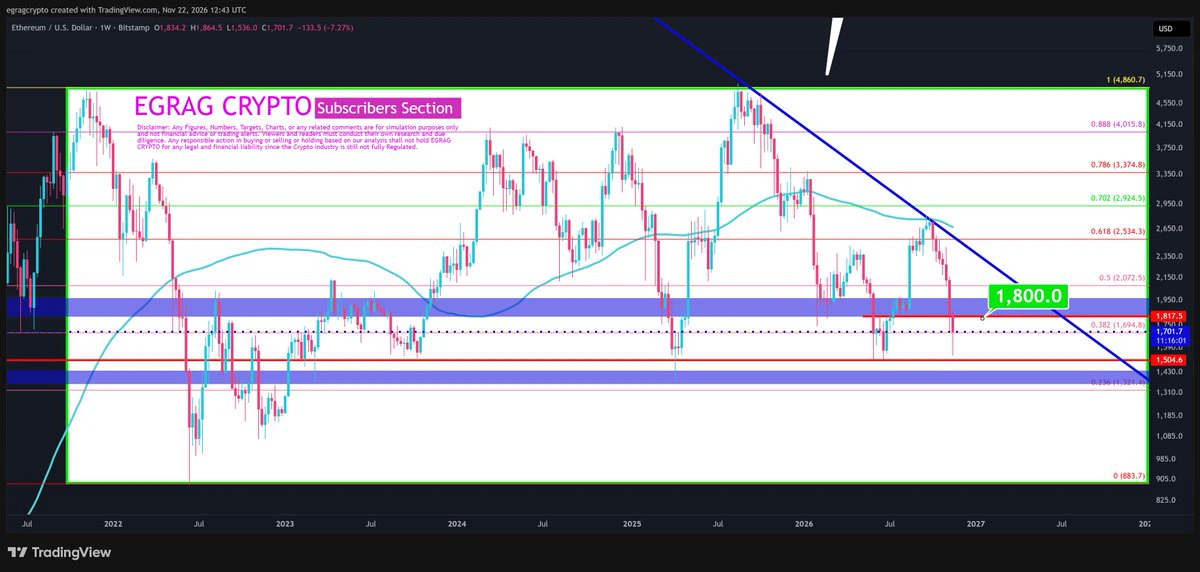
#ETH – $1,800: THE BATTLE FOR THE MACRO BOTTOM! ⚔️🩸
Look at the WEEKLY chart!
#ETH is approaching a critical historical support zone.
🔹 $1,500–$1,695: Potential macro bottoming zone.
🔹 $1,800–$1,817: The KEY level to RECLAIM!
🔹 $2,072: First major bullish confirmation.
🔹 Descending blue trendline: Still controlling the bearish structure.
MY BULLISH ROADMAP:
1️⃣ Hold $1,500–$1,695.
2️⃣ Reclaim $1,817.
3️⃣ Break $2,072 and the descending resistance.
🎯 NEXT TARGETS: $2,534 → $2,924 → $3,375
⚠️ BEARISH SCENARIO:
Lose $1,500 on a weekly basis, and $1,321 becomes the next major support!
MY THE
post-image
ETH-1.26%
🌹Qiuyu | 5 years of unwavering commitment, sharing trade-entry ideas every day
Long-term tracking of price levels + direction, with a consistently stable historical win rate📈GT: Building positions in batches after a sharp drop. 5GT subscription channel open for 3 days👇

https://www.gate.com/zh/profile/秋雨何时了

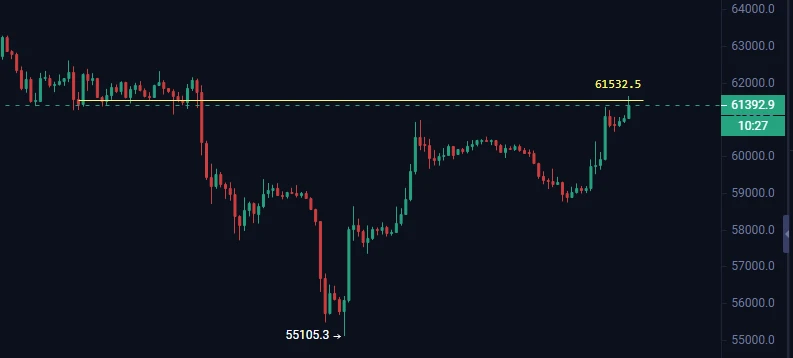
🌹 In two days, it climbed from 55,130/1540 to 61,000/1730. The rise wasn’t luck—it was a structure that took shape while we waited. Four probes of the bottom held; the fifth was the final washout. Once the V-reversal closed, wave five kicked off—
🌹I laid out this rhythm in the strateg
GT-2.41%
BTC-0.67%
  • 1
Why are so many male college students in China sexually repressed these days???
One article to teach you how to deal with sexual repression! Worth bookmarking 👇
#BTCReboundFaces60KTest

CAN BITCOIN HOLD ABOVE $60,000 AFTER BOUNCING OFF $55,300 AND SLIPPING BACK NEAR $59,300?

Will Bitcoin's quick jump back above $60,000 on November 21 turn into real stability, or is the pullback toward $59,300 a sign that sellers are still waiting overhead? After touching lows around $55,300—its weakest stretch since September 2024—Bitcoin rebounded above $60,000 before easing back toward the $59,300 area. Because round numbers act like magnets for both buyers and sellers, watching how price behaves around $60,000 gives a clear window into market strength.
CEO Econom
post-image
BTC-0.67%
#XAU
Gold's Biggest Warning Signal: The Bullish Structure Has Finally Been Broken
Gold was supposed to be the asset investors turned to during uncertainty. Instead, the latest market selloff has exposed a different reality: when the dollar strengthens, interest-rate expectations shift and leveraged positions begin unwinding, even gold is not immune to aggressive selling.

XAU/USD has suffered a brutal correction, falling to approximately $3,514 on November 20 after trading significantly higher earlier in November. The metal lost nearly 9.4% during the week, marking its steepest weekly decline
post-image
XAU+0.38%
Load More

Join 40 M users in our growing community

⚡️ Join 40 M users in the crypto craze discussion

💬 Engage with your favorite top creators

👍 See what interests you

Trending Topics

BTCReboundFaces60KTest

2.1M Views30.1K Discussing

BTC rebounded from around $55,300 on November 21, briefly reclaiming $60,000 before pulling back to around $59,300. The $60K level is back in focus as traders assess whether the recovery can last. Is this rebound a sign of stabilization or a short-lived recovery? Would reclaiming and holding $60K be enough, or do you need confirmation from trading volume and fund flows?

PCEAndGDPDataNextWeek

259.5K Views2.6K Discussing

GateDirectIPOPhase3ANTAllocates92100Shares

837.2K Views5K Discussing

View More