
Share your thoughts
placeholder
Article
📢 Turn Your Content Into Ongoing Subscriptions
If you’re already sharing insights, analysis, or original content on Gate Square, you can now activate Exclusive Subscriptions and offer more exclusive content to your core followers.
Once activated, you can:
✨ Set your own subscription price
✨ Publish subscriber-only content
✨ Earn subscription income through consistent creation
Getting started takes just a few steps 👇
① Go to your profile
② Settings → Exclusive Subscription
③ Set your price & discount → Activate Now
④ Select Subscriber-Only when publishing content
📌 Requirements: Complete ide
post-image
GateLive
📢 Turn Your Content Into Ongoing Subscriptions
If you’re already sharing insights, analysis, or original content on Gate Square, you can now activate Exclusive Subscriptions and offer more exclusive content to your core followers.
Once activated, you can:
✨ Set your own subscription price
✨ Publish subscriber-only content
✨ Earn subscription income through consistent creation
Getting started takes just a few steps 👇
① Go to your profile
② Settings → Exclusive Subscription
③ Set your price & discount → Activate Now
④ Select Subscriber-Only when publishing content
📌 Requirements: Complete identity verification and reach VIP ≥ 1
Turn consistent creation into lasting value.
Activate your Gate Square Exclusive Subscription today.
👉 Go to Gate Square: https://www.gate.com/post
🚀 More details: https://www.gate.com/help/community-center/moments/23369
repost-content-media
Everyone’s staring at the 15m RSI (70.94) while SLX silently prints lower highs on the 4h.

$SLX /USDT - SHORT

Trade Plan:
Entry: 0.07002 – 0.07044
SL: 0.07228
TP1: 0.06869
TP2: 0.06767
TP3: 0.06613

Why this setup?
Why now? The 1D range isn’t your friend—it’s a trap door.
- 4h bias is SHORT (55% conf), but the real tell is the EMA cluster at 0.07023.
- Price is pinned at entry_ref, with TP1 at 0.06869 (a 2.2% drop) and TP2 at 0.06767 (3.6%).
- ATR (0.000855) says volatility is compressed—breakouts get violent.
- The 15m RSI is overheated, but that’s noise. The 4h structure is what
SLX+1.59%
BTC UPDATE
live-cover
LIVE29
I’m watching $BTC here
Short idea (clean & simple):
BTC had a strong run toward $82.2K, but the move got rejected hard. Price has now lost the $81K area and is struggling to build strength below $80K.
Entry: $79,650–$79,900
Targets:
TP1: $79,250
TP2: $78,700
TP3: $77,500
Stop: $80,350
For me, $80K is the key level. As long as BTC stays below it, I’m leaning toward another move lower. A clean reclaim above $80.3K would make me step away from the short.
#Gate60MillionUsers #BTCReclaims80K
post-image
BTC-1.99%
  • 6
  • 1
Crypto Prediction and Trading Insights
live-cover
LIVE1,199
$SNXX 17.2 USD, up 22.95% in 24 hours from 13.96, but don’t rush to chase it! The 4-hour RSI has surged to 88, entering extremely overbought territory. Although this rally has come with heavy volume, the candlesticks have formed three consecutive wicks at 17.48, creating clear upper-wick resistance—a typical surge-then-resistance pattern. More importantly, the MACD red bars are beginning to shrink, signaling that bullish momentum is weakening—this is a warning of a pullback, not confirmation of a breakout. My strategy: cautiously open a small short position near the current price of 17.2, with
SNXX+23.89%
After $DOGE , #SHIB , $PEPE
WHO IS NEXT #100x IN 2026???
post-image
DOGE-3.37%
SHIB-3.02%
PEPE-5.26%
IN+2.35%
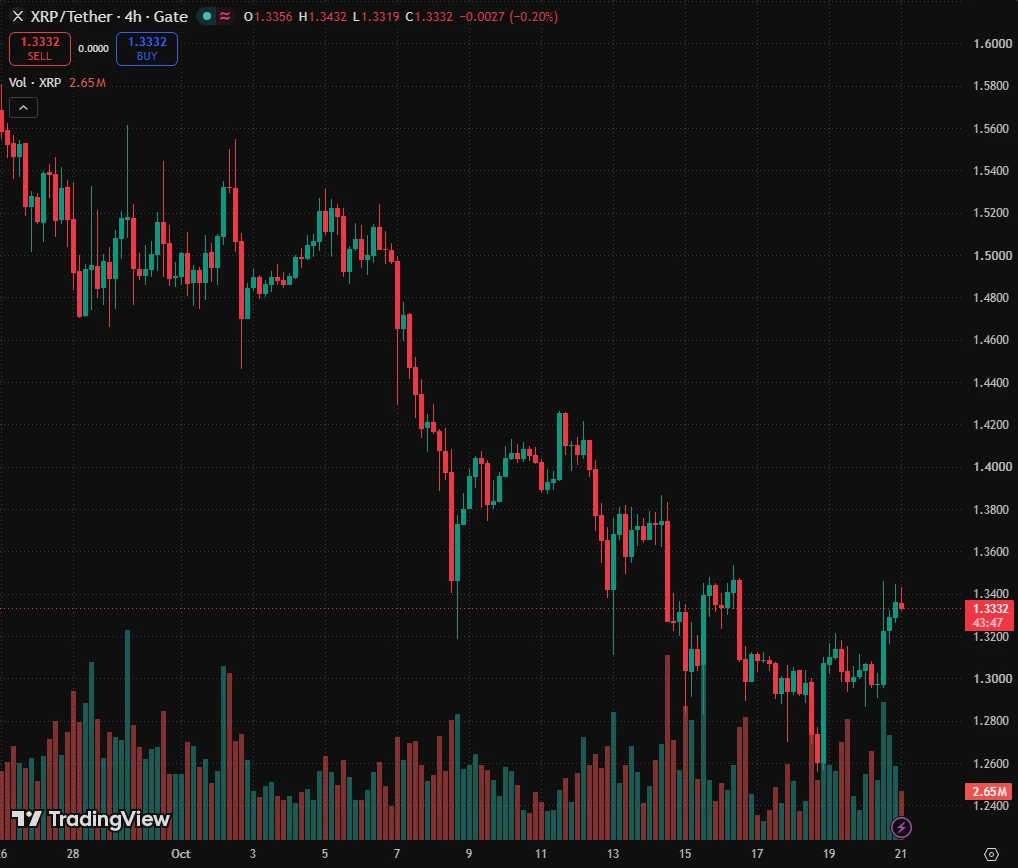
Everyone’s watching XRP’s rebound—but this 4h chart is screaming something else entirely.

$XRP /USDT - SHORT

Trade Plan:
Entry: 1.3900 – 1.3976
SL: 1.4300
TP1: 1.3667
TP2: 1.3486
TP3: 1.3215

Why this setup?
- Price is pinned at 1.3938 with a hard ceiling at 1.4057—that’s your invalidation line.
- RSI (15m) at 38.82 shows momentum is fading, not flipping.
- ATR (1h) of 0.015 suggests low volatility = compressed spring, but direction remains SHORT with 55% confidence.
- The range-bound 1D trend means we’re not breaking out; we’re rejecting.
- Why now? Because 1.3900–1.3976 is the l
XRP-3.62%
$MU Bitcoin’s next big test is TODAY
BTC is hovering near $76.5K–$77K after US strikes on Iran spiked oil past $94 and revived inflation fears. Now the US jobs report drops today — and it lands into a market already pricing ~60% odds of a September Fed rate hike.
A hot number = more hike pressure = more heat on crypto.
A weak one could flip the whole mood.
Two macro bombs in one week, and BTC’s still outperforming gold and stocks.
Are you positioning before the print or waiting for the dust to settle?
MU+5.89%
  • 1
$4 Signal】1H volume breakout, bullish continuation
$4 broke above the upper Bollinger Band on heavy 1H volume, while the 4H MACD shows bullish expansion and the current price is hugging the outer channel. RSI 79.9 is flattening in overbought territory, with a 4.34% order book depth imbalance and buyers slightly dominant. OI is stable, with no signs of a squeeze, and the 0.025% funding rate shows no overheating.
🎯Direction: Long
⚡Entry/Limit Order: 0.02358304 - 0.02365400
🛑Stop-loss: 0.02341746
🚀Target 1: 0.02400881
🚀Target 2: 0.02418622
🛡️Trade Management:
- Reduce the position by 50% up
post-image
4+38.69%
BTC-1.99%
ETH-2.20%
SOL-2.00%
Everyone’s long on ZEC while the 4h chart whispers a trap at 1029.

$ZEC /USDT - SHORT

Trade Plan:
Entry: 1023.23 – 1036.07
SL: 1109.77
TP1: 969.56
TP2: 929.50
TP3: 869.41

Why this setup?
Why now? The 1D trend is bullish, but the 4h signal flips SHORT with 84% confidence. Price sits exactly at entry 1029.65, hugging the 1h pivot. RSI 15m is neutral at 53.5—no exhaustion yet. ATR 1h of 25.67 means a break below 1023.23 accelerates fast toward TP1 969.56. The bull narrative is the bait; the real move is the drop.

Debate:
Is ZEC faking a breakout to 1036 before dumping to 929, or do we fad
ZEC+7.58%
Our $ZEC ... $BMNR Crypto stock, Been in position since $14 zones. Breaks this current pink line level and it explodes ...
It will be like buying ETHEREUM at 25$
post-image
ZEC+7.37%
BMNR-5.48%
ETH-2.20%
$FHE Signal】4H breakdown + selling pressure dominant, clear short opportunity
$FHE 4H MACD momentum is weakening, with price continuing lower after piercing the Bollinger midline. 1H MACD bearish momentum is expanding, while RSI has fallen below the neutral zone. The Buy/Sell order book is clearly imbalanced, with sell orders dominating. Volume is expanding simultaneously, and selling pressure is being released.
🎯 Direction: short
⚡ Entry/limit order: 2439.48 - 2446.82
🛑 Stop-loss: 2471.29
🚀 Target 1: 2410.12
🚀 Target 2: 2391.77
🛡️Trade management:
- Execution strategy: Reduce the posi
post-image
FHE-0.92%
BTC-1.99%
ETH-2.20%
SOL-2.00%
Makes sense!!
Makes sense!!
Who is actually buying this shit and why?
post-image
$1.025 to 0.24 in just 6 candles 😅
I know most of you are confused: "should you buy the dip" or "take a short position expecting it to fall? more..."
My suggestion is simple - the $CYS price is already near the 22-23 support zone. If we see any bullish candles with a strong comeback and volume, blindly take it. But losing support here would add fuel to further lows, with 16-17 being the next major expansion zone. Further lows are possible if sellers dominate.
post-image
CYS-6.74%
September 5 Strategy Plan
Priority ranking, for followers only
Operation priority ranking
Priority 1: Short at 2458–2465 under resistance
This is currently the optimal strategy.
Because the moving averages above are densely suppressing the price, and it has not yet proven a shift to strength.
Priority 2: Go long at 2430–2436 after the decline stabilizes
Suitable for a rebound, but keep the position light and enter and exit quickly.
Must not break below 2422.5.
Priority 3: Go long on a pullback after holding above 2465
This is a right-side confirmation long.
The drawback is that the entry price
post-image
ETH-2.22%
$$Lobster's 29% gain: 87M in trading volume shows you what turnover-based distribution looks like
The price of 0.0938 is stuck between 0.1027 and 0.0711, with trapped holders above and profit-taking holders below. Going long here is just handing fees to the market maker. My system shows that the 0.0711–0.1027 range has already seen massive volume, but the price has failed to make a new high—a textbook distribution structure.
Here's the trading plan: Entry zone: enter only after a pullback to 0.084–0.086 holds; abandon the trade if it breaks 0.083. Stop-loss: 0.0805 (hard stop; a break below me
龙虾+20.94%
#HYPEBreaks88HitsNewAllTimeHigh
🔥 HYPE AT $83.98 — PULLBACK OR THE NEXT OPPORTUNITY BEFORE $100?
$HYPE has just given traders a very interesting setup.
After breaking into a fresh all-time-high zone near $88, HYPE has now pulled back toward $83.98. At first glance, some traders may see this as weakness, but I think the more important question is whether this is simply a healthy cooling-off phase after a powerful breakout.
HYPE recently reached a new record around $88.06–$88.14, while the current market is sitting near the $84 area. The latest 24-hour range has also shown strong volatility, w
HYPE-2.85%
Does $BSV Bsv have a trend similar to ZEC? 🤦🤦🤦
BSV+0.35%
Load More

Join 40 M users in our growing community

⚡️ Join 40 M users in the crypto craze discussion

💬 Engage with your favorite top creators

👍 See what interests you

View More