
Square
Following
Hot
News
Profile
Share your thoughts
placeholder
Article
I knew the market makers would drive it down with a wick, and sure enough, when it fell to 808, I opened a small long and made enough for porridge. I closed at 812.
That’s reassuring. I’m predicting a drop next week, though I’m not completely sure. I was waiting for this wick, and it was part of what I expected. Now that it’s happened, my prediction of a drop next week has a few more points in its favor!
I hope a big drop next week lets me make a little money on shorts too; otherwise, I won’t even be able to afford porridge!
‍$BTC
post-image
BTC-0.52%
$ZEC I went from an unrealized loss of 2,500U to a profit of 900U and closed at take-profit. The price came within 2U of triggering my stop loss, then fell. Thanks for sparing me
post-image
ZEC-2.10%
Trenches
AGT
A
bade
b
AGT
0x5d...e274
Market Cap
$.
Change
.
24h Vol
$.
Holders
.
CNPY
C
bade
b
CNPY
0xc6...ddd2
Market Cap
$.
Change
.
24h Vol
$.
Holders
.
Q
Q
bade
b
Q
0xc0...0589
Market Cap
$.
Change
.
24h Vol
$.
Holders
.
Gato
G
bade
b
Gato
55A3...pump
Market Cap
$.
Change
.
24h Vol
$
Holders
.
FTR
F
bade
b
FTR
DFMt...pump
Market Cap
$.
Change
.
24h Vol
$.
Holders
.
My friend shorted $AGT , $Q and $BTW today. All three. Same day.
His logic was solid: “It’s already up 65%. It can’t go higher.”
$AGT hit 0.1048 and kept going.
Then he said, “Okay, $Q is up 119%. That’s insane. Now THIS one has to dump.” It printed another green candle while he was typing the order.
By then he was angry, so he went for the third one: “$BTW is only up 34%, there’s still room for a clean short.” The chart made a new high and he made a new lesson.
The funny part is that Q’s funding was negative. Shorts were paying longs to stay in the trade. He literally paid a fee to be wrong
post-image
AGT+66.83%
Q+122.30%
BTW+30.83%
  • 1
$APR Down 16% in a day, plunging straight from 0.0478 to 0.0380. It’s now at 0.0399, with 13.7M in trading volume—this isn’t a pullback; someone’s moving out overnight. Here’s the dilemma: is this a golden opportunity or catching a falling knife?
The bullish case: First, the 24-hour low of 0.0380 has been tested twice without breaking, showing signs of short-term support; second, 13.7M in trading volume means liquidity is still there—it’s not a stagnant pool, so you can get in or out; third, after dropping 20% from 0.0478 to 0.0380, most of the short-term panic has likely played out, making a
APR-13.00%
The most unusual detail in today’s market is that the Fear & Greed Index remains in the greed zone at 55, while $SOXLB plunged 8.58% in a single day. Its current price of 86.5 has fallen straight through the lower Bollinger Band at 90.4088, and its RSI has crashed to the deeply oversold level of 17.5. Broader market sentiment has not turned cold, but this asset has already been abandoned by investors—a classic case of outflows from an individual coin within a sector, rather than systemic risk. With BTC trading flat, this kind of divergence often means selling pressure is nearing its end.
Tech
post-image
BTC-0.52%
#DOGE DOGE ETF switches from consecutive net inflows to redemptions! Can the $0.08 support hold?
Dogecoin fever cools! ETF funds flee, with $0.08 becoming a crucial line in the sand🐶
Once wildly popular Dogecoin (DOGE) is now facing a subdued market atmosphere. Dogecoin ETFs had previously seen three consecutive weeks of inflows, but the trend completely reversed in October as institutional funds began to pull out, putting considerable pressure on the price.
📉ETF funds see $540k in outflows over two days.
According to SoSoValue data, spot Dogecoin ETF flows were virtually flat from October 1
post-image
ThisIsTranslateContent:
#DOGE DOGE ETFs switch from consecutive net inflows to redemptions! Can the $0.08 support hold?
Dogecoin hype cools! ETF funds flee, with $0.08 becoming a make-or-break line🐶
Dogecoin DOGE, once hugely popular, is now facing a subdued market atmosphere. Dogecoin ETFs had previously seen three consecutive weeks of inflows, but the trend completely reversed in October as institutional funds began to pull out, putting significant pressure on the price.
📉ETF funds see $540,000 in outflows over two days.
According to SoSoValue data, from October 1 to 9, flows in and out of Dogecoin spot ETFs were virtually flat, with no funds entering or leaving. Instead of a turnaround, a wave of redemptions followed. Around $400,000 flowed out on October 12, followed by another $138,600 on the 13th, bringing total outflows to $540,000 in just two days.
Fund net assets also shrank from nearly $17 million at the start of the month to $14.44 million. The retreat of institutional funds is a major headwind DOGE must now face.
📊The price continues to weaken, with bearish technical indicators.
DOGE is down 14% overall this month. It was still holding at $0.095 at the start of the month, but slid steadily after October 7 and is now trading at around $0.0800.
Although it briefly rebounded to a high of $0.088 on the 12th, the recovery was short-lived, and the price quickly fell again, touching a low of $0.08. Technical indicators are also unpromising: the RSI has fallen below its signal line, while the CMF money flow indicator briefly dropped to near -0.90 and has now recovered to -0.30, indicating that the overall trend of capital outflows remains unchanged.
⚖️Futures market sees a tug-of-war between bulls and bears, with bullish positions weakening.
Signals from the derivatives market are mixed. DOGE open interest first surged to $652 million, then fell to $598 million before edging back up to $609 million. The funding rate remains positive at 0.0088%, indicating that the market still retains some long positions, with bulls continuing to pay fees to bears. However, the overall decline in open interest means bullish momentum in the futures market is weakening.
📌Market Summary and Key Points to Watch
$0.08 is a key short-term support level for DOGE. If it breaks decisively below this level, pressure on bulls will intensify sharply, and the price could fall further. The market is currently weak overall, and the rebound lacks strength, so it is unwise to blindly buy the dip. Watch closely to see whether the $0.08 support holds.#WCTCS9
repost-content-media
DOGE-2.52%
i clicked out after 100% but queue let me run it to almost 2x
gud tek
post-image
$JCT I know exactly how I lost on this trade: I got in at 0.0023 and cut my losses at 0.0019, riding out the full -11.93% drop. I contributed to the panic selling in the 5.4M trading volume. Seeing the price near its 24h low, I thought I’d buy the dip, but ended up buying halfway down. I didn’t admit defeat and exit until it hit 0.0019. During the two days I held the position, my mindset went from “it’ll bounce any minute” to “just don’t let it go to zero.” There’s only one lesson: in a downtrend, it’s better to wait for the falling knife to settle than to try to catch it. 0.0019 is today’s lo
JCT-14.74%
Some things don't need to be seen to be trusted.
Opportunities are reserved for those who are prepared!!!
  • 1
$ELA SEND IT TO THE STARS!
post-image
ELA+1.91%
#USMemoryStocksExtendLosses
#ShareWeekly
US MEMORY STOCKS UNDER PRESSURE: IS THE AI MEMORY BOOM LOSING MOMENTUM OR CREATING A NEW BUYING OPPORTUNITY?
The recent selloff in memory and storage stocks has created a major debate across the technology sector. Micron Technology (MU), SanDisk (SNDK), Western Digital (WDC), and Seagate Technology (STX) are facing renewed selling pressure after an extraordinary rally driven by artificial intelligence infrastructure, data centers, and rising demand for high-performance storage.
However, I believe the most important question is not simply why these sto
MU-5.66%
SNDK-6.90%
WDC-6.91%
STX-7.45%
SK Hynix+0.79%
Layout: Bitcoin, Ethereum, Dogecoin
live-cover
LIVE880
  • 4
Same range just chop all around for $ETH .
Deviation? Continuation? Or still chop
ETH-1.36%
$ETH is currently at 2,396.89, down 1.15% over 24 hours, with volume at 0.12 times the average over the past 20 candles. Put these figures together, and the key point to explain is that $ETH’s price has already moved, but trading activity and volume have not followed.
One verifiable update: Gate’s official announcement reads, “Gate Research: Corporate Earnings Support U.S. Stocks, KR1 Launches Ethereum Validator Nodes…”. It may explain why people are paying attention, but it cannot answer which way the price will move.
You can tentatively trust the direction, but not assume the move will conti
post-image
ETH-1.36%
The Magnificent Seven are propping up S&P earnings growth. The earnings data is still there, but this level of concentration is a risk in itself. Once the social media buzz cools, the crowded trade can quickly unwind. After doing this for so long, I’ve learned that position sizing is always more important than getting the direction right. What do you think?
post-image
SPX+5.61%
$DOGE Current price: 0.07909. The first resistance above is 0.0799, where the Bollinger midline and MA20 converge. Support is at the lower Bollinger Band at 0.0786; a break below opens up room to 0.0780. The chart is in a bearish alignment: MA5 at 0.07937 is below MA20 at 0.07989, the MACD histogram remains negative at -5.47e-05, and RSI at 41.3 is weak but not oversold. The 30-candle range is only 5.17%, indicating a low-volume drift down rather than panic selling.
The real point of contention is the funding rate: at -0.0009%, it is negative, with shorts continuously paying longs, indicating
post-image
ZEC-2.10%
$Bull is coming. This move dumped from 0.0653 to 0.0560. I chased the highs last time and took an 18% loss as tuition—I still remember it clearly. It’s now at 0.0570, down 12.29% in 24h, with 12.6M in trading volume. Volume hasn’t collapsed, which means buyers are stepping in. My plan: don’t chase at the current price; wait for a pullback to the 0.0560–0.0565 range and enter in batches, keeping my position to 30%. Set a stop-loss at 0.0540 (below the previous low); if it breaks, I’m out—no hesitation. First take-profit target: 0.0600; second: 0.0630. Sell half when it gets there. This coin is
牛来-11.25%
every time $BAT tries to get back up, those moving averages just slap it right back down. brutal.TP: 0.1685SL: 0.19016Hot coins:$ZEC : Current Price 1,123.48 - 24h Change: -1.36%$BTW : Current Price 2.5529 - 24h Change: +32.08%
post-image
BAT-9.13%
ZEC-2.10%
BTW+30.72%
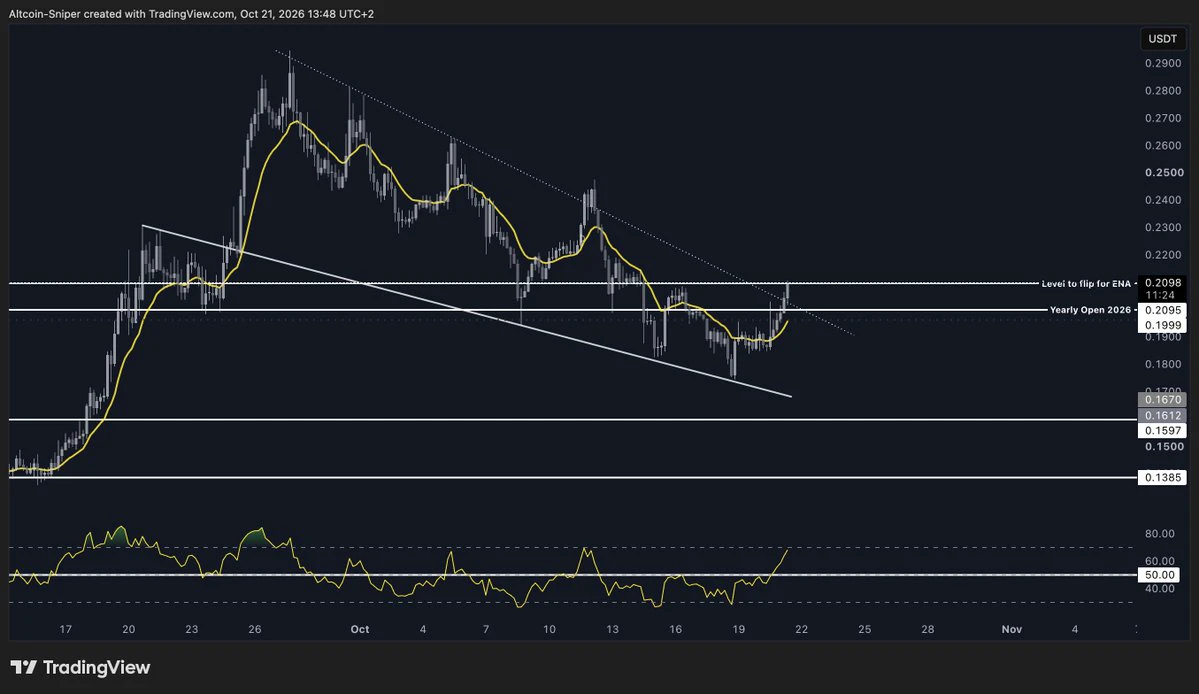
$ARB USDT — 4H TECHNICAL ANALYSIS
ARB is approaching the apex of a symmetrical triangle, with price currently trading near $0.1867. The next move could determine the short-term trend.
Entry: $0.1900 – $0.1930 (after breakout confirmation)
TP1: $0.2000
TP2: $0.2100
TP3: $0.2250
Stop Loss: $0.1800
Key Insight: A strong 4H candle close above the descending resistance, supported by rising volume, could confirm a bullish breakout. Failure to break out may lead to another retest of triangle support.
Trade setup is based on the provided chart; confirm the breakout before entry.
#ARB #Arbitrum #Cr
post-image
ARB-5.44%
  • 1
Load More

Join 40 M users in our growing community

⚡️ Join 40 M users in the crypto craze discussion

💬 Engage with your favorite top creators

👍 See what interests you

Trending Topics

USSeptemberPPIBeatsExpectations

91.35k Views1.93k Discussing

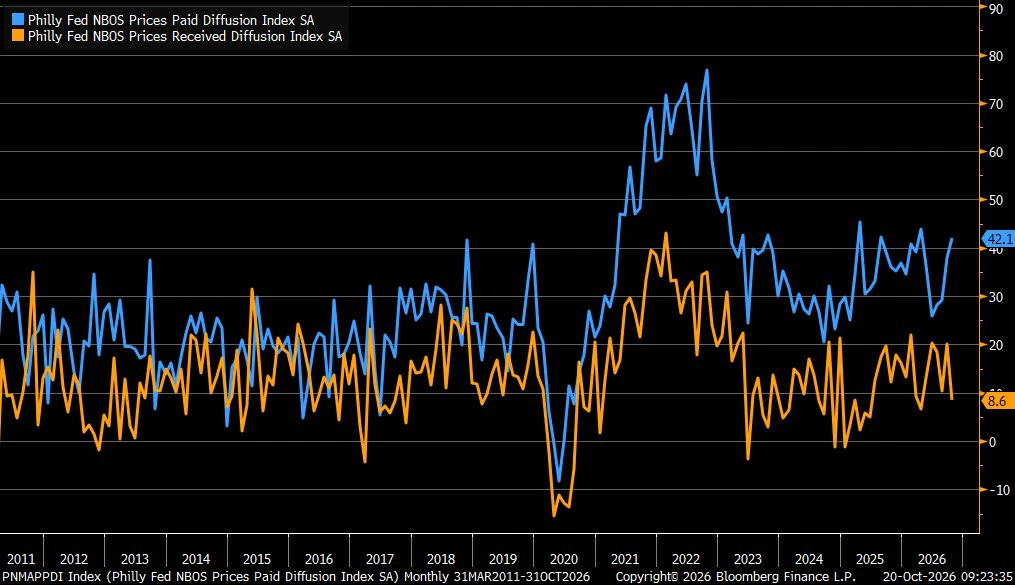
US September PPI came in at 6.3% YoY, well above the 5.3% market expectation, pointing to renewed producer-side inflation pressure. Weekly jobless claims were 199K, broadly in line with forecasts. Could hotter inflation further reduce room for rate cuts, and what does it mean for $BTC, US stocks, and gold?

GateWCTCS9GlobalTradingCompetition

37.87k Views6.67k Discussing

GateBTCAndETHFuturesVolumeRanksTop3

53.8k Views1.81k Discussing

View More