
Share your thoughts
placeholder
Article
Keep holding, and be a bit more determined. By the way, if you’ve already reduced your position, hitting the stop-loss still means a profit.
I originally planned to cut my losses and sacrifice the position to the heavens, but the ritual never happened—the meat cooked itself, and it was the meat from a short position.

I wasn’t idle during the intraday plunge either. $SKYAI rebounded sharply right after the early-session dump, but when I saw the heavy sell pressure and that there was basically no one willing to buy higher, I knew it was merely leaving the bulls some room for wishful thinking. With the resistance above so obvious, I opened a short around 0.21986.

When I checked the chart again after lunch, 0.05937 had already fal
post-image
SKYAI-1.20%
XRP+0.64%
BNB-1.87%
This was purely the market being in a good mood and casually tossing out some gold coins—one just happened to hit me on the head🍀. When I checked the market after lunch, the $TAO order book was already looking unusual, with funds quietly entering.
The price returned to around 225.0 and repeatedly held firm on declining volume. No one was willing to sell on the pullbacks, so I said just one thing: this level is worth trying to follow. Stronger buying pressure is the most honest signal—no need for too many tricks.
I just refreshed the price, and 262.3 has already been reached. +801.07% is more
post-image
TAO+11.79%
SNDK+0.77%
ETH+1.38%
$$COLLECT 24-hour drop of 29%, with trading volume surging to 38.8 million—this script is almost a carbon copy of the big bearish candle on May 19, 2021. The historical pattern is clear: the 6th–8th month after the halving is always a brutal shakeout. October 2020 was like this, and August 2016 was too. Each time, the main uptrend only began 30–60 days after the crash.
The current 0.0405 level happens to be the 0.618 golden retracement level of the previous rally. Yesterday’s sell-off occurred on exceptionally low volume, but trading value continued to expand, indicating that funds were buying
Goldman Sachs is flexing with an $87.45M XRP ETF position, leading the pack among U.S. institutions! 🚀 What does this mean for crypto's future? $XRP #CryptoNews
XRP+0.64%
$ZEC Signal】Long: 4H momentum continues + 1H momentum remains intact
$ZEC RSI 4H 81.95, 4H MACD histogram expanding, 1H MACD histogram narrowing but remaining positive. Funding rate 0.0091%, OI flat, and short-term fuel is not yet exhausted. Price at 1225.08 is hugging the 4H Bollinger upper band, while the 1H upper band at 1254.90 is also opening upward. Continuous buying emerged in the 1215-1222 range, with the price recovering within an hour after the sharp drop. The order book has relatively thick sell orders but has not formed one-sided suppression.
🎯Direction: Long
⚡Entry/limit order:
post-image
ZEC+19.75%
BTC+0.68%
ETH+1.36%
SOL+3.20%
$SUI The next scenario
If August 18, 2026 is the lowest point of this cycle, and we go long at 0.7, the target price would be around 1.31
If there is one final pullback (expected to be no lower than 0.36), it will be considered the bottom of this cycle, and the target for the next bull market should be at least 2u
post-image
SUI+1.68%
After ETH pulled back to around 2475 in the early hours, it stabilized. Continued volume expansion by the bulls drove a strong morning rally, with a one-way rise of nearly 50 points to a high near 2525, followed by a slight pullback. The price is currently holding around 2515.
This rally saw a solid bullish candle break above the four-hour Bollinger middle band. The significant increase in trading volume confirmed that the 2475–2480 area had completed its transition from resistance to support, with the bulls establishing a clear defense line there. The current price is holding firmly above 251
post-image
ETH+1.38%
🧐 Bitcoin's trading volume has tanked to $20 billion as it hovers around $80K. Is this a sign of market fatigue or a brewing opportunity? 💸 $BTC #CryptoTrends
BTC+0.68%
No vision, can't hold on—this round's profit is as thin as paper, but I absolutely love it🔥. I had just finished lunch and was checking the chart; $SPCX /SPCX was just moving sideways, while funds seemed to be quietly flowing in. I immediately opened a long to catch it, without waiting for the second candlestick to confirm.

This trade feels great. My entry cost was 138.37, and it's now 151.05, +849.76%. Although the profit isn't huge, I've held it firmly. When going long, only realized gains are real.

Pocket 75% first; for the remaining 20%, move the stop-loss to the breakeven line. Exit i
post-image
SPCX+0.49%
ADA+1.97%
DOGE+1.08%
XRP just faked a breakout—the 4h chart is screaming SHORT at 1.417.

$XRP /USDT - SHORT

Trade Plan:
Entry: 1.415 – 1.419
SL: 1.438
TP1: 1.401
TP2: 1.390
TP3: 1.374

Why this setup?
The range-bound 1D trend is your tell. Price sits at the upper lip (1.419) with RSI 15m at a limp 50—no momentum to push higher. ATR 0.0088 shows volatility is compressed, meaning a snap back to TP1 (1.401) is the path of least resistance. Why now? The entry zone is tight, and the "Waiting" status means the trap is set before the next candle.

Debate:
Are you fading this push to 1.419, or waiting for a close ab
XRP+0.64%
I will definitely get better. I won’t be afraid of all the pitfalls I’ve encountered along the trading journey. I was born lucky.#晒出我的持仓收益
post-image
Proper capital management is crucial when trading options! Do not use more than 1.5x leverage at most. Here is some advice for everyone trading options!
📉 Three warning levels for the equity curve📈
Plot the account's net value as a line chart and monitor three levels:
1️⃣ Yellow line (10% drawdown): Stop adding to positions; only reduce, never add. Review the three most recent losing trades
2️⃣ Orange line (20% drawdown): Cut each position size in half; only trade the setups you know best. Return to normal only after two consecutive bullish candles
3️⃣ Red line (30% drawdown): Stay completel
post-image
🚨 A security earthquake in the crypto world: Liquid Network hacked and 4,000 Bitcoin withdrawn in a single transaction
A staggering $320 million was withdrawn from the reserve wallet of Blockstream’s Liquid Network
🛑 The scale of the disaster
4,000 bitcoin:native coins were transferred—equivalent to 95% of the bridge’s reserves—to a new external address
🛑 The Peg-out vulnerability
The operation was carried out using the withdrawal authorization key assigned to SideSwap, without compromising the multisig keys.
🛑 The White Hats’ message
The perpetrators left an encrypted message on the block
post-image
BTC+0.68%
  • 1
BNB Surpasses 770 USDT with a 7.24 percentage Increase in 24 Hours
live-cover
LIVE1,657
A few days ago, I was still calculating whether I had enough money for instant noodles this month; this morning, I was already wondering whether to add sausage 🍜
A few days ago, when the market had just plunged in the afternoon, I saw $PONS get slammed down and immediately bought back up. The buying support was exceptionally strong. This wasn't weakness—someone was quietly accumulating amid the plunge. I directly made my long signal clear around 0.4156, without the slightest hesitation.
Looking at the market again now, the price has climbed to 0.8206. This kind of move feels amazing—I stayed
post-image
PONS-8.38%
LAB-3.27%
BNB-1.87%
#Gate事件合约晒单挑战 Trade It, Analyze It, Share It!
The market is moving fast, and every price action can create a new opportunity. Now, Gate Event Contracts are giving traders another exciting way to express their market views while turning their analysis into something the community can see and learn from.
The is more than simply placing a trade. It’s about showing your market perspective, sharing your trading decisions, and letting others understand the thinking behind your position.
Why participate?
Share your Event Contract trading screenshots
Show your market analysis and trading strategy
post-image
I was just about to go to the forum and rant, but then I saw my balance and thought, forget it—the market is always right. 😂
A few days ago, it was still barely holding on before bed. Every rebound seemed to lack that final push, while volume quietly shrank. At a level like this, not opening a short position would have been hard to justify. Entry reference: 0.17647. When I opened the chart this morning, the price had plunged straight to 0.04593, and the short position was already showing +1457.07% unrealized profit. This profit feels great. 🔥
Take profits steadily; don't get greedy for the l
post-image
SOL+3.18%
LAB-3.27%
#GateTops7DayNetInflowsGlobally
💰 CAPITAL FLOW IS SPEAKING — BUT BTC STILL HAS TO CONFIRM THE MESSAGE
One of the biggest mistakes traders can make is watching only the price chart.
Price tells us what is happening.
But capital flow can sometimes tell us where market participants are positioning themselves.
That is why Gate’s latest net-inflow data has caught my attention.
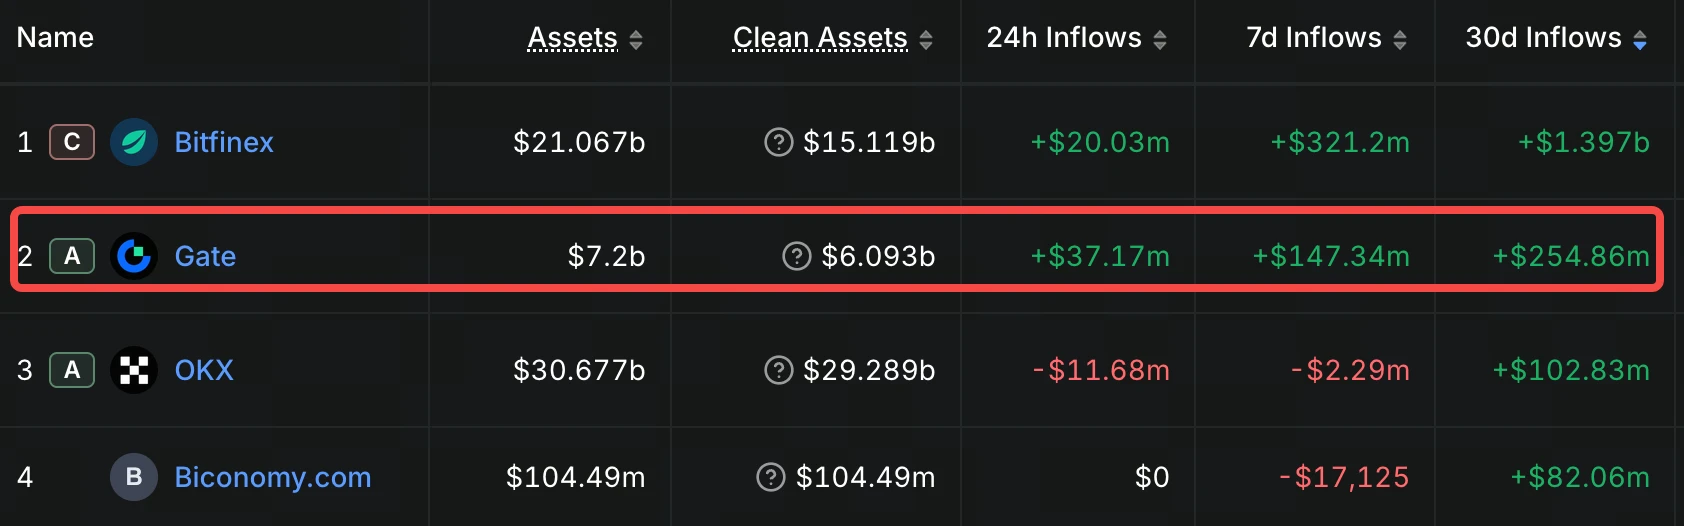
According to recent DeFiLlama-based data reported by Gate, Gate recorded approximately $520.45 million in net inflows over the past month, placing it #3 globally among centralized exchanges.
Earlier August data also showed
BTC+0.68%
ETH-2.49%
Load More

Join 40 M users in our growing community

⚡️ Join 40 M users in the crypto craze discussion

💬 Engage with your favorite top creators

👍 See what interests you

View More