Share your thoughts
placeholder
Article
Nvidia is 8% of the S&P 500 by itself.
At $5.3T it outweighs entire sectors and equals 16% of US GDP.
One company, one product cycle, and a very large share of everyone's retirement account.
post-image
NVDA+0.87%
Everyone’s chasing SUI’s green candles—but the 4H tape just whispered a secret the crowd missed.

$SUI /USDT - SHORT

Trade Plan:
Entry: 0.7959 – 0.8009
SL: 0.8225
TP1: 0.7804
TP2: 0.7683
TP3: 0.7503

Why this setup?
Why now? The 1D trend is *range*, not breakout, and the 4H bias flips SHORT at 0.7984. RSI on the 15m sits at 54.67—neutral, not overbought, meaning no momentum shield. ATR (1h: 0.0100) is tight, so the slide to TP1 (0.7804) is a slow bleed, not a crash. Entry zone: 0.7959–0.8009. If we lose 0.7663, the short thesis is dead—but until then, gravity wins.

Debate:
Are you fading
SUI+5.74%
retail prices of other goods and services, such as on one of the first days of the Year of the Horse New Year $MU
post-image
MU+5.89%
  • 1
#Gate用户突破6000万
My Gate Journey: From January 2025 Newcomer to Laughing at My Own Liquidation Stories
I officially joined Gate in January 2025. At that time the market was already moving fast, and I created the account after watching too many charts and deciding it was time to stop being a pure spectator. Gate stood out immediately clean interface, solid liquidity on both major and alt pairs, and a futures section that looked professional without being overwhelming. I deposited a modest amount, explored the platform for a few days, and prepared for my first real trade.
My first trade was pure
post-image
I originally wanted to cut my losses and sacrifice the meat to the heavens, but the sacrifice never happened—the meat roasted itself.
When the screen was glowing green, $LIT repeatedly hovered around 3.753, with every dip being bought back up. The bottom consolidated without breaking down, while volume quietly expanded—clearly, someone was accumulating amid the chaos.
I went with the flow and opened a long position, betting that this level could hold. Then it shot straight up to 4.739, and +1259.71% was firmly in the bag. This run was worth the wait—I finally got to sink my teeth into a big p
post-image
LIT-2.89%
BTC+0.28%
ZEC-1.29%
Nobody’s watching ZEC while it quietly prints a 95% confidence long setup.

$ZEC /USDT - LONG

Trade Plan:
Entry: 1020.16 – 1028.06
SL: 986.17
TP1: 1052.57
TP2: 1071.54
TP3: 1100.00

Why this setup?
Why now?
- 1D trend is bullish, and price is holding above the 4h entry ref at 1,024.
- RSI (15m) at 53 shows room to run—not overheated, not dead.
- ATR (15.8) says volatility is ripe for a squeeze toward TP1 (1,052) and TP2 (1,071).
- Invalidation sits at 986—risk is defined, upside is 7%+.

Debate:
Are you fading this ZEC breakout or riding it to TP2 before the weekend close?

⚠️ Pe
ZEC-1.29%
$ETH Signal】Short: 4H bearish histogram expanding, rebound at 2461 weak
$ETH 4H MACD bearish histogram -1.93 continues to decline, with price breaking below the 4H EMA20 and now hovering around 2454. 1H RSI 47.31, momentum insufficient, while the Bollinger Bands narrowed to 2447-2458. The short-term price repeatedly tests the upper bound at 2458, with multiple rallies retreating.
🎯Direction: Short
⚡Entry/limit order: 2454.69 (current price)
🛑Stop-loss: 2479.2369
🚀Target 1: 2417.8697
🚀Target 2: 2399.4595
🛡️Trade management:
- Execution strategy: After reaching Target 1, reduce the positio
ETH+0.36%
ETH pulled back after hitting $2,550 yesterday, and $2,550 remains a very clear short-term resistance level.
At the same time, August nonfarm payrolls were significantly stronger than expected, reinforcing the risk of a hawkish Fed, which is weighing on the short-term crypto market; however, ETH ETF fund flows are still maintaining relatively strong net inflows. Therefore, the market now looks more like “high-level consolidation + waiting for a directional choice” rather than a direct shift into a major bear market.
ETH’s latest short-term strategy
① First priority: Short the $2,500–2,550 zone
ETH+0.38%
BTC+0.26%
Do you agree with the influencer professor’s view?
post-image
Everyone’s glued to DOGE’s 15m RSI at 65, but the 4h tape is screaming a different name.

$DOGE /USDT - SHORT

Trade Plan:
Entry: 0.08741 – 0.08777
SL: 0.08929
TP1: 0.08632
TP2: 0.08547
TP3: 0.08420

Why this setup?
Why now? The daily trend is *range*, not bull. ATR (0.0007) shows low volatility—perfect for a squeeze.
- Primary signal: SHORT at 0.08759, targeting TP1 (0.08632) then TP2 (0.08547).
- RSI on 15m is overheated (65.64) → short-term pullback fuel.
- Stop at 0.08929 caps risk; invalid below 0.08560 confirms bearish continuation.
The “waiting” status means the trap is set—n
DOGE+3.57%
BTC looks much calmer after yesterday’s sell-off than one might have expected.
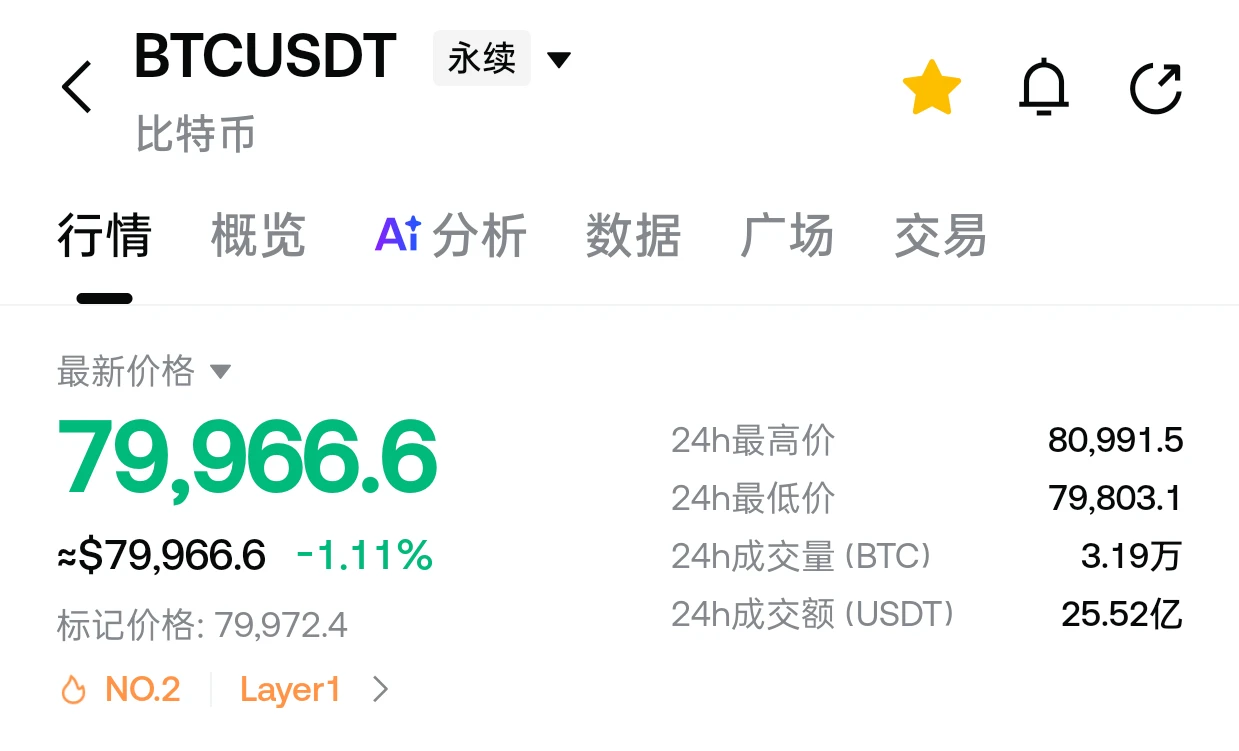
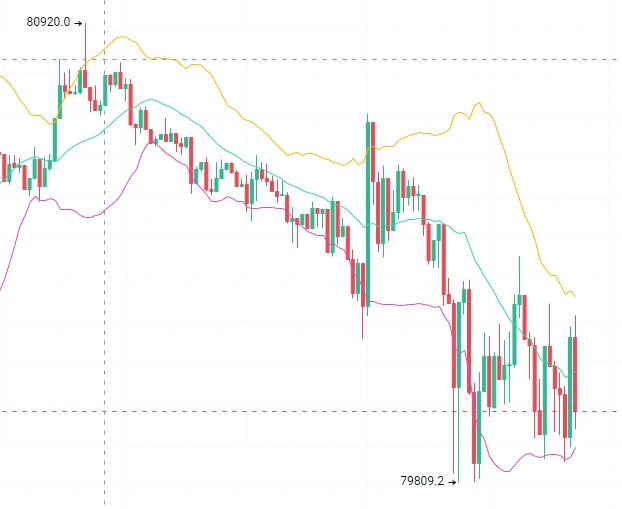
Since the price entered the 77–82 thousand range, there is one detail I would not ignore: spot volume continues to outpace futures volume.
And this matters.
As long as the market is selling through futures while real spot buying remains stronger, the pressure looks more like a shakeout than a change in direction.
Yesterday’s NFP gave sellers a reason to hit the market. But so far, they have been unable to change the demand structure itself.
To me, this argues in favor of the move continuing upward.$BTC
post-image
BTC+0.26%
Crypto market faces fresh pressure
live-cover
LIVE2,201
$PONS is not a MEME, remember, don't treat it like one
First, two updates:
1. PONS's 24-hour revenue (1.8M) not only surpassed PUMP's, but was also more than twice as high
2. winter market maker has started trading PONS, a precursor to listing on major exchanges (although it's not necessary), but there would be no harm in a listing, right?
Now let's break down why PONS cannot be treated like a MEME, and how it differs from MEMEs
First, we need to understand the concepts:
1. MEMEs rely on sentiment, whether it comes from natural market consensus (such as #牛来) or celebrity effects (such as call
post-image
PONS+26.87%
MEME+3.75%
PUMP-7.91%
牛来+42.90%
Everyone’s watching HYPE’s 4h breakout—but the 95% confidence score is the real tell.

$HYPE /USDT - LONG

Trade Plan:
Entry: 85.415 – 85.715
SL: 84.129
TP1: 86.642
TP2: 87.360
TP3: 88.437

Why this setup?
Why now?
- 1D trend is bullish, and the 4h structure is *Armed* with a tight ATR (0.598) = low noise, high conviction.
- RSI 15m at 59.95 shows momentum building, not overheated—room to run to TP1 (86.642) and TP2 (87.360).
- Entry zone (85.415–85.715) is a springboard; invalidation sits far below at 82.117, giving you a 3:1+ risk/reward on the long side.

Debate:
Are you front-run
HYPE+0.77%
$DYDX dydxusdt short Rodd01-SIGNALSPROVIDER
Instructions:
Entry point: yellow
Stop loss: red
Take profit: green
Leverage x 5-10-20 for crypto
Leverage x 20-50-100 for commodities, stocks, indices, and forex
Margin 1-5% max.
Always practice risk and money management.
Invest a maximum of 5% on any trade or across all your trades.
Invest only what you can afford to lose, as no one is in control of the market.
Our analyses are primarily based on:
breakouts: two trend lines (ascending and descending) and a line indicating a horizontal breakout.
chart patterns: shoulders and head, triangle parttern,
post-image
DYDX+3.43%
Today is the weekend, and the market is fluctuating downward. Congratulations to everyone who followed me into opening short positions last night—you all made a killing. My short position also raked in 1.6 million. Today, I’ll wait for the right opportunity to continue opening short positions. Ethereum is still headed for 2350; once it rebounds to 2470, you can confidently open short positions. Today is the weekend, and the market is fluctuating downward. Congratulations to everyone who followed me into opening short positions last night—you all made a killing. My short position also raked in
post-image
ETH+0.36%
BTC Market Updates
live-cover
LIVE1,877
#GateTops7DayNetInflowsGlobally
Gate Tops 7-Day Net Inflows Globally
Gate has once again attracted strong attention across the global crypto market as its 7-day net inflow performance highlights growing capital activity and increasing interest from traders and investors.
Strong 7-Day Capital Inflows
Net inflows are an important indicator for understanding how much capital is moving into an exchange compared with the amount moving out. Recent DeFiLlama-based reports have placed Gate among the strongest centralized exchanges globally for 7-day net inflows, demonstrating significant capital move
  • 1
$BTC
Wall Street suddenly started rushing to buy BTC?
Bought $731 million in one day 😂
These Wall Street guys
were still discussing risks just two days ago
today
they suddenly said, “Sorry, fuck it, let’s buy $700 million first”
U.S. spot Bitcoin ETFs
saw approximately $731 million in net inflows on Thursday
directly setting the largest single-day inflow since January
BTC also reclaimed $80,000
Now that’s interesting
because ETF funds had still been flowing out for a while
and the market had started to wonder
whether institutions didn’t want to play anymore
Then suddenly came a massive inflo
post-image
BTC+0.28%
Load More

Join 40 M users in our growing community

⚡️ Join 40 M users in the crypto craze discussion

💬 Engage with your favorite top creators

👍 See what interests you

View More