Share your thoughts
placeholder
Article
These returns have me feeling nervous, worried the market will wake up tomorrow and blacklist me.
A few days ago, the last thing I checked before bed was the chart. $SNDK pulled back to around 1500.51 and stopped moving. It was bottoming out without breaking support, while funds were still quietly entering. I felt this level had potential, so I casually opened a long position.
The first thing I did after waking up was check my phone: 1771.62 had shot up, and +1282.92% was in the bag. After dragging on for so long, seeing it finally break out feels incredible.
Don’t rush to add to your positio
post-image
SNDK+12.32%
ETH-2.35%
ZEC+6.55%
Real-life crypto trading VS comic-book crypto trading
post-image
Arbitrum ethereum:0xb50721bcf8d664c30412cfbc6cf7a15145234ad1 bridge TVL just hit an ATH at $23B
post-image
ARB-3.38%
ETH-2.34%
🔥 Everyone chases coins after they rise… then buys the top and wonders: Why did I lose?!
Why do we chase a coin after it attracts attention, while ignoring projects that are still in their early stages and under the market’s radar? 🤔
EGY/USDT is still in its early stage, with an engaged and expanding community, and a team that continues working to take the project to greater levels. 🚀
The point isn’t to buy because everyone is talking about the coin…
The point is to research, understand, and then make your decision away from emotion and FOMO.
EGY may simply be a new project to you today, bu
EGY
EGYEgypt
Gate.Fun
MC:$128.59KHolders:1254
100%
AVAAI+0.68%
AI+0.90%
AIA+0.71%
  • 4
#GateTops7DayNetInflowsGlobally
GATE CROSSES $300M IN 7-DAY NET INFLOWS
Gate has recorded approximately $300.43 million in net capital inflows over the past seven days, placing it among the top three globally according to the latest DeFiLlama-based data. The figure is significant because it shows that capital movement toward Gate has remained strong even while the broader crypto market is dealing with elevated volatility and changing macro expectations.
WHAT DOES $300M+ NET INFLOW ACTUALLY MEAN?
Net inflow is not simply the amount of money entering an exchange. It represents the difference b
post-image
Falcon_Official
#GateTops7DayNetInflowsGlobally
Gate is making a strong statement through capital flows. According to DeFiLlama data, Gate recorded approximately $273.72 million in net capital inflows over the past 7 days, placing it among the top three centralized exchanges globally. For an exchange, this is more than just a large number on a dashboard—it shows that a significant amount of capital has moved onto the platform after accounting for outflows.
The important word here is “net.” If users deposit $500 million but withdraw $226 million during the same period, the net inflow is roughly $274 million. That means the headline figure is measuring the difference between money coming in and money leaving, rather than simply counting deposits. This makes a sustained positive seven-day figure a useful indicator for understanding where exchange liquidity is building.
A seven-day window is particularly interesting because it filters out some of the noise that can appear in a single day. One large transfer can make a 24-hour ranking look impressive, but maintaining strong net inflows across an entire week suggests broader activity. Capital may be arriving for spot trading, derivatives, portfolio repositioning, new listings, hedging or simply to keep funds ready for opportunities.
There is another reason this number deserves attention. Exchange inflows should never be interpreted as an automatic bullish signal for the entire crypto market. Coins moving onto an exchange can eventually be used for buying, but they can also be deposited for selling or hedging. The stronger interpretation comes when capital inflows are combined with trading volume, price action, stablecoin liquidity and user activity. In other words, inflow tells us where capital is moving; market behavior tells us what that capital is actually doing.
Gate's broader flow picture also adds context. DeFiLlama data cited by Gate showed approximately $520.45 million of net inflows over the past month, ranking Gate third among centralized exchanges globally. The seven-day figure therefore fits into a larger story of meaningful capital movement rather than appearing as an isolated one-day event.
For traders, this is the part I find most interesting. If strong net inflows continue while trading activity expands, liquidity becomes an increasingly important part of the Gate ecosystem. More available capital can support deeper market participation and provide traders with greater flexibility when volatility creates opportunities. But if inflows rise while prices weaken sharply, the interpretation becomes more complicated because those funds could be positioned for selling or defensive strategies.
The recent data also shows how quickly rankings can change. Another September 3 snapshot from DeFiLlama placed Gate's seven-day net inflow at $78.19 million and ranked it first among global centralized exchanges, highlighting that exchange-flow figures can move rapidly as deposits and withdrawals change. The key takeaway is therefore not to treat one snapshot as permanent, but to watch whether positive capital-flow momentum continues over multiple periods.
For Gate, the $273.72 million seven-day net inflow is still a notable milestone. It puts the exchange firmly on the global capital-flow radar and gives the community another metric to watch beyond simple trading volume. If the next weekly readings remain positive and are accompanied by stronger activity, that would make the trend considerably more meaningful.
Capital follows opportunity, but the smartest signal is not simply seeing money arrive. The real signal is seeing whether that capital stays, participates and contributes to sustained market activity.
@Gate_Square
repost-content-media
BTC-1.58%
  • 5
$ONG /USDT Quick Update: ONG trades near $0.09671, down 5.13%, after rebounding from $0.09378. Buyers defend $0.09504, while $0.09691–$0.09727 is immediate resistance. Breakout could target $0.09858. Buy zone: $0.0950–$0.0960; TG1 $0.09727, TG2 $0.09858; SL $0.09370. Ontology recently restored mainnet after security review; ONG remains its gas token. 200M ONG burned in 2026, supply capped at 800M, tightening tokenomics further. $NVDA$NAS100
ONG-4.57%
NVDA+0.87%
NAS100+0.06%
September 5: Bitcoin plunges with help from nonfarm payrolls; Ether dives but has not turned bearish; gold trend analysis$XAUUSD $ETH
XAUUSD-0.95%
ETH-2.35%
  • 2
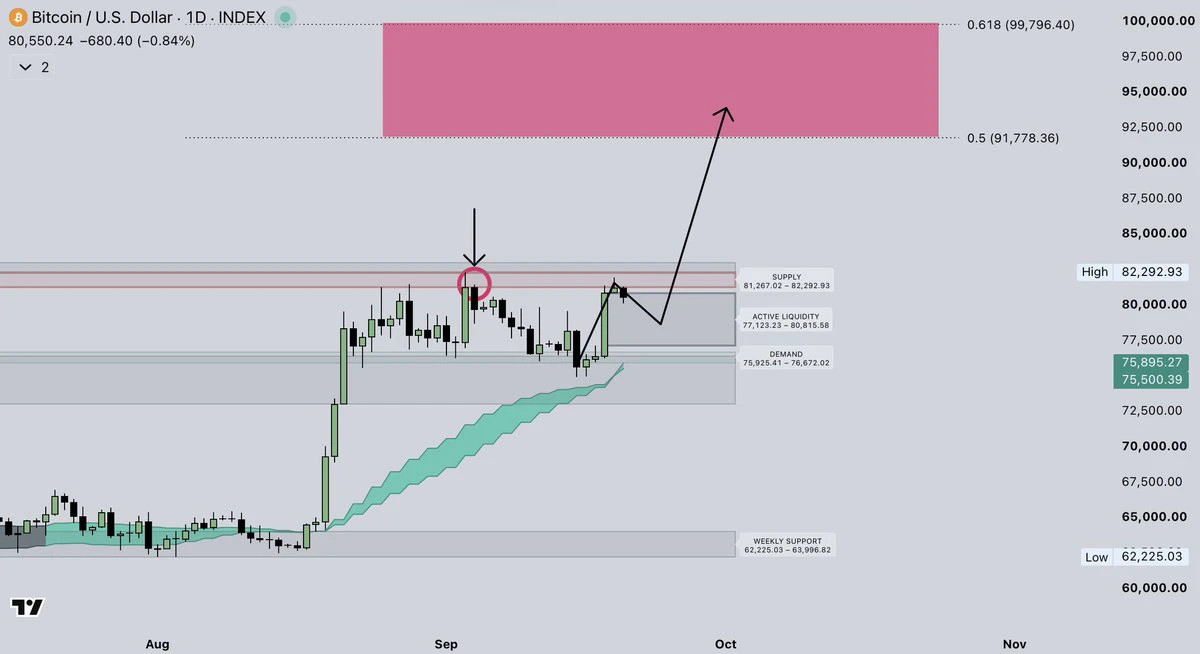
🚨 #BTCReclaims80K
#Bitcoin just reminded everyone why risk management always comes before prediction.
One strong economic report... One wave of liquidations... And suddenly, the entire crypto market was filled with panic.
But is this really the beginning of a massive bear market?
Not so fast.
The biggest mistake traders make is reacting to the first move instead of understanding why it happened.
Here's what actually unfolded.
The U.S. August jobs report came in much stronger than markets expected.
• 162K new jobs were added. • Expectations were only around the mid-50K range. • July's data was
BTC-1.59%
INDEX-23.90%
$Shroom fast-tracked 42m
shroom wants to be the quote asset for all tokenized stocks, collecting tolls along the way. The goal is ambitious
Everyone will ask why users should go through your shroom
So it all comes down to pool depth
Currently, shroom accounts for less than 1% of total RH liquidity—a problem, but also an opportunity
DYOR
post-image
RH+0.98%
Song Yalong KO Umar
Patiently wait for the opportunity, then strike with a heavy punch!!!
I know, you know what I’m talking about
BTC
Such is life, such is trading
If you want to win, you have to wait for that moment—dare to strike with a heavy punch
#宋亚东 #BTC
post-image
BTC-1.58%
Earlier, the long and short curves alternated in the lead amid intense tug-of-war; after September 4, the expectation of a surge to 2600 briefly took a significant lead before quickly retreating; currently, the probabilities of 2600 and 2300 are very close, while expectations of an upward move to 2700 remain weak.
post-image
WAL/USDT — A quiet recovery after a long downtrend
WAL is trading around 0.02619, up 4.22%, with price finally stabilizing after falling from the 0.12531 peak.
The bigger picture is still weak, but the recent structure is different: price has formed a base around 0.02001 and is slowly pushing higher.
Levels on my radar:
• 0.02646 — immediate resistance
• 0.03000 — key breakout area
• 0.04106 — major resistance
• 0.02001 — major support
• 0.02098 — SuperTrend level
MACD is improving and has moved back into positive territory, which supports the recovery idea. But the long-term performance is st
WAL+4.21%
  • 1
BTC Update
live-cover
LIVE1,898
I only meant to test the waters with a small position, but it ended up being a bit underwhelming? No, it delivered a big one! As it repeatedly oscillated intraday, I watched the order book for ages. Every dip held above support, and the volume-price action was actually getting healthier and healthier. My instincts told me this move had potential. I bought the dip during the daytime pullback at 0.00793, and when I opened the app again after lunch, it had already reached 0.00855, sending the return to +191.86%. My account was dancing on its own—I was worried it might fall.

Made the profit fair
post-image
SNDK+12.32%
ADA-3.98%
Good Morning My x Family 🤩
Can I Get GM Back??? ↩️ 💙
post-image
Making money is so hard—who on earth is actually making money?
post-image
$MARSCOIN Signal】1H hugs EMA20, bulls defend and counterattack
$MARSCOIN 1H MACD histogram -0.0038, bearish momentum is still expanding, while the price is holding above EMA20 at 0.1748, with buyers not allowing a breakdown.
4H Bollinger upper band 0.2173, with the bands extremely wide open; the price is far from the middle band at 0.1191, and short-term volatility remains elevated. Volume has contracted for three consecutive candles, and chasing higher has slowed.
Order book depth imbalance -7.19%, with sell orders slightly heavier, while the OI trend remains stable, with no large-scale exit
post-image
MARSCOIN+44.09%
If only I had exited when it fell😭
post-image
market trend
live-cover
LIVE668
$AKE Signal】1H volume-backed breakout + negative-funding short squeeze
$AKE RSI surged to 73.87 on the 1H timeframe, while the funding rate was -0.1093%, with crowded shorts providing fuel for the move. The 1H MACD histogram stood at 0.0007 and continued expanding, with price surging from 0.0145 to 0.0183 and trading volume simultaneously exploding to 2.3 billion. The 4H Bollinger Bands opened up, with the upper band at 0.0192 and the middle band at 0.0133, while price continued hugging the upper band. Order book depth imbalance was -22.23%, with thin sell-side orders and stronger willingness
post-image
AKE+16.14%
BTC-1.58%
ETH-2.34%
SOL-1.73%
Load More

Join 40 M users in our growing community

⚡️ Join 40 M users in the crypto craze discussion

💬 Engage with your favorite top creators

👍 See what interests you

View More