Share your thoughts
placeholder
Article
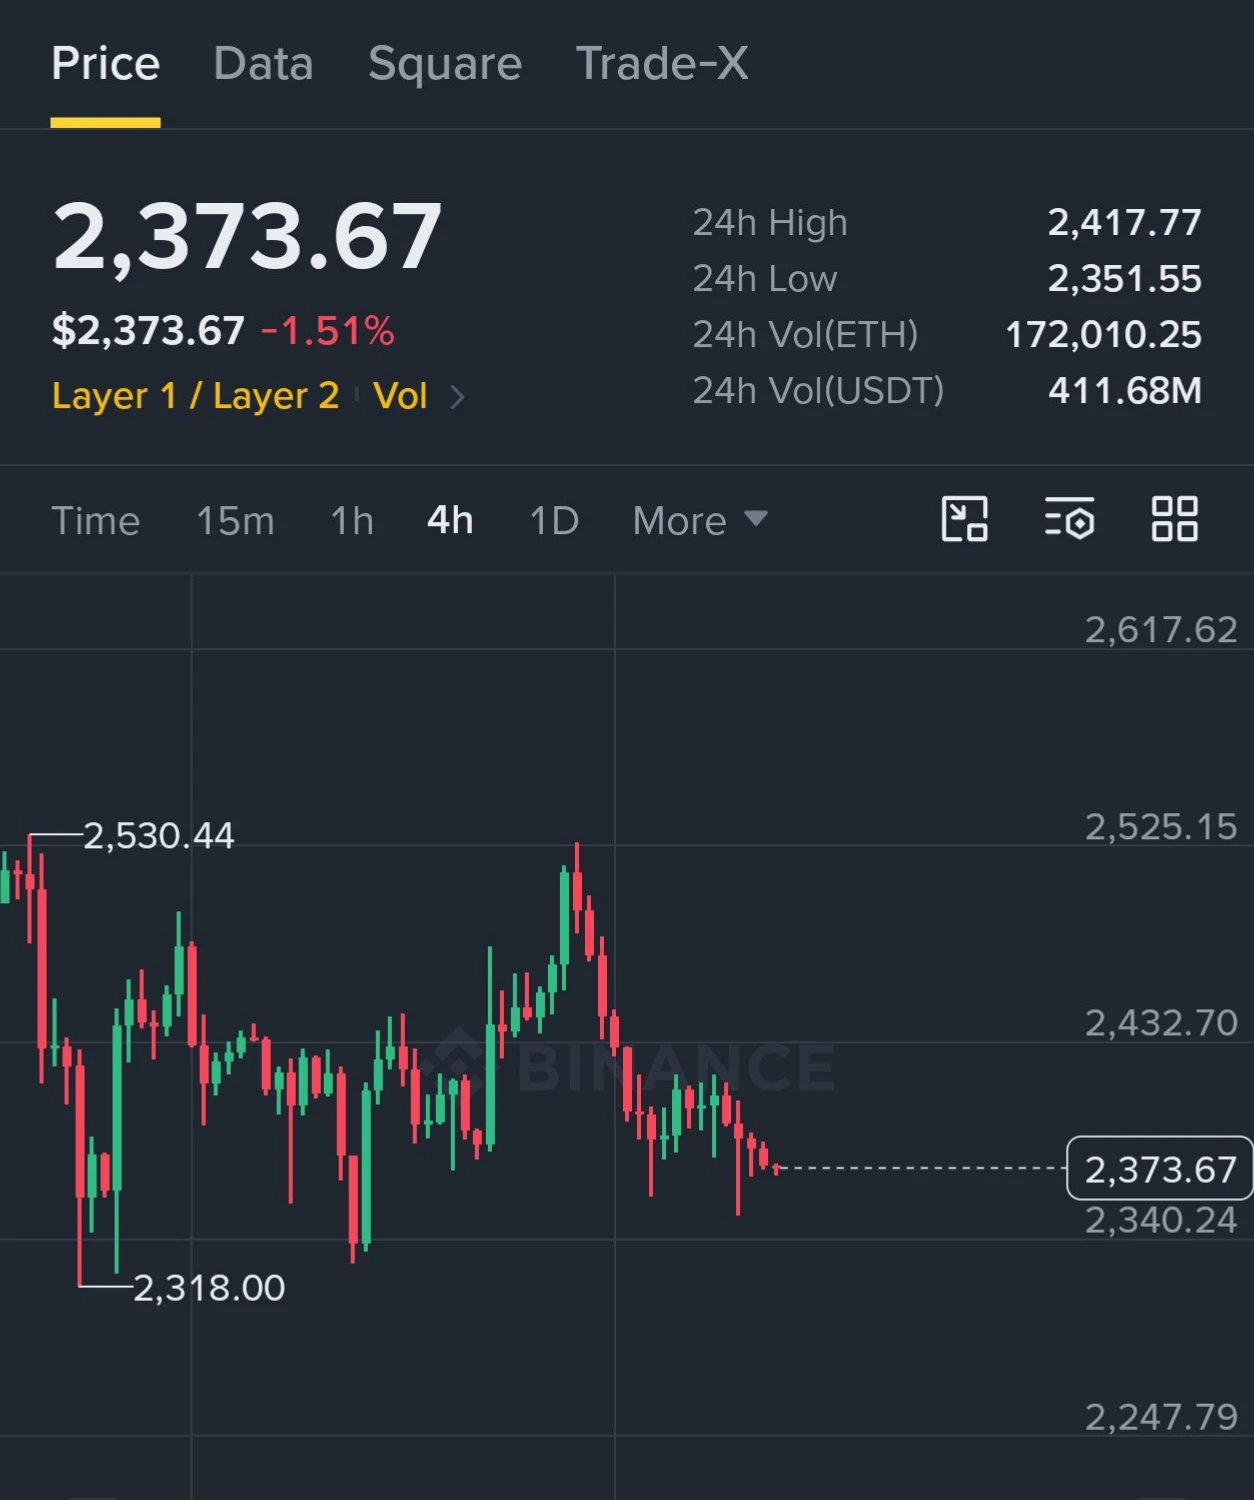
9.11 ETH Setup Strategy
ETH is currently also in a corrective rebound phase following a sharp decline. The downtrend has not reversed; short sellers are merely losing momentum in the short term, while long positions are taking the opportunity to make a partial rebound. Technical indicators suggest improving conditions, but the macro environment remains unfavorable. Neither BTC nor ETH has seen large-scale outflows during the overall decline. Going long is against the trend, so make sure to set a stop-loss.
Entry zone: Enter after the pullback stabilizes near 2430
Stop-loss defense: Exit if 240
post-image
ETH-1.26%
#AugustCPIDropsTonight
The August CPI Print Lands Today, And It Decides What September Looks Like For Crypto And Stocks
Today is the day. At 8:30 in the morning Eastern Time, which is about 5:30 in the evening in Pakistan, the US Bureau of Labor Statistics publishes the August Consumer Price Index, and this print matters more than most, because it is the last major inflation reading before the Federal Reserve meets on 15 and 16 September.
Consensus expects a headline increase of about 0.4 percent month over month and roughly 3.4 percent year over year, with core CPI, excluding food and energy
BTC-1.97%
ETH-1.27%
XAU-2.32%
NVDA-0.23%
  • 1
$CYS are all bagholding and crying, right?
post-image
CYS-7.43%
The latest version of the CLARITY Act was released today. I took a look at the approval probabilities on Polymarket and Predict—18% and 17%, respectively. It seems unlikely that the vote will pass on September 15.
But it’s not a big deal. Regardless of whether the CLARITY Act passes, the SEC and CFTC will jointly roll out a “digital asset regulatory framework”; the difference is that one provides regulatory confirmation at the legal level, while the other offers guidance and direction at the policy level.
In short, passing would be a good thing, but not passing would be fine too.
post-image
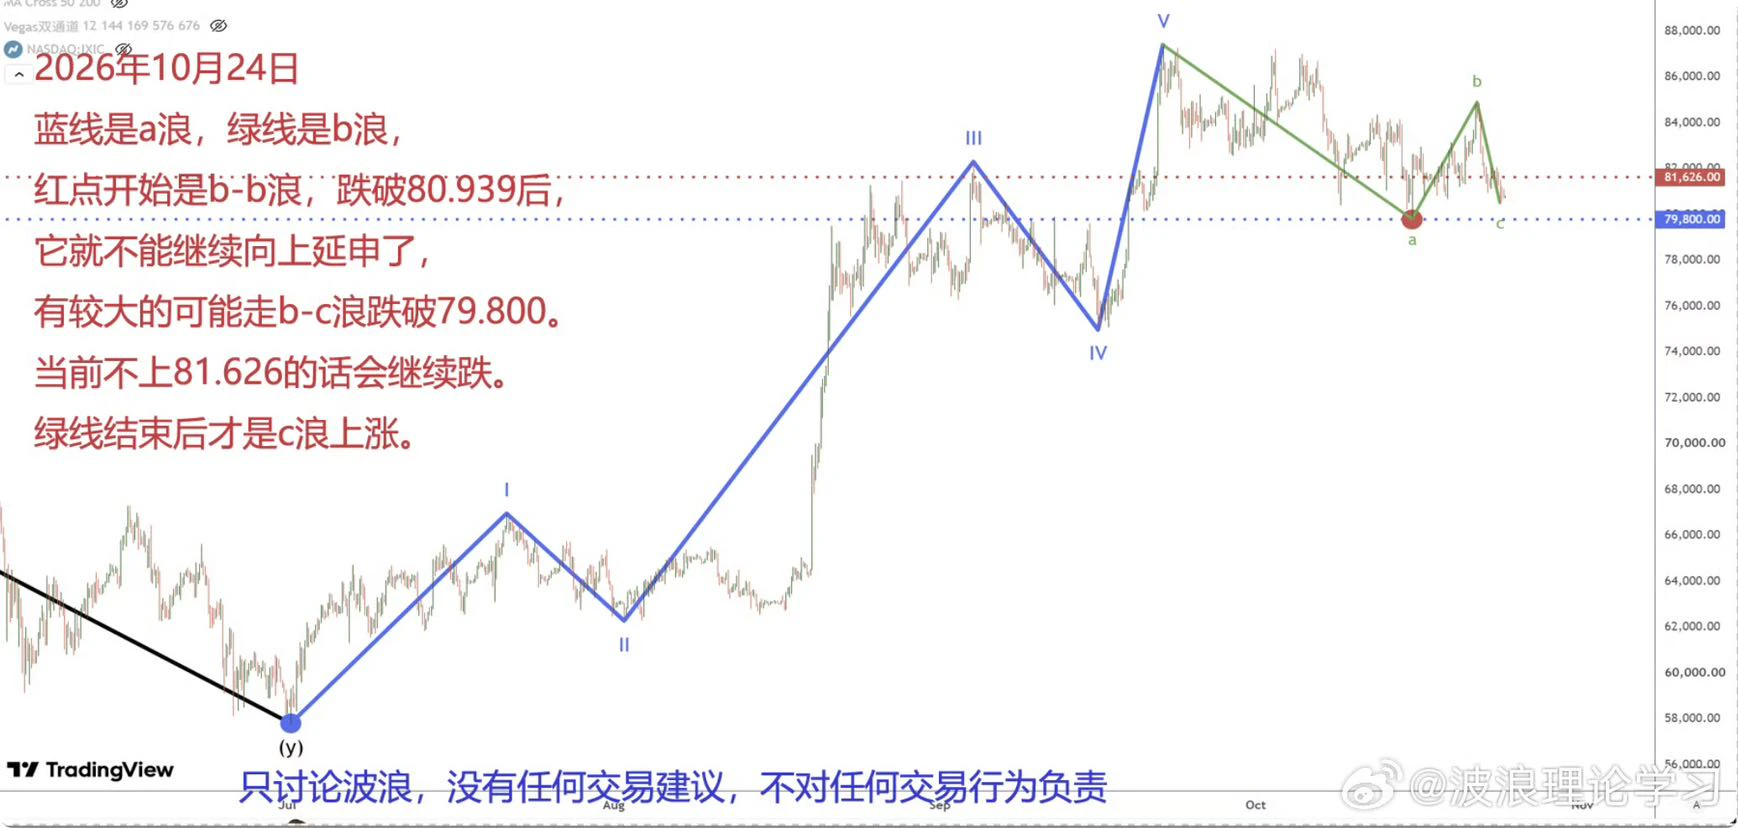
Bitcoin continued its downward trend yesterday but did not break below the recent low. Affected by the data, shorts had some volume, but it was not particularly large, so do not be misled by the superficial signals. I believe that as long as this pullback does not continue breaking below the low, a rebound and rise will remain the main trend.
On the daily chart, Bollinger Bands are showing a narrowing, parallel formation. The previous rise pushed the moving averages higher, and they have now provided effective support. Yesterday’s dip happened to reach the support point of the lower moving ave
post-image
BTC-1.97%
#GateUSPartnersWithRQDClearing
GATE’S NEXT MOVE MAY BE BIGGER THAN IT LOOKS
Gate’s exploration of a strategic partnership with RQD Clearing could become an important step in the broader convergence between crypto markets and traditional U.S. financial infrastructure.
But there is one detail I would emphasize before anything else: this is not a completed partnership yet.
On September 9, 2026, Gate announced that it is exploring partnership opportunities with RQD Clearing, a New York-based clearing and custody firm. The specific structure, services and commercial scope are expected to become cl
GT+1.31%
BTC-1.97%
  • 1
bitcoin next move upadte
live-cover
LIVE1,657
Tongge's 9.11 ETH outlook
Enter a short around $ETH 2460-2480, with a stop loss at 2500, first target at 2430, and second target at 2400.
Current price: 2453. Aggressive traders can open a small initial position first, add on a rebound to 2460-2480, with a unified stop loss at 2500.
Yesterday, ETH followed BTC in a sharp sell-off, dropping as low as 2403, then staged an independent rebound, reaching a high of 2474. It fell just short of 2480, but still failed to break through, showing that selling pressure remains overhead and cannot be absorbed by a single wave of sentiment.
At 2453, the pric
post-image
ETH-1.26%
$ETH Signal】1H rebound momentum weakening + order book sell pressure buildup, short attack
$ETH The 4H MACD histogram’s negative value continues to converge, with the current price below EMA20(2468) and EMA50(2472). Order book depth imbalance is -39.91%, the buy-side ratio is 0.43, and sell orders are densely stacked above. The 1H MACD histogram has turned positive at 0.4511, indicating short-term rebound momentum, while the 1H RSI is 44.47, showing limited upward strength. The funding rate is -0.0024%, OI is stable, and there is insufficient fuel for a short squeeze. 2437—2445 is the bearish
post-image
ETH-1.26%
$SOL Signal】1H mid-band resistance + 4H bearishness has not eased; wait for a rebound to enter a short
$SOL 99.27 is stuck below the 1H Bollinger mid-band at 99.81, with the 1H EMA20 at 99.91 capping the price. The buy-side ratio over the latest four 1H candles was between 0.43 and 0.48. The 4H MACD bearish histogram has contracted to -0.4551, while the price is moving sideways along the upper edge of the lower band at 98.73; 98.38 is the 1H Bollinger lower band. Order book depth imbalance is 6.64%, with sell orders outweighing buy orders, and the 1.14 bid/ask support cannot withstand the sel
post-image
SOL-2.50%
$ON This 15-minute candlestick showed you the “altcoin liquidity drought on the eve of the Fed rate decision.” BTC is moving sideways above $60,000, and market funds cannot even make a ripple. $ON plunged 16.71% in 24 hours, sliding from 0.1823 all the way to 0.1501, with only 2.6M in trading volume—a level of liquidity where market manipulators can send it into free fall with a casual dump. Think about it: with BTC volatility compressed to historical lows, and three days before the Fed’s FOMC meeting, funds have all retreated into stablecoins to earn interest. Altcoins are the first to be dra
ON-14.24%
BTC-1.97%
$ETH doesn’t need to be overanalyzed right now; the structure is actually quite simple. After quickly pulling back from around 2406, it rebounded and has now returned to consolidating near 2450. In the short term, 2450 is an important pivot, with the key resistance zone to watch at 2470–2480. If the price can hold above 2450 with sustained volume, then after breaking through 2480, 2500–2520 will be the next range to watch. Conversely, if 2450 is lost again, the short-term rebound structure will weaken. I remain cautious: this is not the best time to chase trades emotionally. Waiting for a conf
ETH-1.27%
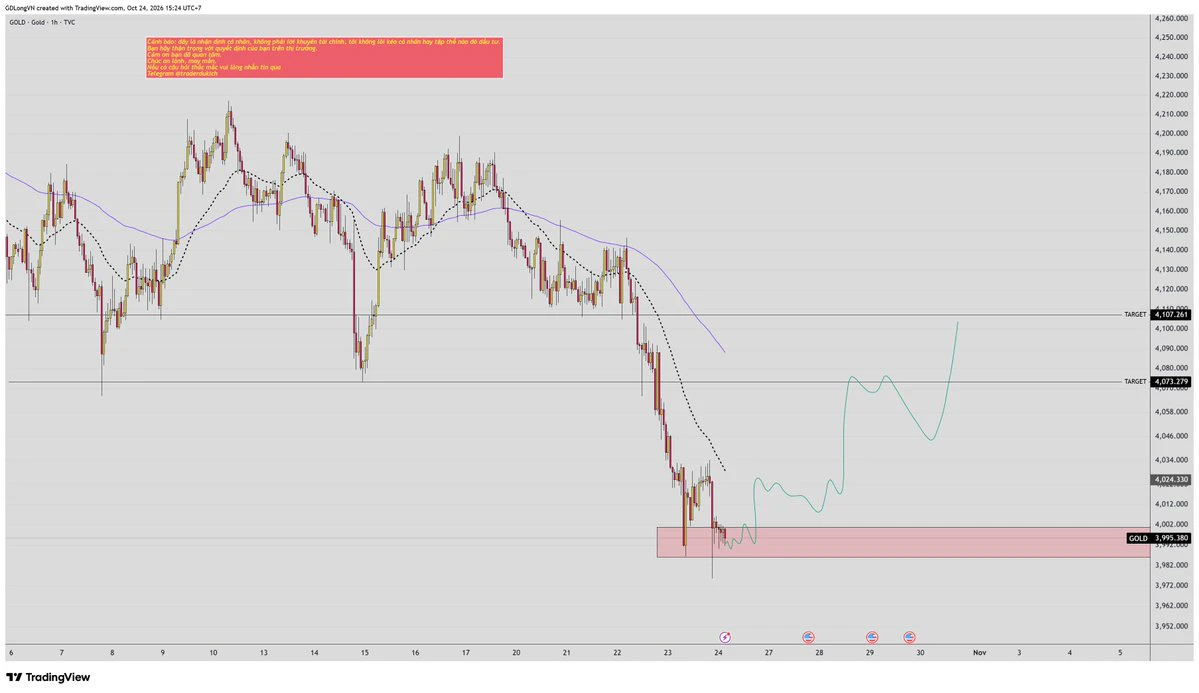
It still takes my group members to hold on. This is my junior disciple—after a candle-body breakdown below 4280, look directly to 4030.
RH $flybrain coin that goes up only
vs
pumpfun (dev building for weeks) coin that pumps and dumps
incredible tech.
and you guys are still buying pumpfun coins?
JUST IN: Solana-based meme coin RAYCAT breaches an $11M market cap ATH, up 404% in 24h. If volatility and speculative demand persist, we could see continued wild moves, but beware the risk profile. $RAYCAT
post-image
#GateTop4MainstreamCEX
🔥 The competition among mainstream crypto exchanges is getting stronger — and Gate is making its presence clearly felt.
Strong liquidity, a growing global user base, diverse trading opportunities and continuous ecosystem development are key factors behind Gate’s rising position in the CEX landscape.
The crypto market is evolving fast, and the leading exchanges are constantly competing for the next level. 🚀
I believe Gate has the potential to keep strengthening its position among the top mainstream CEX platforms.
What do you think? Can Gate reach the next level? 👀🔥
#
BTC-1.97%
GT+1.31%
SOL-2.49%
Everyone watching SKHY for a bounce is about to get blindsided by the downside.

$SKHY /USDT - SHORT

Trade Plan:
Entry: 186.04 – 187.04
SL: 191.36
TP1: 182.93
TP2: 180.52
TP3: 176.90

Why this setup?
Why now? The 1h price is sitting at 186.52 inside a tight entry zone between 186.04 and 187.04, while the 15m RSI reads 44.27, signaling fading bullish momentum without yet being oversold. The 1h ATR of 2.007551 shows enough volatility to fuel a sharp move, and the daily trend being range-bound means a breakdown from this zone can accelerate fast. The short bias targets TP1 at 182.93 and TP2 a
SKHY-3.18%
PONS Breaks Below 0.75, Robinhood Chain Memes Retreat Across the Board—Shakeout or Exit?
Guys, the Memes on Robinhood Chain have finally pulled back.
As of September 10, PONS's market cap fell to $460 million, down 19.4% in 24 hours; AI fell to $197 million, down 12.1%; CASHCAT fell to $165 million, down 14.4%; MEME fared even worse, with its market cap dropping to just $60.9 million, down 28.8% in 24 hours.
PONS is the most typical example. It surged to an all-time high of $0.9717 on September 5, rising nearly 300-fold from $0.0033 over two months. It has now fallen to around $0.72, a pullbac
PONS-5.68%
Load More

Join 40 M users in our growing community

⚡️ Join 40 M users in the crypto craze discussion

💬 Engage with your favorite top creators

👍 See what interests you

View More