Square
Following
Hot
News
Notifications
Profile
Share your thoughts
placeholder
Article
cryto live now
live-cover
LIVE991
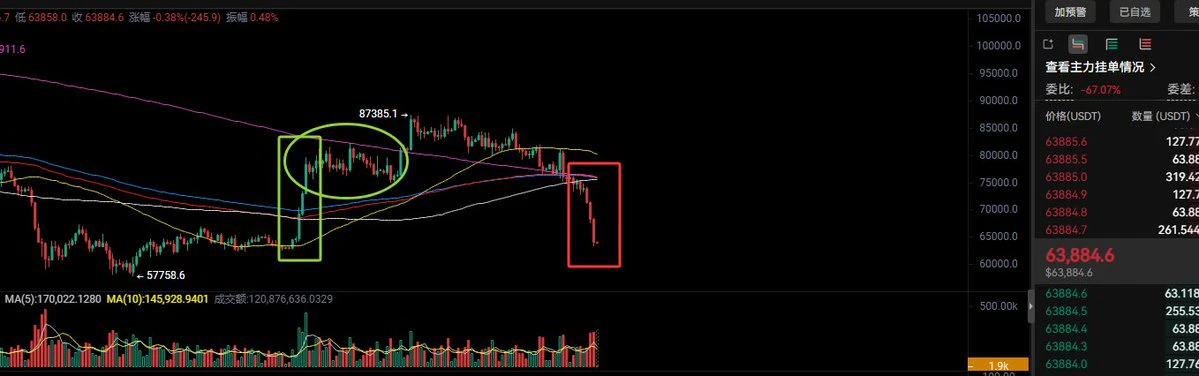
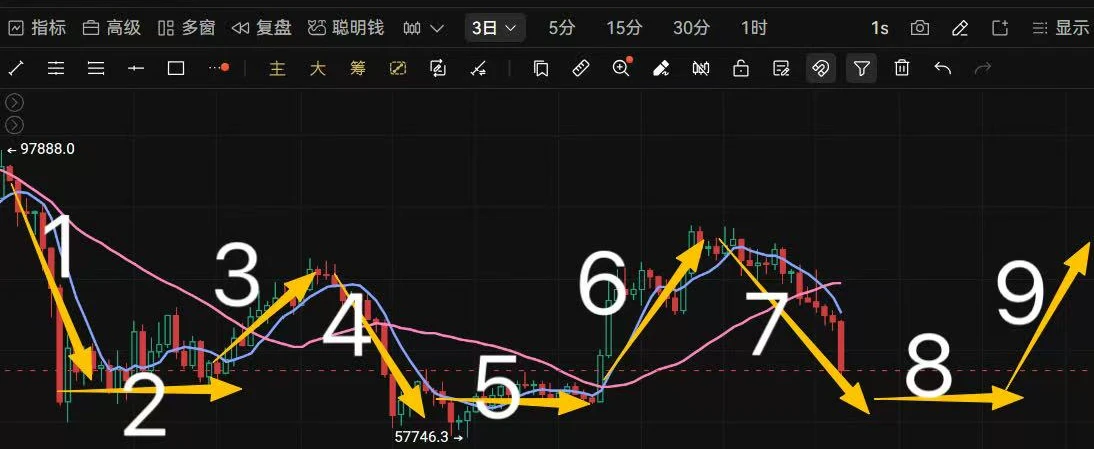
Bitcoin's candlestick chart is showing a Three Black Crows pattern. The three green crows on the left, reversed, become three red crows, which is only relevant as a reference for short-term trends.
post-image
Trenches
mihao
m
bade
b
mihao
4Cxj...pump
Market Cap
$.
Change
.
24h Vol
$.
Holders
.
Snoopy
S
bade
b
Snoopy
7mEh...47Cn
Market Cap
$.
Change
.
24h Vol
$.
Holders
.
AGT
A
bade
b
AGT
0x5d...e274
Market Cap
$.
Change
.
24h Vol
$.
Holders
.
NIO
N
bade
b
NIO
7SL2...pump
Market Cap
$.
Change
.
24h Vol
$.
Holders
.
IDOL
I
bade
b
IDOL
0x3b...ab07
Market Cap
$.
Change
.
24h Vol
$.
Holders
.
$BTC The 63272 level was tested twice this morning. The 5-minute candle at 4:50 a.m. plunged straight from 65412 to 64444, with volume instantly surging to over 560k; the 1-hour candle at 6 a.m. continued lower from 64422, and the lows of the 5-minute candles at 6:10 and 6:50 a.m. both landed exactly at 63272. The current price is hovering around 63710. Last night I still viewed 66400 as support, but it was all gone by the time I woke up. I don't see this move as an opportunity for an oversold bounce. 63272 is this morning's low; if it breaks below that level, don't rush to buy the dip. Place
post-image
BTC-0.67%
$CHIP is holding 0.02629, so I’m bullish; if it breaks 0.025, I’ll cut the loss.
$CHIP is now at 0.02666, 24h -16.084%, 7d -19.41%, 30d -42.39%.

In this defensive market, I’m leaning bullish—Fear & Greed at 10, only 2 of 61 coins are up, with a median of -11.374%; sentiment has been crushed into the bottom zone, and $CHIP has fallen even further.

First, 24h trading volume is 2277407 USDT, with a volume ratio of 0.728; this low-volume grind down isn’t distribution.

Second, OI is 198,714,131, down 20.66% from the 10-29 snapshot; leveraged positions are retreating first.

Third, the average
CHIP+4.26%
$MSTU Down 20% in a day, and at 14.82, anyone who chased the pump is already trapped. This coin is a long-short meat grinder right now. I’m so torn I’ve lost a few hairs.
Bullish case: 1) The 24h low of 14.18 held, with buyers stepping in around 14.2; 2) 10M in trading volume isn’t negligible, and liquidity is still there—it’s not dead water; 3) After a 20% drop, it’s short-term oversold, so a technical bounce could come at any moment.
Bearish case: 1) It plunged from 18.6 to 14.8, and the rebound has been pitifully weak—bulls have no strength; 2) This kind of single-day plunge usually sees a
MSTU-3.61%
  • 1
  • 1
$TRUMP respected these levels and gave us the reaction we wanted. Nothing to complain about with this trade. Nice profit. My list today includes
$DODOX and $XRP .
post-image
DODOX
DODOXDODOX
Pump.Fun
MC:$2.36KHolders:87
33.75%
TRUMP-0.95%
XRP-1.15%
All set, bro. Go ahead and open a starter position.
post-image
$BTC Interesting, from the beginning of the year until now, each cycle has been about 3 months, a little over 100 days. If my trendline is useful, the earliest we would officially enter the consolidation range is after December.
post-image
BTC-0.65%
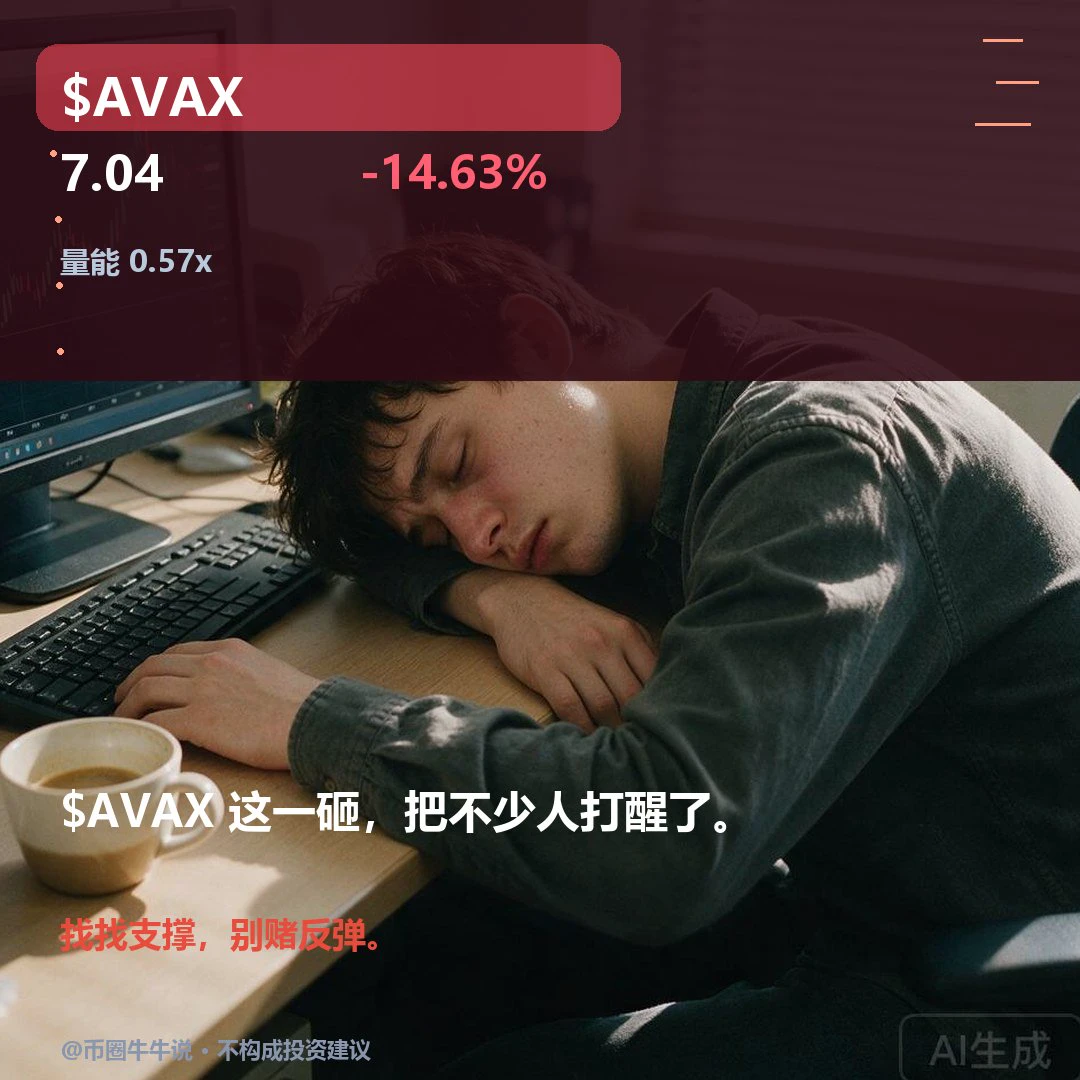
$AVAX Currently trading at 7.044, down 14.63% over 24H (range: 6.936–8.263). The 1H trend is weak, with an RSI of 12; the 4H trend is weak, with an RSI of 20. If it decisively breaks above 8.253, continue watching for further upside. If it falls below the 6.936 support, the short-term structure may weaken. Market volatility is high; for observation only.
post-image
AVAX-0.10%
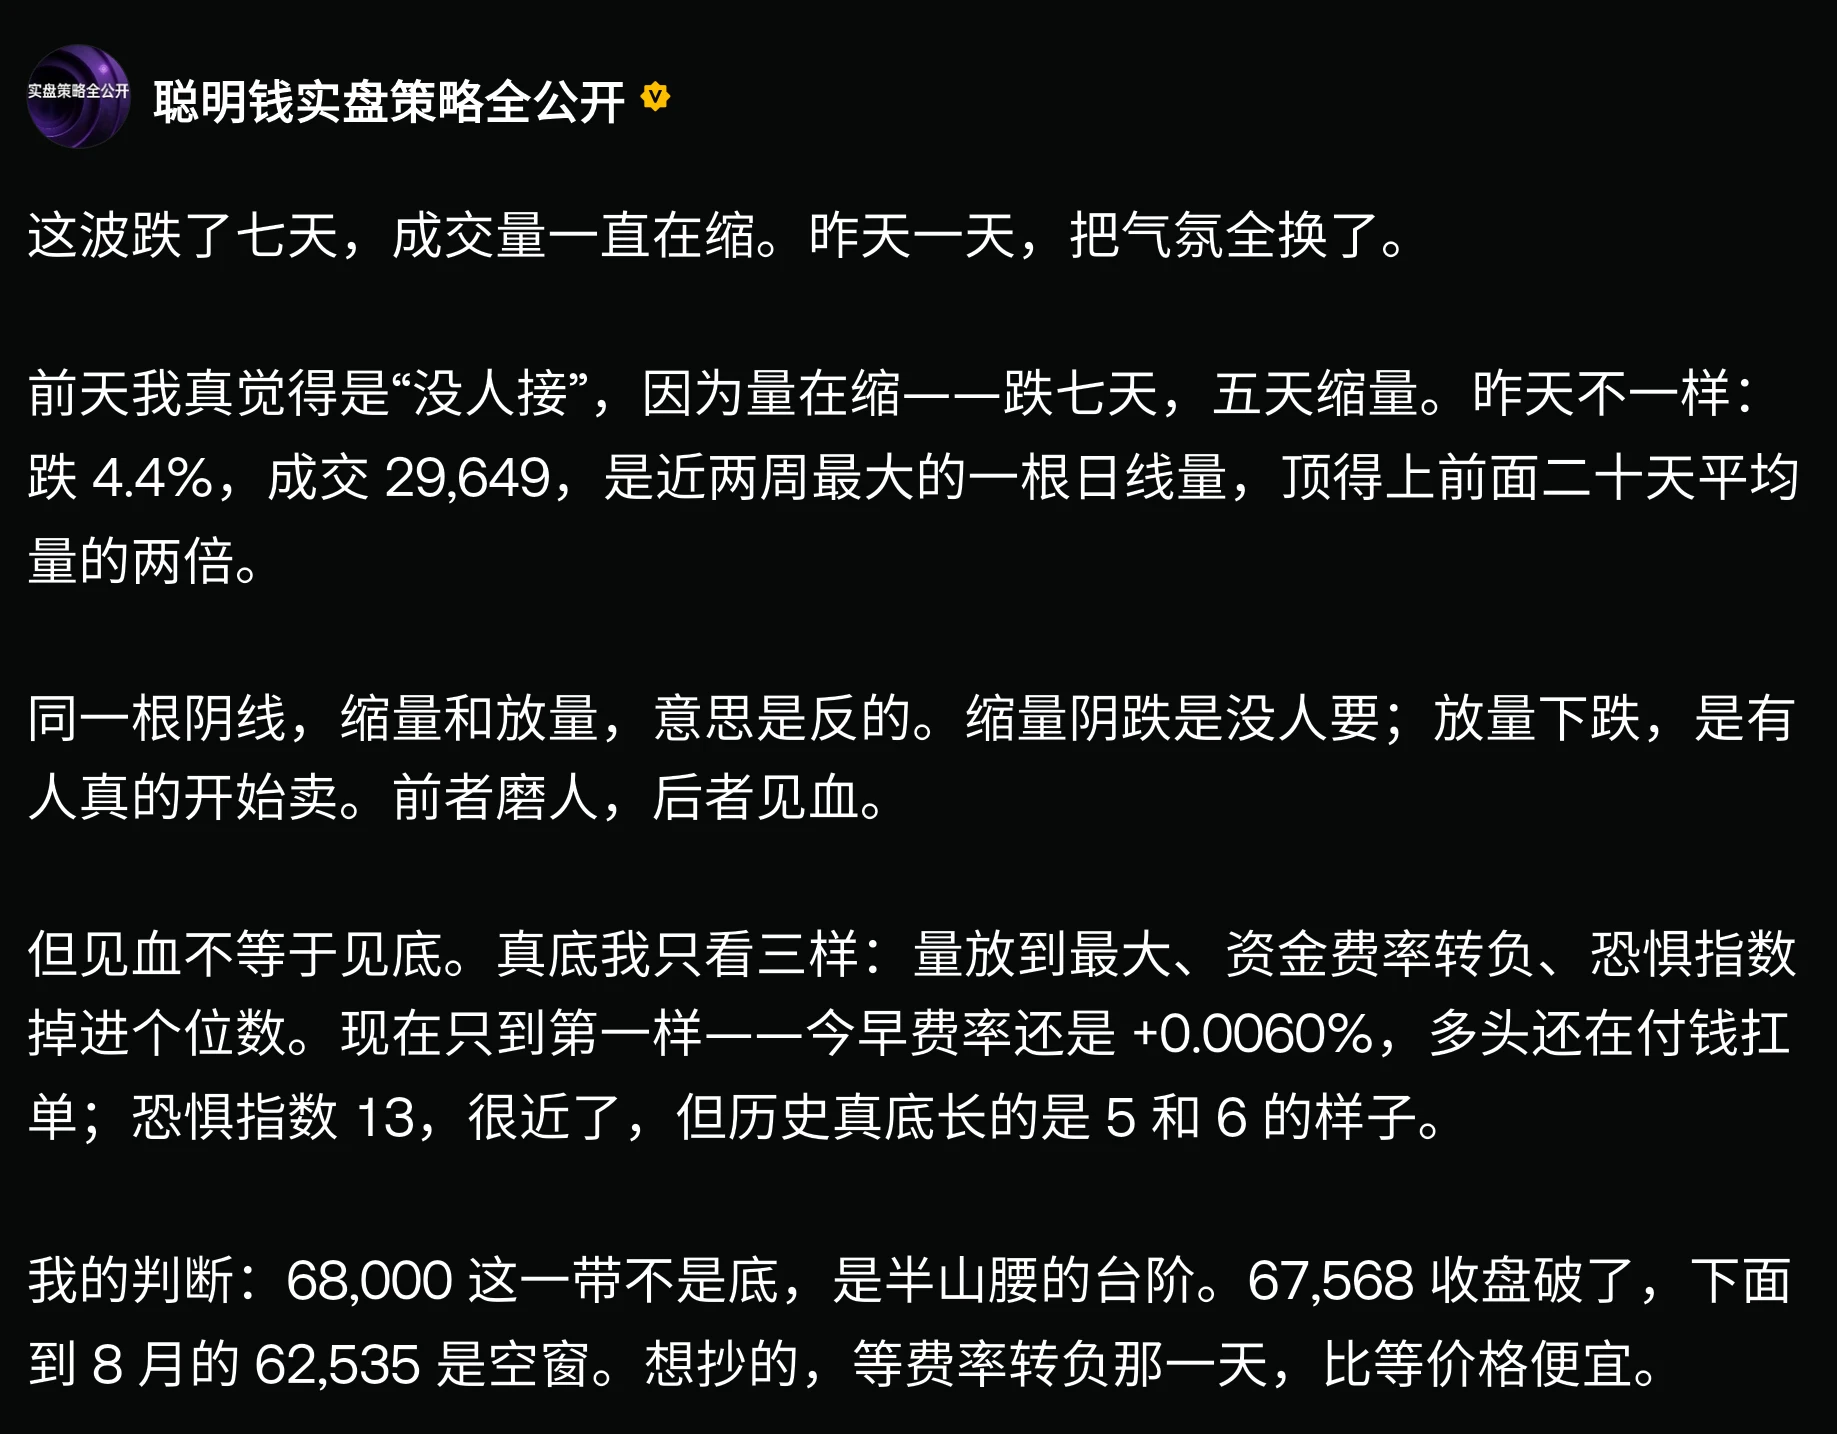
Yesterday's analysis: price has reached 62,500

This number has appeared on only seven days in the past sixteen months. In two stretches: once in early February this year, then four days in a row from June 3 to 6, with a low of 15.5. Today is the seventh day.

I specifically went back and looked at that stretch in June. After RSI plunged to 15.5, the price didn't stop—it fell another $1,331 from 59,131, only truly bottoming at 57,800.

So today, I'm not telling you to buy the dip. Extreme oversold conditions only mean the downward pressure is easing; they don't mean the trend has reversed. Wee
post-image
Unprecedented—they really pulled off a run through four teams! Two words: badass. Congrats, BLG. This moment made it all worthwhile for every Summoner watching on screen. Here's to our youth!
post-image
  • 1
Bin, bro, you're the world's best top laner—taking on four by yourself! Check out my order from November 6!
post-image
4-4.10%
  • 2
Im going to give a challenge.
Can anyone find a more accurate analyst?
$1000 $USTD if you can!
Good luck!
I'm the $FINE'EST in the game!
post-image
I thought sentiment might get a breather over the weekend.
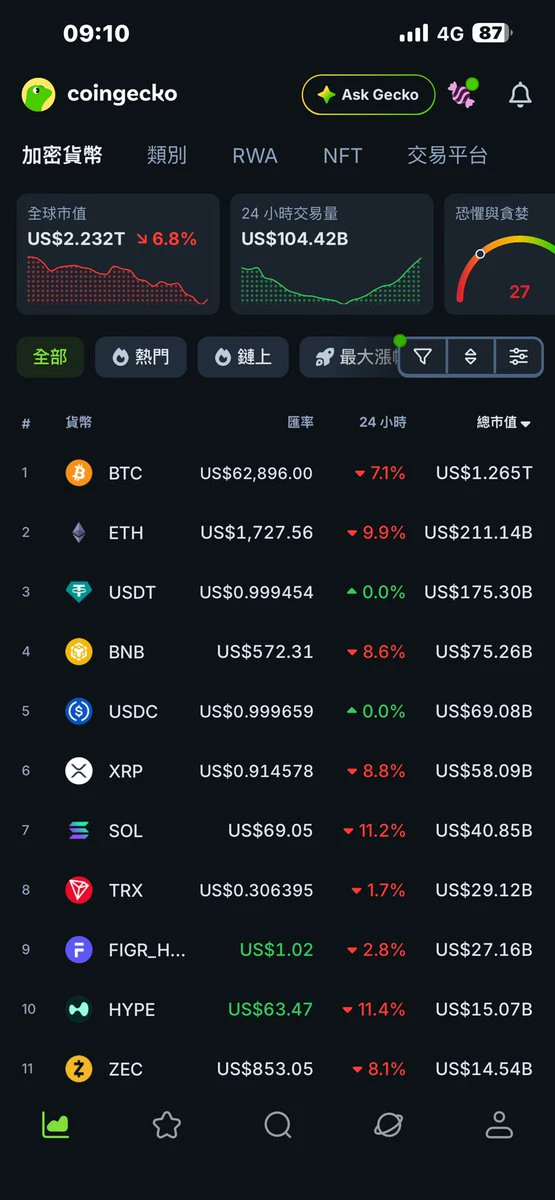
This morning, the Fear & Greed Index hit 10, still in extreme fear territory.
It was 13 yesterday and 20 the day before, a 10-point drop over two days, now below July 1's reading of 11. The last time it was 10 or lower was June 10, when it stood at 9.
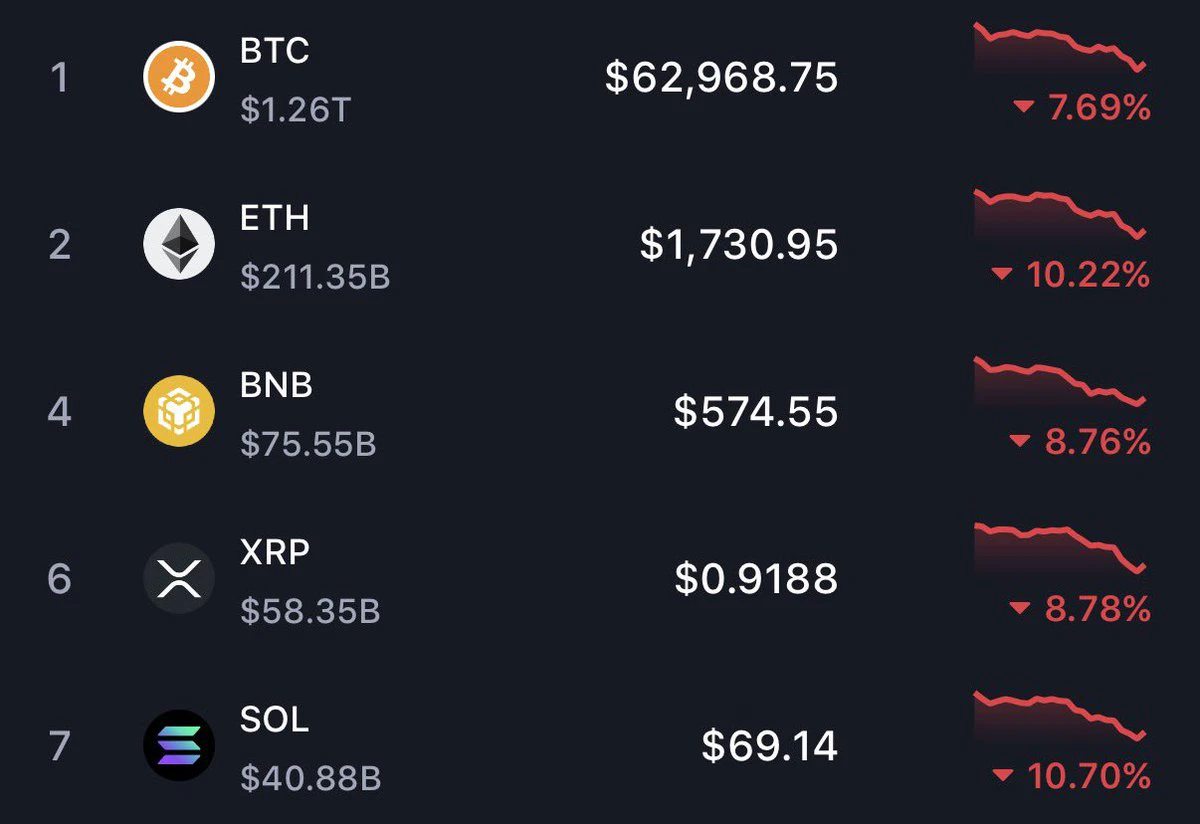
BTC is currently around $63,900, down about 6.5%ETH is currently around $1,761, down about -9%SOL remains near 70.
The thermometer itself has already taken a tumble. I'll just note the readings for now and hold off on drawing conclusions.
post-image
BTC-0.67%
ETH-1.26%
SOL-0.77%
Since early October, I openly called the top of this cycle in advance. Through the several swings in between and now, have all my calls come true one by one? PEPE, ZEC, and so on, including NAS topping—have they all been right? I’m just asking: who else? The timing to buy the bottom? Haha, I mentioned it very early on. All the posts can be verified!$BTC $ETH #比特币跌破7万美元 #黄仁勋辞职 #美国初请失业金人数高于预期
BTC-0.65%
ETH-1.23%
Holy shit! The Fear Index just hit 1.
Even “extreme fear” doesn’t do it justice—we’ve gone straight to heaven! 📉
BTC hit 63000?! 😱
The whole market’s in the ICU; the great escape has begun! 🏃‍♂️💨
#BTC
BTC-0.67%
#KYO Can you spread your wings and take your fans for a ride? Don’t leave us in the stinking gutter—we can only survive together, right?
post-image
KYO+0.06%
Crypto continues to crash
Thank you, Democrats
post-image
BTC market update
live-cover
LIVE1,984
ETH | Short 🔴 | Bearish | 15m 24 hours: -8.17% | Volume: 13603.2M USDT Short rationale: Price below EMA200; EMA20/50/200 bearishly aligned; RSI14 at 29.2; MACD histogram negative; ADX14 at 56.9; volume is 0.40x the 20-candle average; trend pullback/continuation. Entry: 1750.23 Stop loss: 1798.44 Take profit 1: 1689.97 | Take profit 2: 1653.81 | Take profit 3: 1605.6 Entry levels are for reference only; do not chase the price. This strategy is invalidated if the stop-loss level is hit. Technical analysis strategy only, not investment advice. $ETH
post-image
ETH-1.23%
Load More

Join 40 M users in our growing community

⚡️ Join 40 M users in the crypto craze discussion

💬 Engage with your favorite top creators

👍 See what interests you

Trending Topics

GateIPOAccessAnthropic

334.5K Views2.9K Discussing

Gate IPO Access Phase 3 features Anthropic (ANT), with USDT subscription interest starting from 100 USDT. Successful allocations will be delivered as real shares to Gate Stock Accounts. Indicative price: $70–$78/share Subscription: Nov 12–17 (UTC+8) Allocation is not guaranteed. Please manage risk accordingly.

Dr.HanOxfordUnionSpeech

149.8K Views675 Discussing

USOctoberPPIBelowExpectations

474K Views1.6K Discussing

View More