Square
Following
Hot
News
Profile
Share your thoughts
placeholder
Article
Don't fall into the trap of self-justification,
Regularly ask yourself about your core position: if you didn't hold it today, knowing the information in front of you, would you still be willing to buy it?
post-image
$USD1 has reached 1.0003USDT, but hourly trading participation is only 0.30x, making the move look somewhat weak. The price has moved, but volume has not followed. In this situation, focusing only on candlestick colors can easily lead you to overestimate the move’s staying power. The price has already broken above the 1-hour support at 1.0001, while the 1-hour resistance at 1.0004 still lies ahead. This looks more like a tentative breakout than the start of a genuine trend.
If 1.0004 is actually broken, the credibility of this rally will improve significantly. But low participation currently u
post-image
USD1-0.01%
Trenches
AGT
A
bade
b
AGT
0x5d...e274
Market Cap
$.
Change
.
24h Vol
$.
Holders
.
CNPY
C
bade
b
CNPY
0xc6...ddd2
Market Cap
$.
Change
.
24h Vol
$.
Holders
.
Q
Q
bade
b
Q
0xc0...0589
Market Cap
$.
Change
.
24h Vol
$.
Holders
.
Gato
G
bade
b
Gato
55A3...pump
Market Cap
$.
Change
.
24h Vol
$.
Holders
.
DOPE
D
bade
b
DOPE
0xf9...8899
Market Cap
$.
Change
.
24h Vol
$.
Holders
.
$UNI has reached 7.185 USDT, but one-hour trading participation is only 0.66x, showing some weakness. The price is approaching the one-hour resistance at 7.36, but whether it can truly break through and hold remains to be seen. This looks more like a tentative breakout than a genuine hold.
The price has reached the threshold, but touching, breaking through, and holding are three different things. If $UNI can decisively break above 7.36 and stay above that level, it would be a positive signal. But if the price fluctuates repeatedly around 7.36, or even falls back to the one-hour support at 6.99
post-image
UNI-0.67%
📗Macro Schedule (Time)

✅10.19 Monday
14:00 Opening ceremony of the Financial Street Forum Annual Meeting; senior officials from the central bank, SAFE, and CSRC to speak; Fed discount rate closed-door meeting (no exact public time)
✅10.20 Tuesday
09:00 LPR loan prime rate announcement; Fed governors' closed-door meeting
✅10.21 Wednesday
Morning APEC Finance Ministers' Meeting and post-meeting press conference (Hong Kong venue)
✅10.22 Thursday
Evening European Parliament vote on a resolution related to Black Sea shipping
✅10.23 Friday
Evening U.S. consumer and manufacturing economic data rel
post-image
What Warsh Said—and Didn’t Say: Reading Between the Lines of His IMF Fireside Chat
At 11:30 this morning, Fed Chair Warsh had a fireside chat with IMF Managing Director Georgieva at the IMF annual meeting in Bangkok. I watched the livestream from start to finish, looking for clues in his wording about an October rate hike. In the end, he said almost nothing.
Warsh’s exact words were: “I don’t prejudge the decision at any meeting. I don’t think it’s appropriate to preview what actions I might take at the remaining meetings this year.” He only made one remark while looking back at September’s ra
AAPL+0.43%
BREAKING: Meta's Muse Wonder and Muse Spark are now live on Venice, available privately. Venice also added NVIDIA's Nemotron 3.5 Super VL and Tencent's Hy4 Preview since October 15.
@AskVenice
NVDA-1.42%
TENCENT+0.00%
$INTC just printed a close at $90.02, with a jaw-dropping RSI of 21.19—deep in oversold territory, yet selling pressure remains relentless. The next key battleground is the $85.84–$81.81 support zone, where history says bounces can get violent and unpredictable.
INTC-5.78%
  • 2
EIA data determines the short-term direction of crude oil
live-cover
LIVE88
#NEARJumpsNearly10% #ShareWeekly
INFLATION SHOCK, BITCOIN AT $82K, NEAR’S RALLY, AND NVIDIA: WHAT COMES NEXT FOR THE CRYPTO MARKET?
The financial markets are entering a critical phase where inflation, Federal Reserve policy, technological innovation, and speculative trading are shaping investor sentiment. The latest U.S. Producer Price Index (PPI) data has challenged expectations of a smooth monetary easing cycle, while Bitcoin’s recovery toward $82,000, NEAR Protocol’s nearly 10% surge, and renewed meme-coin speculation reveal a market full of contrasting signals.
1. U.S. PPI: Inflation Rema
BTC+0.13%
NVDA-1.42%
MEME-3.02%
TSLAX-0.39%
TOKEN-1.44%
🚀🏆 GATE WCTCS9 GLOBAL TRADING COMPETITION — THE ULTIMATE TRADING CHALLENGE IS HERE! 🌍📈
The excitement is building as the #GateWCTCS9GlobalTradingCompetition brings the spotlight to global trading, market strategy, and competitive performance! 🔥 Traders around the world are always searching for opportunities to sharpen their skills, test their strategies, and demonstrate their ability to navigate fast-moving financial markets. Competitions like this create an exciting environment where preparation, discipline, and smart decision-making take center stage.
🌎 A GLOBAL STAGE FOR TRADING AMBIT
post-image
  • 2
#日韩股集体大跌
KOSPI +3.3%: A relief bounce or the start of a recovery?
My initial assessment: This appears to be a potential relief rally; however, a single strong session is not enough to confirm a broader recovery. The key question is whether semiconductor stocks can sustain this rebound following the sharp sell-off, or if the gains are merely driven by short covering and bargain hunting.
The gains seen in Samsung Electronics (+3.6%) and SK Hynix (+3.4%) are particularly significant, as the South Korean market is highly sensitive to semiconductor sentiment and the global AI-memory trade.
What is
post-image
ybaser
#日韩股集体大跌
KOSPI +3.3%: A relief bounce or the start of a recovery?
My initial assessment: This appears to be a potential relief rally; however, a single strong session is not enough to confirm a broader recovery. The key question is whether semiconductor stocks can sustain this rebound following the sharp sell-off, or if the gains are merely driven by short covering and bargain hunting.
The gains seen in Samsung Electronics (+3.6%) and SK Hynix (+3.4%) are particularly significant, as the South Korean market is highly sensitive to semiconductor sentiment and the global AI-memory trade.
What is driving the recovery?
1. The sell-off may have overshot the fundamentals
On October 15, the KOSPI fell by 7.57%, closing at a six-month low following seven consecutive days of losses. During this sell-off, Samsung and SK Hynix lost 23.9% and 31.5% of their value, respectively—creating an opening for bargain hunters to return.
2. Memory chip fundamentals remain supportive
Analysts continue to highlight tight memory supply, robust demand related to artificial intelligence, and expectations for rising DRAM prices. This supports the view that the sell-off was driven more by sentiment and positioning than by a collapse in earnings expectations.
3. Global risk appetite has improved
A recovery in U.S. equities, combined with easing concerns regarding AI-related credit risks, has helped fuel a rebound in Asian technology stocks. However, concerns regarding returns on investment in artificial intelligence, financing costs, and interest rates have not dissipated.
A relief rally or a sustainable recovery?
Bullish scenario — a lasting recovery
* The KOSPI remains above its recent low.
* Samsung and SK Hynix continue their recovery.
* Foreign investors return as net buyers.
* Earnings forecasts and expectations for memory chip prices remain robust.
Bearish scenario — a short-lived rebound
* The index rises toward a resistance level and then reverses.
* Foreign investors continue to sell Korean stocks.
* U.S. bond yields rise, or renewed concerns regarding AI valuations weigh on chip stocks.
* Samsung and SK Hynix fall back below their recovery levels.
What should investors watch for next?
The most critical indicator is not the magnitude of the initial rebound, but whether buying pressure is sustained.
Indicator Bullish interpretation
Foreign investor flows Consistent net buying
Samsung and SK Hynix Gains sustained over several sessions
Memory chip pricing Continued strength in DRAM and HBM
U.S. Treasury yields Stabilization or decline
Earnings expectations Maintenance of upward revisions
A key distinction: On October 16, the KOSPI recorded an intraday gain of up to 3.17%, but closed the day up 2.05% at 5,668.05. Consequently, the sharp intraday rally made the final gain at the close appear more significant than it actually was.
My View
Short-term: Cautiously optimistic
A recovery is possible.
Oversold conditions and attractive entry points could support further gains, though volatility is likely to remain high.
Medium-term: Conditional
Not yet confirmed.
A more substantial recovery would require the stabilization of foreign investor inflows, supportive earnings data, and a more durable improvement in sentiment toward the global technology market.
In summary: I view the 3.3% move not as proof that the downtrend has ended, but as a promising first step. Earnings expectations for the semiconductor sector provide a firmer foundation for this recovery—moving it beyond a mere technical rebound—but the market must demonstrate that buyers are willing to hold their positions, even amidst renewed volatility.
A key factor to watch in the near term will be the earnings outlooks from SK Hynix and Samsung Electronics, set to be released on October 28 and October 29, respectively. These reports could prove decisive in determining whether the recent sell-off was an overreaction or if it reflects a more fundamental reassessment of the AI-driven memory market.
$MU ‌
$SNDK ‌$NVDA ‌
repost-content-media
  • 7
  • 1
Can stablecoins also have a directional bias? Bottom line: yes, but only for mean reversion within an extremely narrow range, and $U currently has a clear edge in relative sideways strength.
Sector comparison: $SOL is trading at 103.48, with MA5 below MA20, RSI at 44.7, bearish MACD, a funding rate of -0.0022%, and a range of about 3.89% over 30 candles; $APT is trading at 0.7936, down 5.56% over 24h, with RSI at just 37.2, bearish MACD, and a range of about 10.99%. Both are below their moving averages, with weak momentum. By contrast, $U is trading at 1.0007, with MA5=1.00064 above MA20=1.
post-image
SOL-0.75%
APT-4.78%
$EPIC It surged 18% in a day, briefly touching 0.3350 before dumping back to 0.2884. That long upper wick is no joke.
First, the signal: this is a classic high-volume spike and retracement. The 24-hour trading volume of 72.2M alongside an 18.29% gain shows the volume is real, but that wick at 0.3350 indicates very heavy overhead selling pressure. From the low of 0.2182 to 0.3350, the price gained 53%, so profit-taking at this level is perfectly normal. Technically, 0.2884 sits just below the midpoint of the intraday gain, putting it in the pullback confirmation phase—not a breakout entry poin
EPIC+20.73%
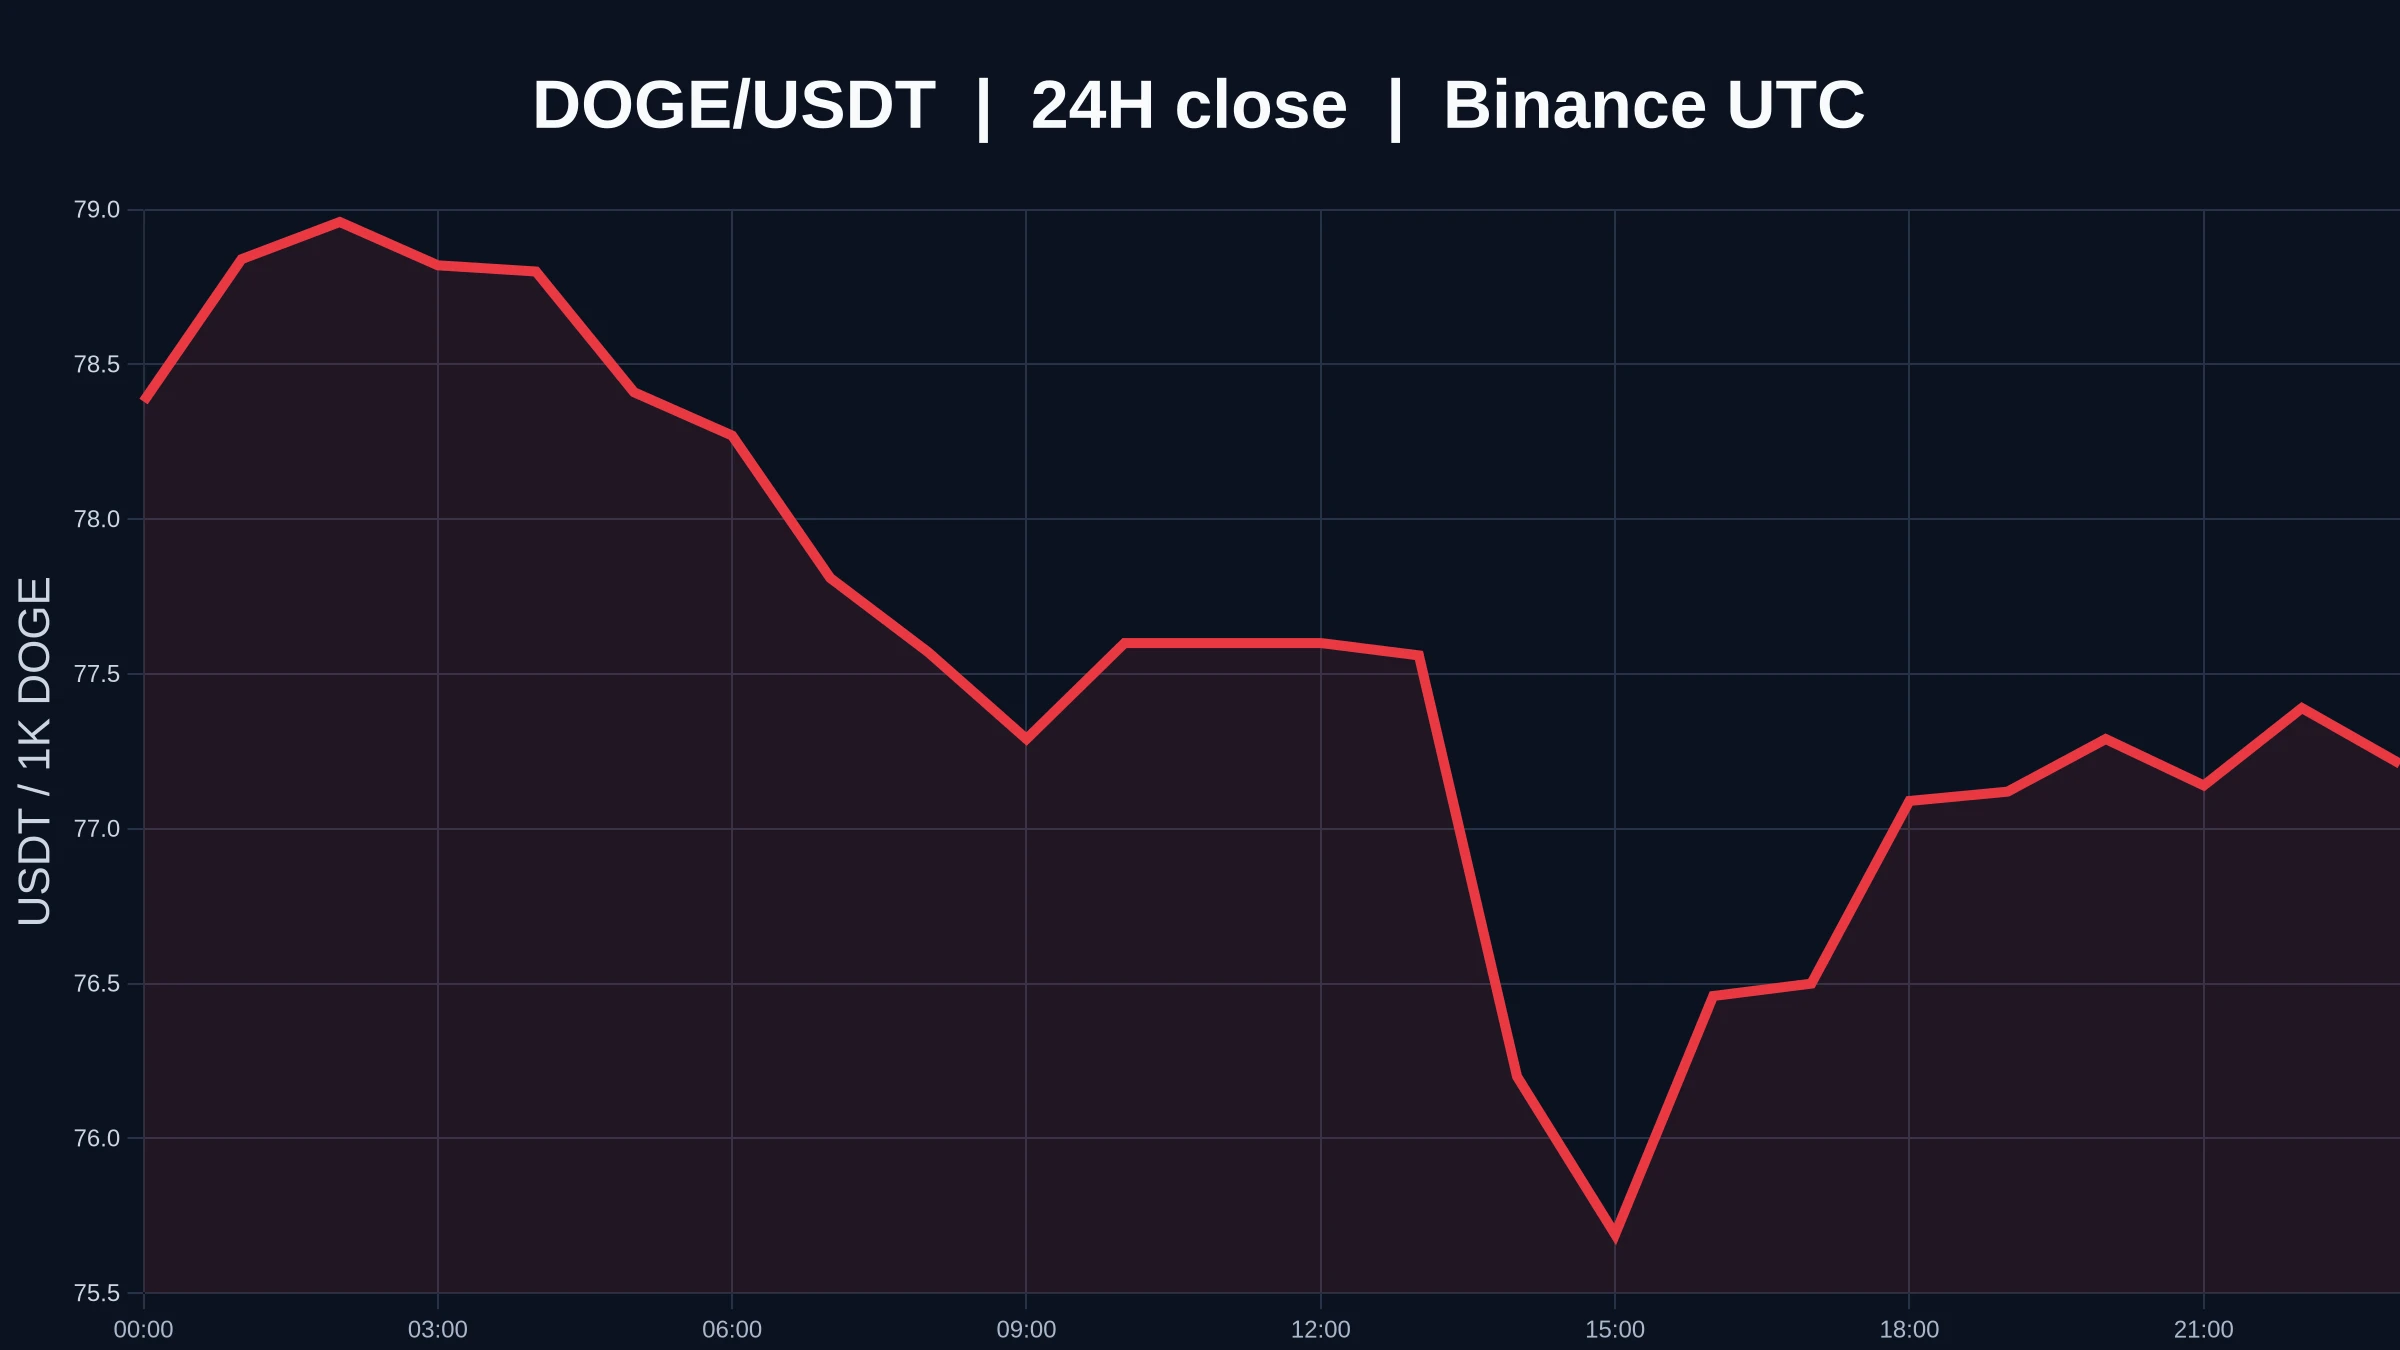
Good morning, $DOGE fam! 🤝🐕
Gm C X ☕️🌎
Happy weekend! ✌️🌦🍂
Dogecoin to the moon! 🚀🌑
post-image
DOGE-1.06%
$CAKE Current price: 2.19. Key short-term levels are 2.157 (Bollinger lower band) and 2.1967 (MA20). In terms of moving averages, MA5=2.1936 remains below MA20, indicating a weak bearish alignment, but the gap is only 0.003, and the convergence of the moving averages means a directional move is approaching; the MACD histogram at -0.002064 is bearish, but its absolute value is extremely small, suggesting momentum is nearly exhausted; RSI at 48.0 is in neutral-to-weak territory, with neither oversold rebound momentum nor overbought pullback pressure; the price is near the Bollinger lower band a
post-image
CAKE+0.82%
LSK+12.67%
ERA+17.26%
#美股存储板块跌幅扩大 #ShareWeekly
U.S. Tech Selloff Deepens: Is the AI Boom Facing a Credit Reality Check?
The latest U.S. technology selloff is revealing a deeper problem than expensive stock valuations. Investors are increasingly questioning whether the enormous investment in artificial intelligence infrastructure can generate enough cash flow to justify its financing costs. This shift makes October’s correction fundamentally different from the July pullback.
1. July vs. October: Two Different Market Risks
In July, concerns centered on rising AI capital expenditure, crowded semiconductor positions,
QQQ-2.50%
SOXX-4.13%
SPX500-0.40%
US500-1.06%
CRWV-11.90%
🌈 #GateLiveStreamingInspiration -October 18
Go live with the following topics now to receive extra official support and promotional exposure!Today's Topic Recommendations:
🔹 Vitalik compares the costs of BTC mining and AI inference: electricity costs account for nearly half of the cost, while the latter relies more on computing power capital expenditure.
🔹 Arthur Hayes: The so-called quantum threat in cryptography is "nonsense"; users only need to pay attention to wallet management.
🔹 A new perspective on AI-driven fraud prevention: Actively allowing oneself to be scammed in order to gathe
post-image
BTC+0.13%
  • 6
  • 2
For subscribers, I placed a long order at 2365, but I accidentally placed mine at 2355—ugh!
  • 1
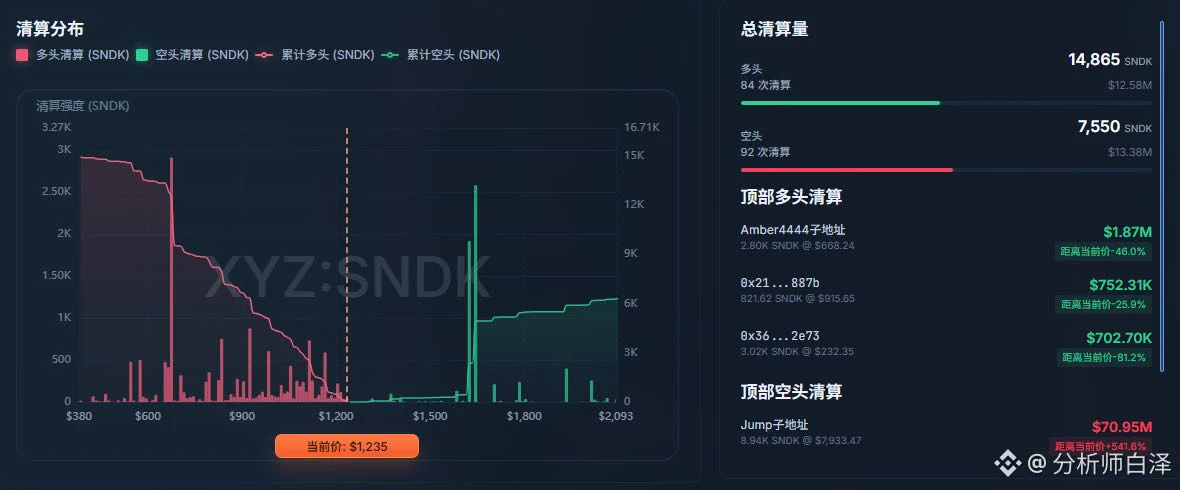
$SNDK SHORT SETUP — SELLERS IN CONTROL! 📉**
Entry: 1265 – 1280 (Short)
SL: 1308
TP1: 1240
TP2: 1215
TP3: 1185
$SNDK has broken below its consolidation zone, with strong selling pressure. The current bounce looks weak.
As long as 1308 holds, further downside remains possible.
**Wait for a bearish rejection before entry.**
post-image
SNDK-2.24%
  • 3
Load More

Join 40 M users in our growing community

⚡️ Join 40 M users in the crypto craze discussion

💬 Engage with your favorite top creators

👍 See what interests you

Trending Topics

USSeptemberPPIBeatsExpectations

91.35k Views1.93k Discussing

US September PPI came in at 6.3% YoY, well above the 5.3% market expectation, pointing to renewed producer-side inflation pressure. Weekly jobless claims were 199K, broadly in line with forecasts. Could hotter inflation further reduce room for rate cuts, and what does it mean for $BTC, US stocks, and gold?

GateWCTCS9GlobalTradingCompetition

37.87k Views6.69k Discussing

GateBTCAndETHFuturesVolumeRanksTop3

53.8k Views1.82k Discussing

View More