

Square
Following
Hot
News
Profile
Share your thoughts
placeholder
Article
What Is Multi-Timeframe Analysis? Why Doesn’t a Bullish Short-Term Chart Mean the Long-Term Trend Is Also Rising?
In crypto trading, the same asset can show completely different price action across different timeframes. The 15-minute chart may be rising, while the 4-hour chart is still in a downtrend, and the daily chart may show the market moving sideways. Looking at just one timeframe can easily lead you to mistake a brief rebound for a trend reversal.
First, what is multi-timeframe analysis?
Multi-timeframe analysis means observing price action across different timeframes at the same time t
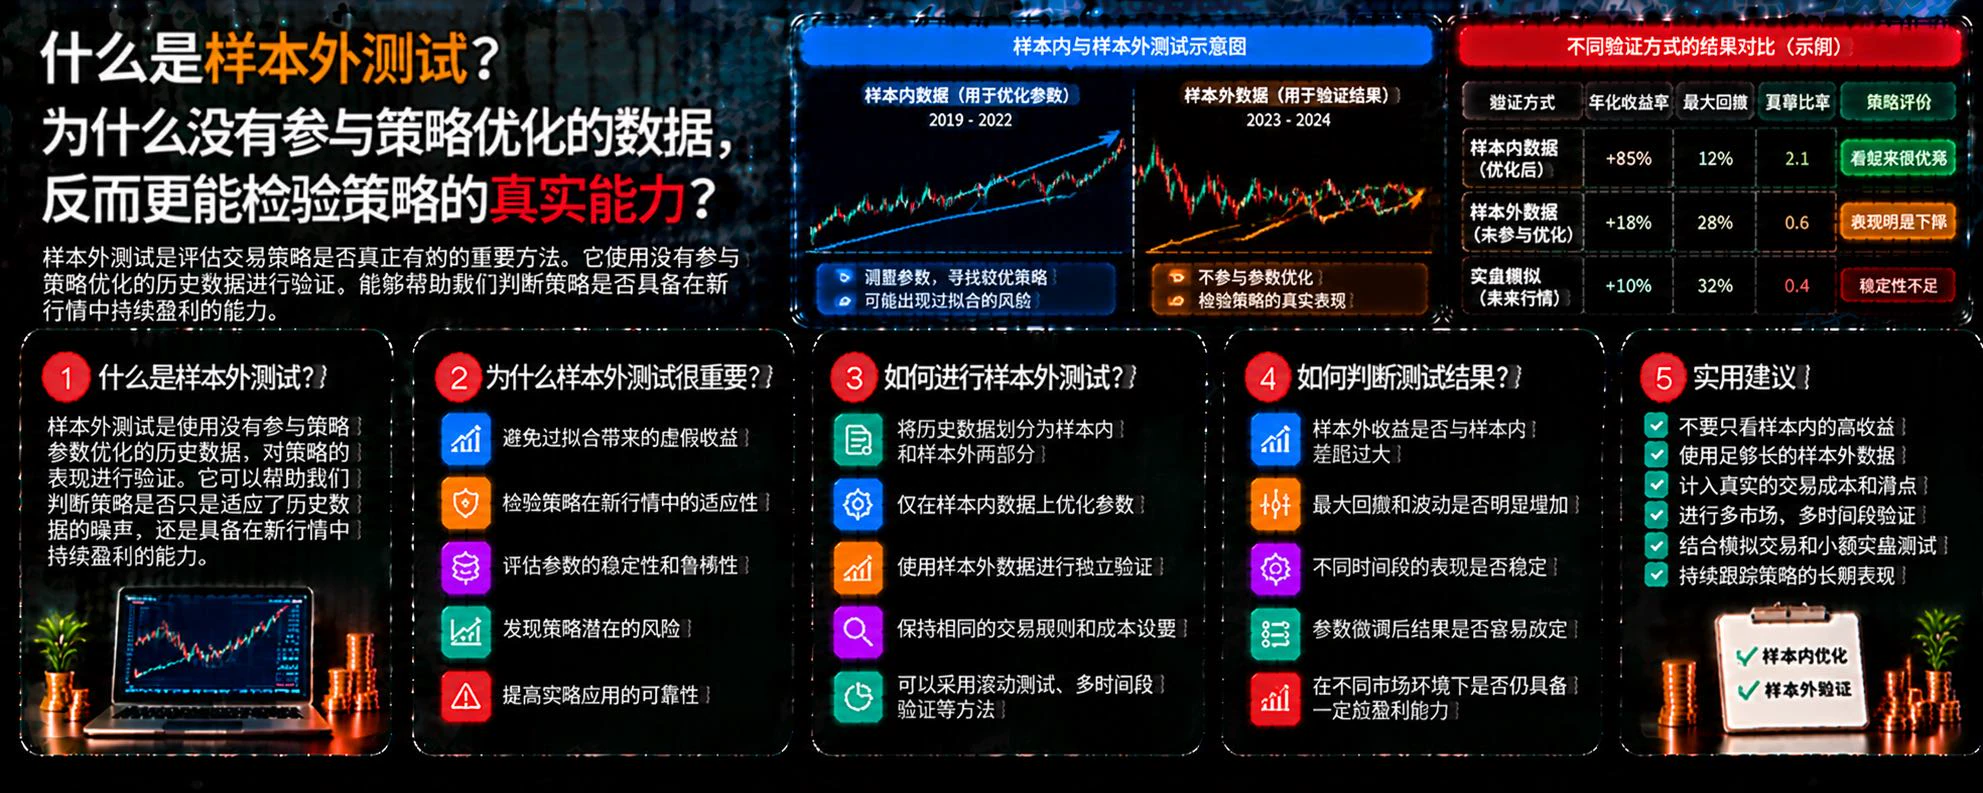
What Is Out-of-Sample Testing? Why Can Data Not Used in Strategy Optimization Better Test a Strategy’s True Capabilities?
In cryptocurrency trading, a strategy may perform exceptionally well in historical backtests, yet quickly fail in new market conditions. The problem may not lie in the trading logic itself; the strategy may also be overfitted to the historical data used for optimization. Out-of-sample testing is an important method for identifying this issue.
First, what is out-of-sample testing?
Out-of-sample testing means using data that was not involved in strategy development or paramet
post-image
  • 1
Trenches
TTWO
T
bade
b
TTWO
TTWo...FbKo
Market Cap
$.
Change
.
24h Vol
$.
Holders
.
BNCB
B
bade
b
BNCB
0x49...ec3f
Market Cap
$.
Change
.
24h Vol
$.
Holders
.
DJT
D
bade
b
DJT
DJTu...xvoF
Market Cap
$.
Change
.
24h Vol
$.
Holders
.
STONK
S
bade
b
STONK
6GmA...UNgx
Market Cap
$.
Change
.
24h Vol
$.
Holders
.
ZIG
Z
bade
b
ZIG
0x8c...1145
Market Cap
$.
Change
.
24h Vol
$.
Holders
.
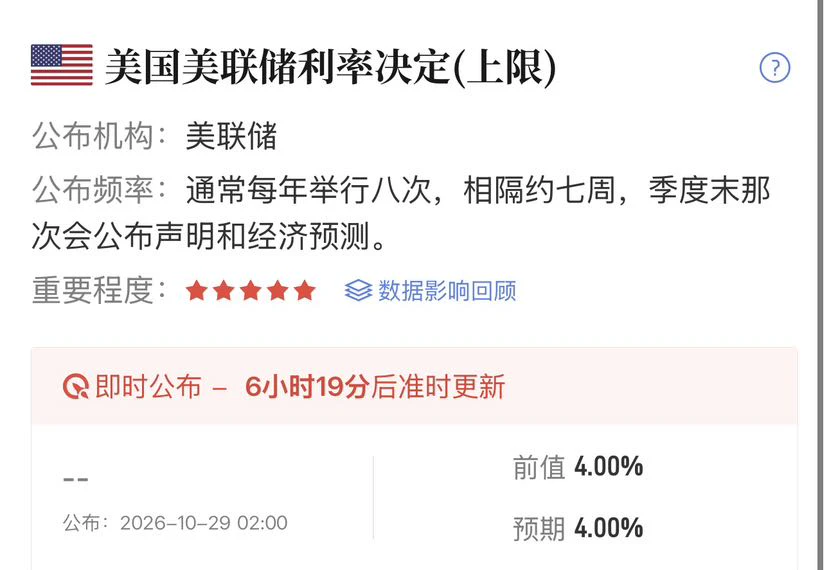
The interest rate decision is due in the early hours, and volatility is likely to be high before and after the announcement, with frequent wicks. Don’t take a heavy position in advance to bet on the direction. It’s better to wait for the remarks and act once the signals are clear. Of course, I repeatedly entered long positions around 79300-79700 and publicly said I was looking toward 82000. I also advised reducing exposure today. From here, keep a core position with protection and let the rest run. The hourly structure looks good. For those already out of the market, going long again on a pull
post-image
  • 1
【Bearish Battle Range. Holding an Initial Position While Waiting for More Signals】
BTC
Bottom line: I’m subjectively bearish, and I’ve entered an initial position as planned.
I’ve already entered an initial position at 81288 on the left side as planned. Now we’ll see whether it drops back below 81, where I’ll add on the right side, or continues up to 82/83, where I’ll add if the volume and price action are suitable. Note that a drop back below 81 needs to come with some volume before I add~
Based on the contract data, neither bulls nor bears are making major moves. They’re probably all waiting
post-image
HeyElwin
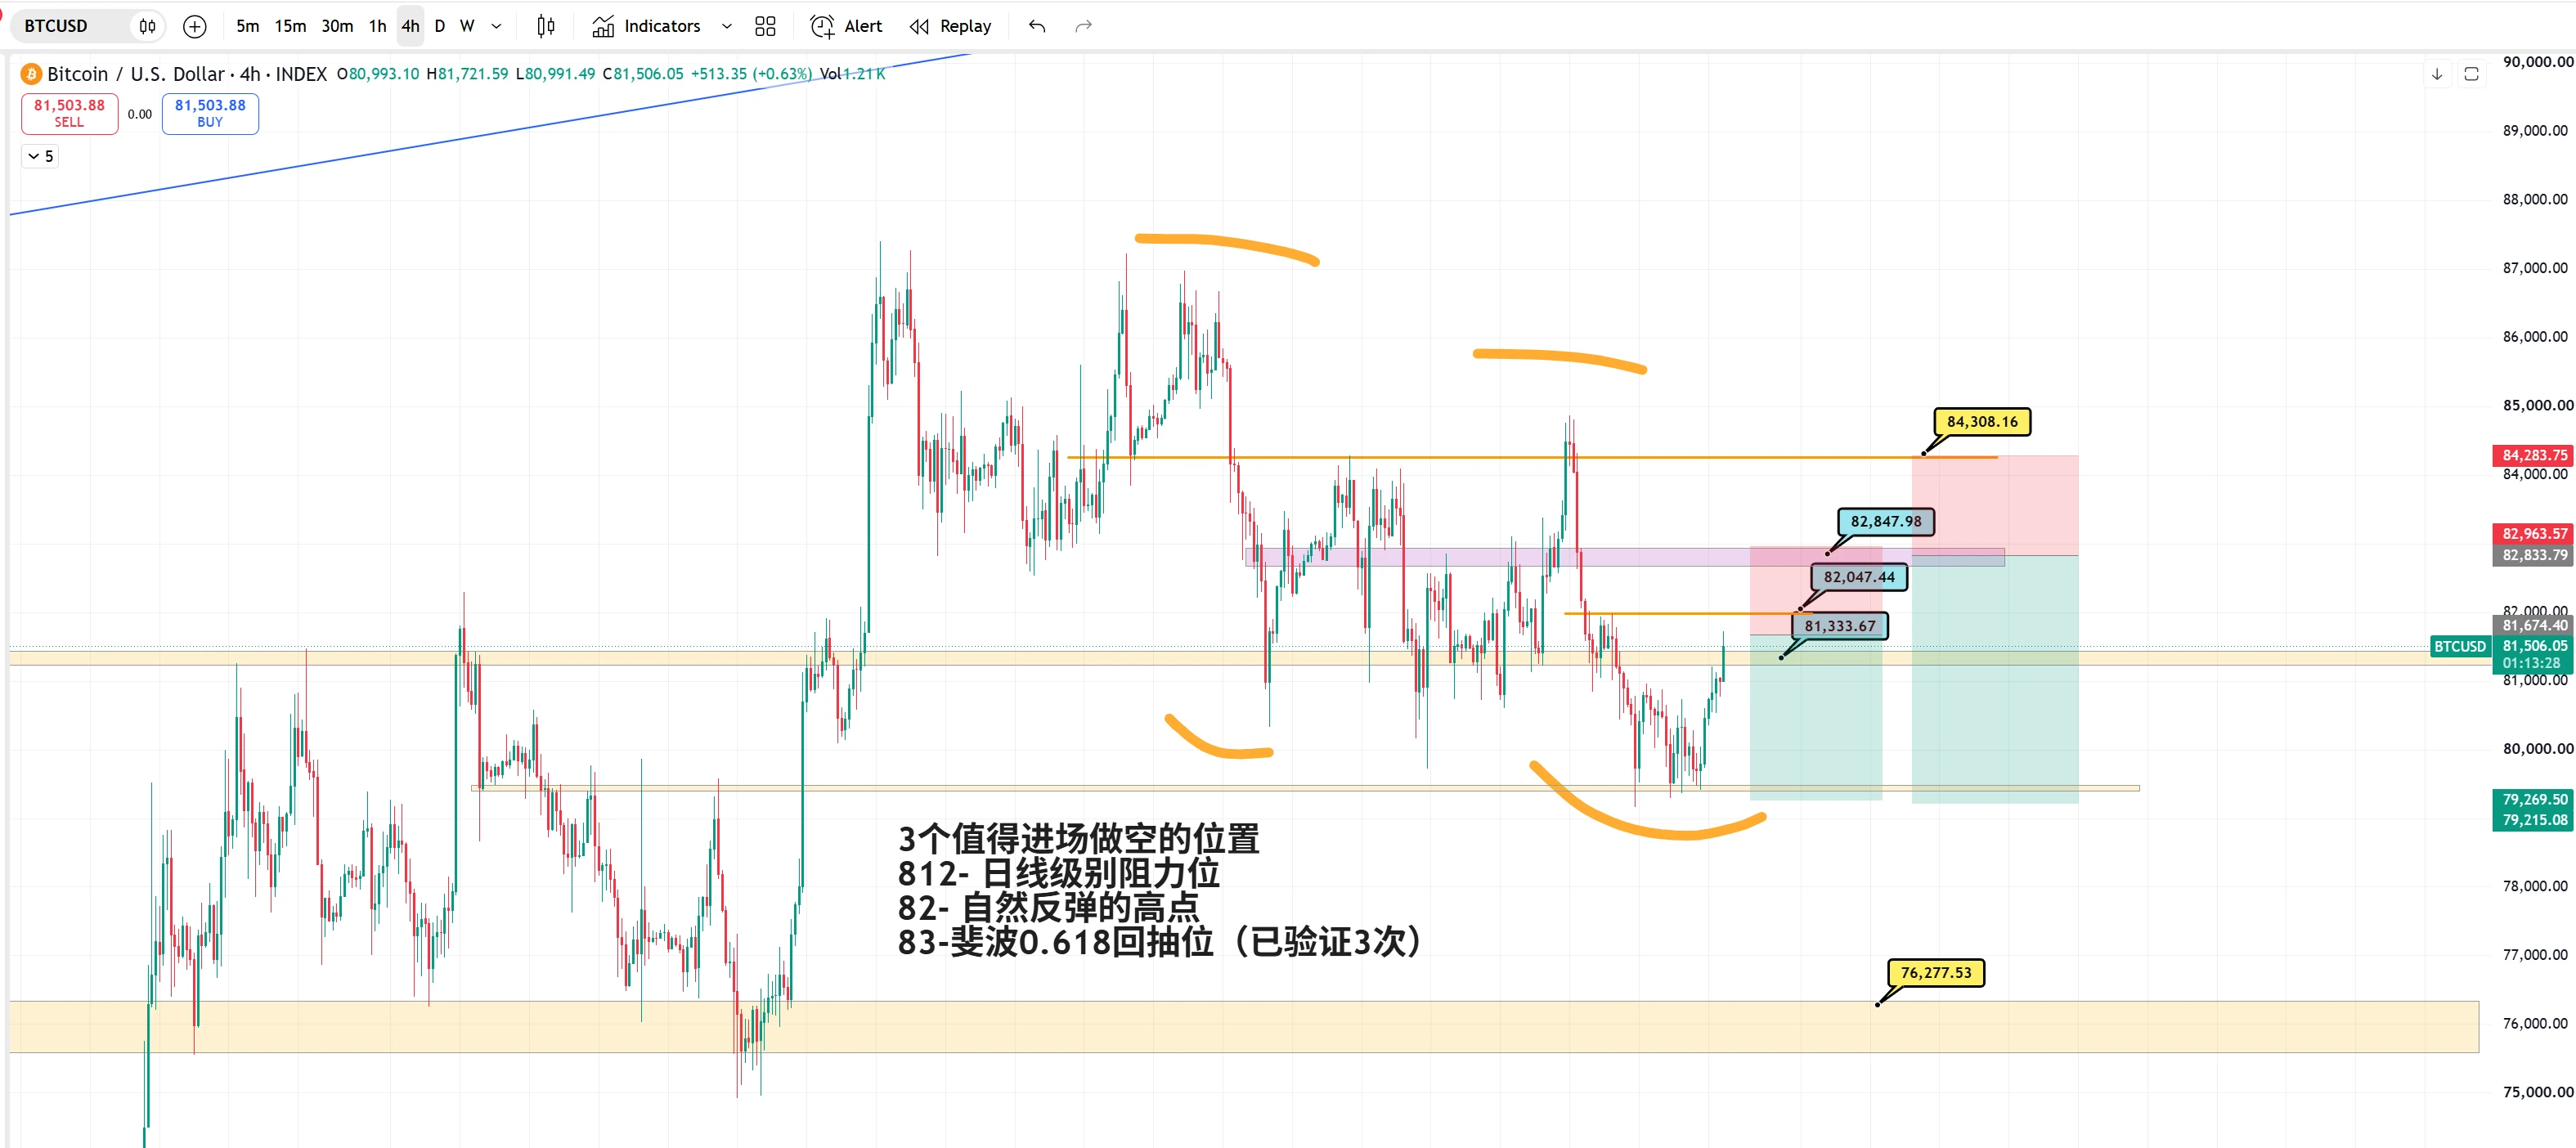
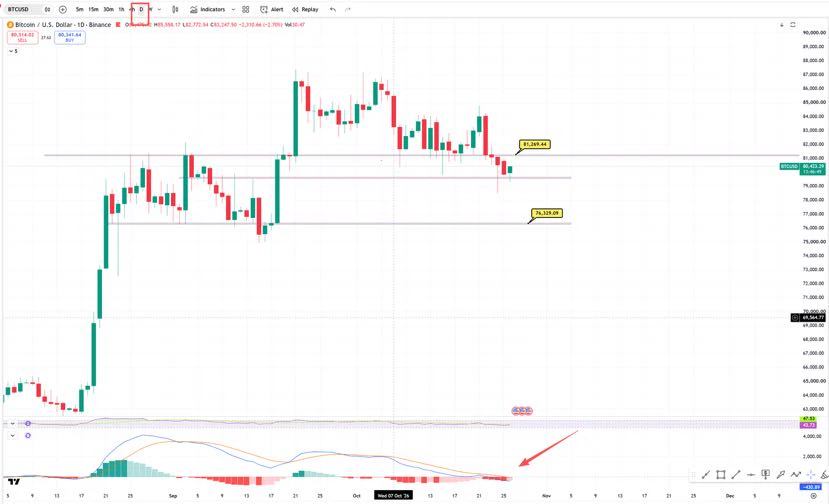
First, the conclusion: Don’t trade the bounce. Just wait for a move up to short.
Objective market structure
Chart 1. The daily chart has confirmed the breakdown. It’s the 812 zone, not an exact price! See the chart for details!! The turning point where the bearish structure ends is around 8.4.
Chart 2. 4-hour timeframe. There was a bounce around 7.9. Resistance above is at 8.1/8.21. A break below around 792 would still leave a vacuum zone.
Subjective view:
With a daily breakdown like this, unless a huge-volume candle reclaims the level, the view that this is not a bull-market reversal—which I’ve held for over a month—continues to apply. Price could head lower to 7.6 to retest support. The daily MACD is also now below the zero line, so continuing to short the bounce makes sense.
4-hour timeframe. The short-entry levels 1/2/3 shared over the past two weeks kicked off this decline after the sweep at 2. Last Friday’s break below 8.15 ended the 1-hour bullish structure and extended the 4-hour bearish structure. Although there was a bounce around 7.9, futures data suggest it was more likely shorts reducing positions than longs entering. Also, during the rebound from the decline that started at 8.7, the Fibonacci 0.618 level worked multiple times. The current 0.618 level is around 83.
Trading recommendations:
Considering the different timeframes above, go with the trend. I don’t recommend trading any bounce.
Short at 827-83; this is the optimal entry zone. Stop-loss at 8.4.
If the market continues to bounce on low volume today or tomorrow, you can also short near 815. That’s just around 8.3.
Of course, you can scale in at 815 and 83, with a stop-loss at 84. Just trade according to your own timeframe. Always use a stop-loss.
Streaming tonight~ Though I probably won’t get home until after 10. Come chat about the market then!~
$BTC #BTC争夺8万美元关口
repost-content-media
BTC-0.65%
  • 13
Crypto Market Updates on BTC/ETH
live-cover
LIVE2,914
Spot and futures: If you’re equally bullish on BTC, how do the profits differ?
If you’re bullish on BTC, you can buy spot or go long through futures, but the two types of trading work differently.
After buying spot, you hold the corresponding amount of coins. If the price rises, the value of your holdings increases; if it falls, their value decreases. Ordinary spot trading without borrowing or leverage won’t trigger a futures-style liquidation when prices fall, but you can still incur significant losses.
Futures trading exposes your position to price movements and usually involves margin and l
post-image
BTC-0.65%
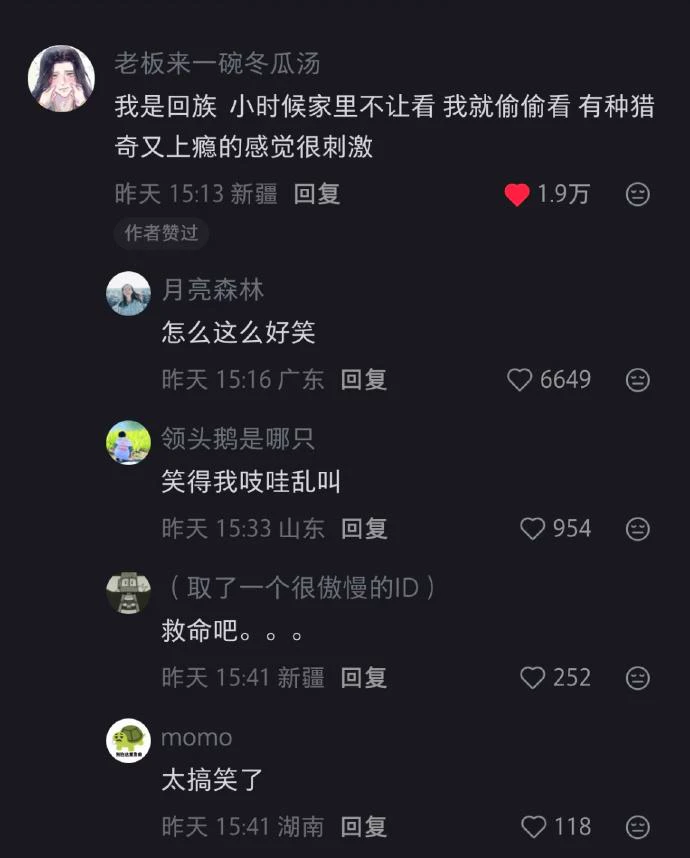
Do Hui people really not let their kids watch GG Bond? That’s way too strict, isn’t it?
post-image
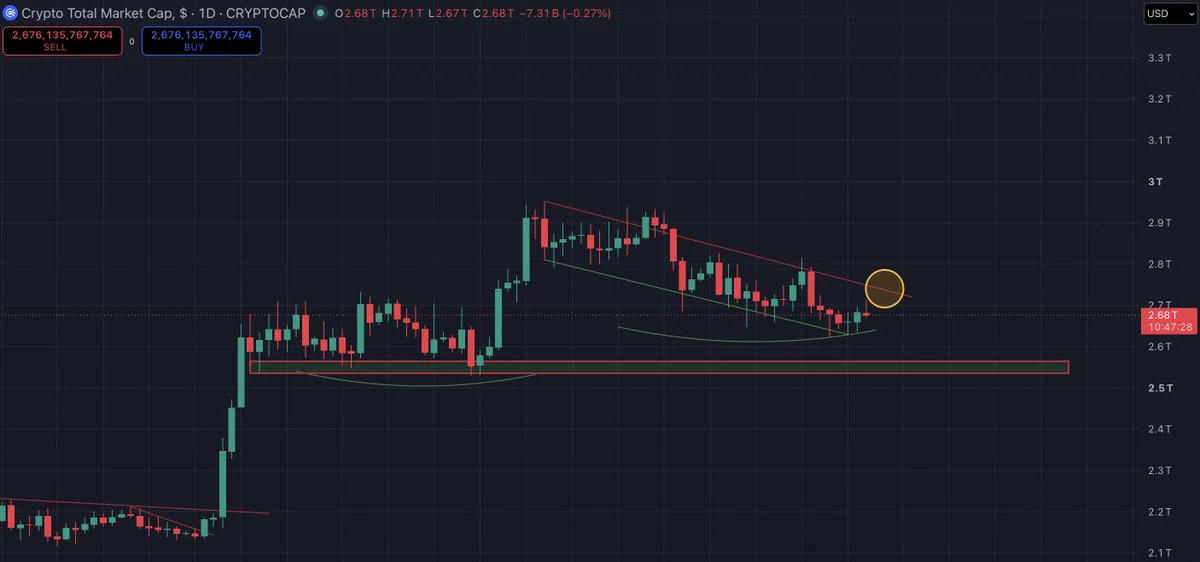
Gm ☕️
playbook might be the classic pre FOMC volatility, then upside after.
technically and sentiment wise, that dynamic makes sense heading into next week's midterms.
currently preparing a few long setups on the daily $ONDO $ENA $TAO $ETH $SOL
mainly still spot and chill, while watching the strength and follow through of the rh onchain reversal momentum
in my framework, there's no need to overtrade or size up yet.
#TOTAL (1D)
post-image
ONDO-0.29%
ENA+8.04%
TAO+0.41%
ETH-1.26%
SOL-0.77%
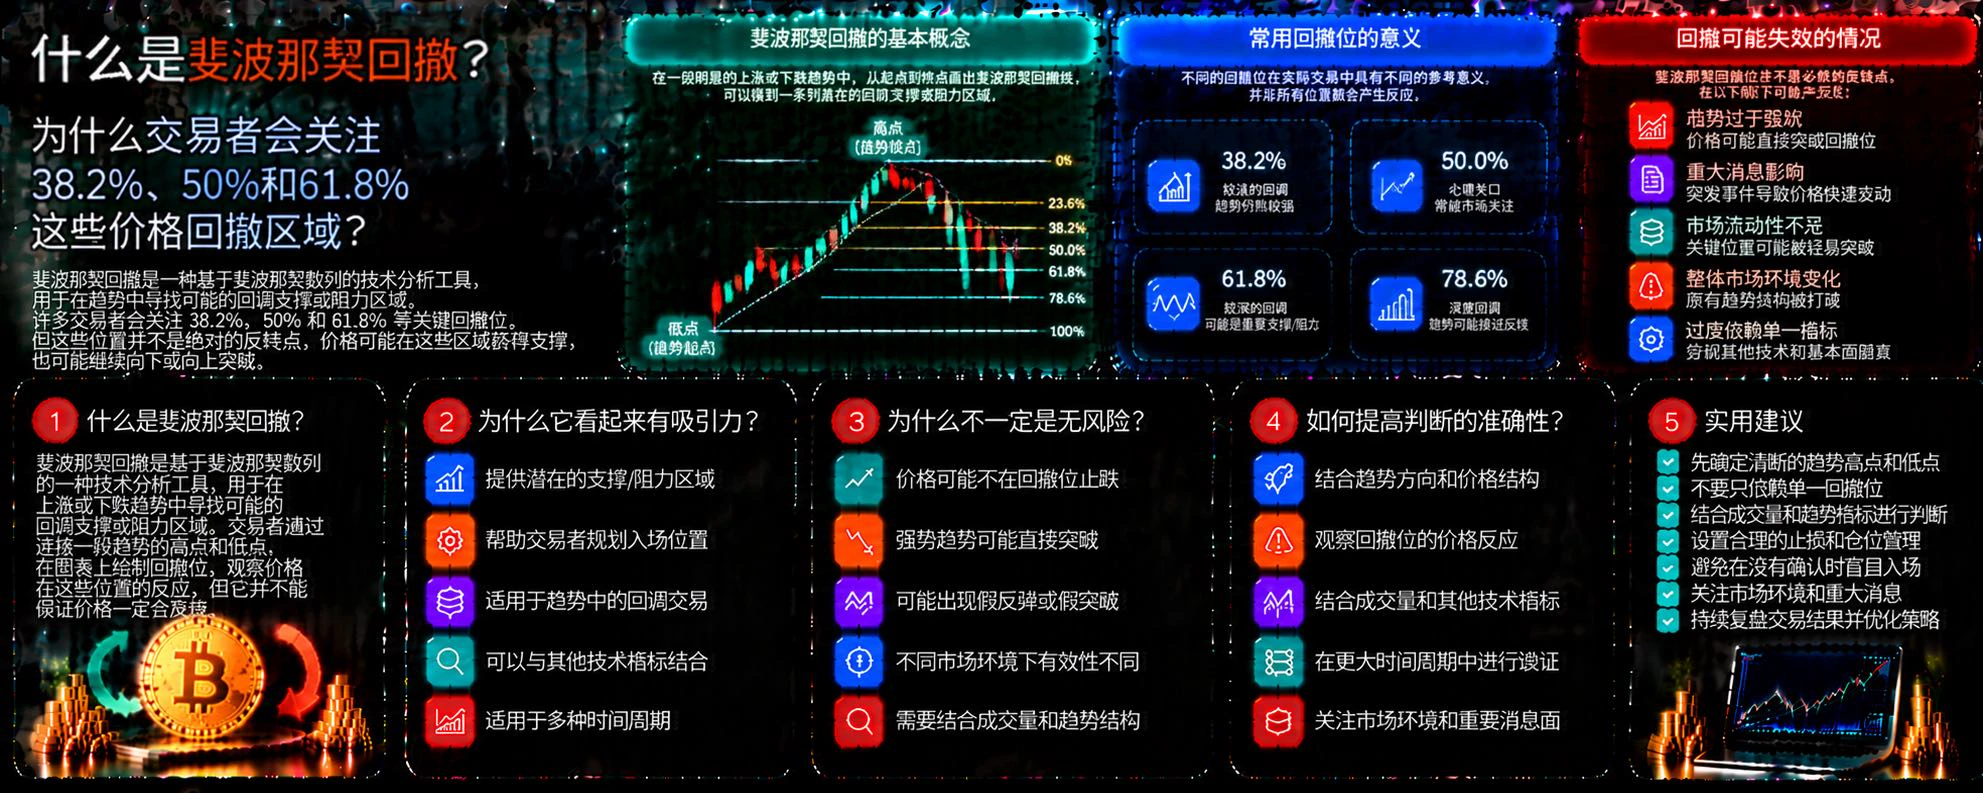
What Is a Fibonacci Retracement? Why Do Traders Pay Attention to the 38.2%, 50%, and 61.8% Price Retracement Zones?
In crypto trading, prices often pull back after rising, and may also rebound after falling. Fibonacci retracement is a common technical analysis tool that traders use to identify potential support and resistance zones based on specific ratios. But these ratios do not mark prices where a reversal is guaranteed, nor do they guarantee profitable trades.
First, what is a Fibonacci retracement?
It calculates different retracement ratios between the start and end of a significant price
post-image
Floki all time high hype ath go
post-image
FLOKI-0.82%
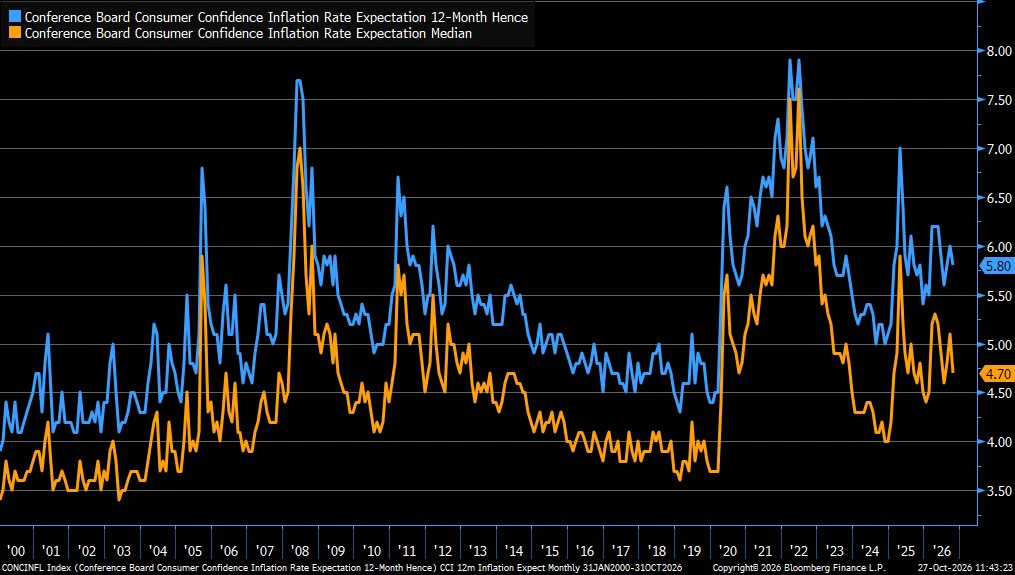
Consumers’ average and median inflation expectations for the year ahead eased in October but are still elevated at 5.8% and 4.7%, respectively
post-image
$INIT The project team is patching a vulnerability in a token that was hacked. It has already been flagged for a trading warning on Korean exchanges—do those damn Koreans just like piling into coins marked as dangerous?
post-image
INIT-2.53%
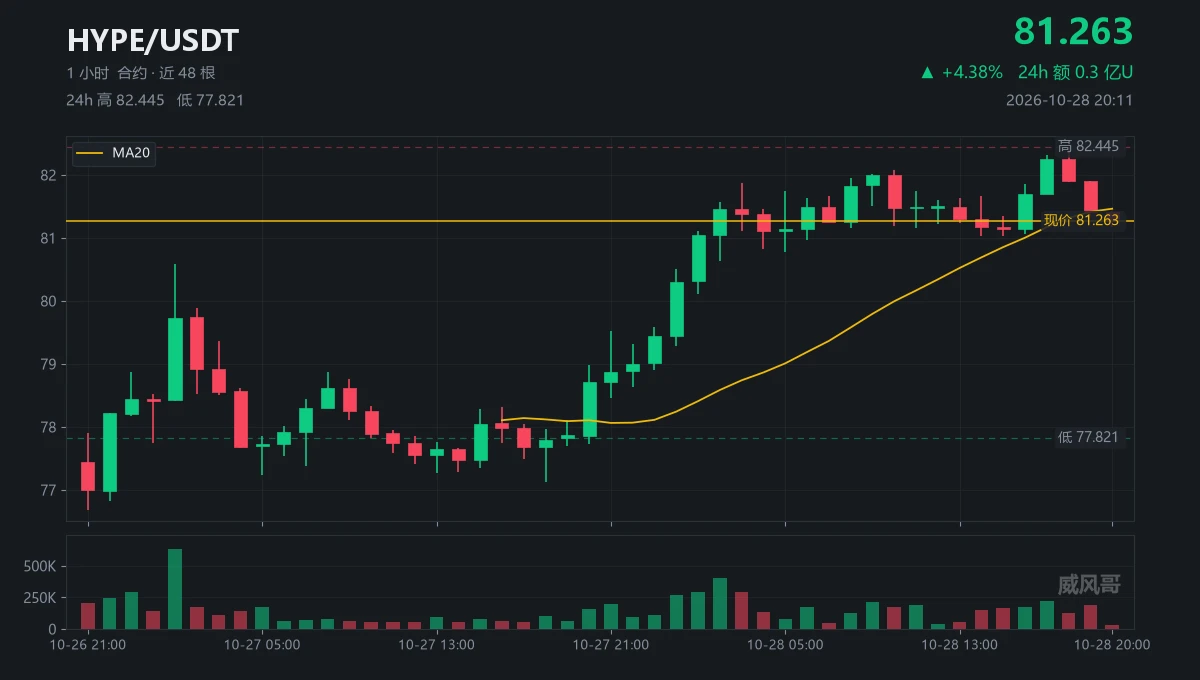
This stretch, I gave $HYPE a name: tiptoeing
Forty-five hours from 76.683 to 82.445, tiptoeing the whole way
Why call it tiptoeing? Look at the 18:00 candle
It made the new high, but volume was only 124777 contracts
The first twenty candles averaged 172380 contracts; this one reached just 72% of that
The 17:00 candle had 225049 contracts, and only then surged to 82.323
The candle that really did the work didn't make a new high; the one that made the new high didn't do the work
Now at 81.265, down 1.4% from the high
A tiptoeing stance was never going to hold for long
If 81.036 doesn't hold, th
post-image
HYPE+0.33%
AI is just changing everything around the world!!
The tech giant, Microsoft, is giving an offer to 60,000 employees to voluntarily leave their jobs!!
Microsoft has announced a new Voluntary Exit Offer (VEO) to around 60,000 employees across the US, UK, Canada, and India, covering roughly 27% of its global workforce.
Now, this doesnt mean that the company is forcing 60,000 employees out, rather it is giving them an offer to leave and they could also choose to stay.
The program is available to employees at level 70 and below in select teams, with participation depending on business needs.
Elig
post-image
MSFT-0.21%
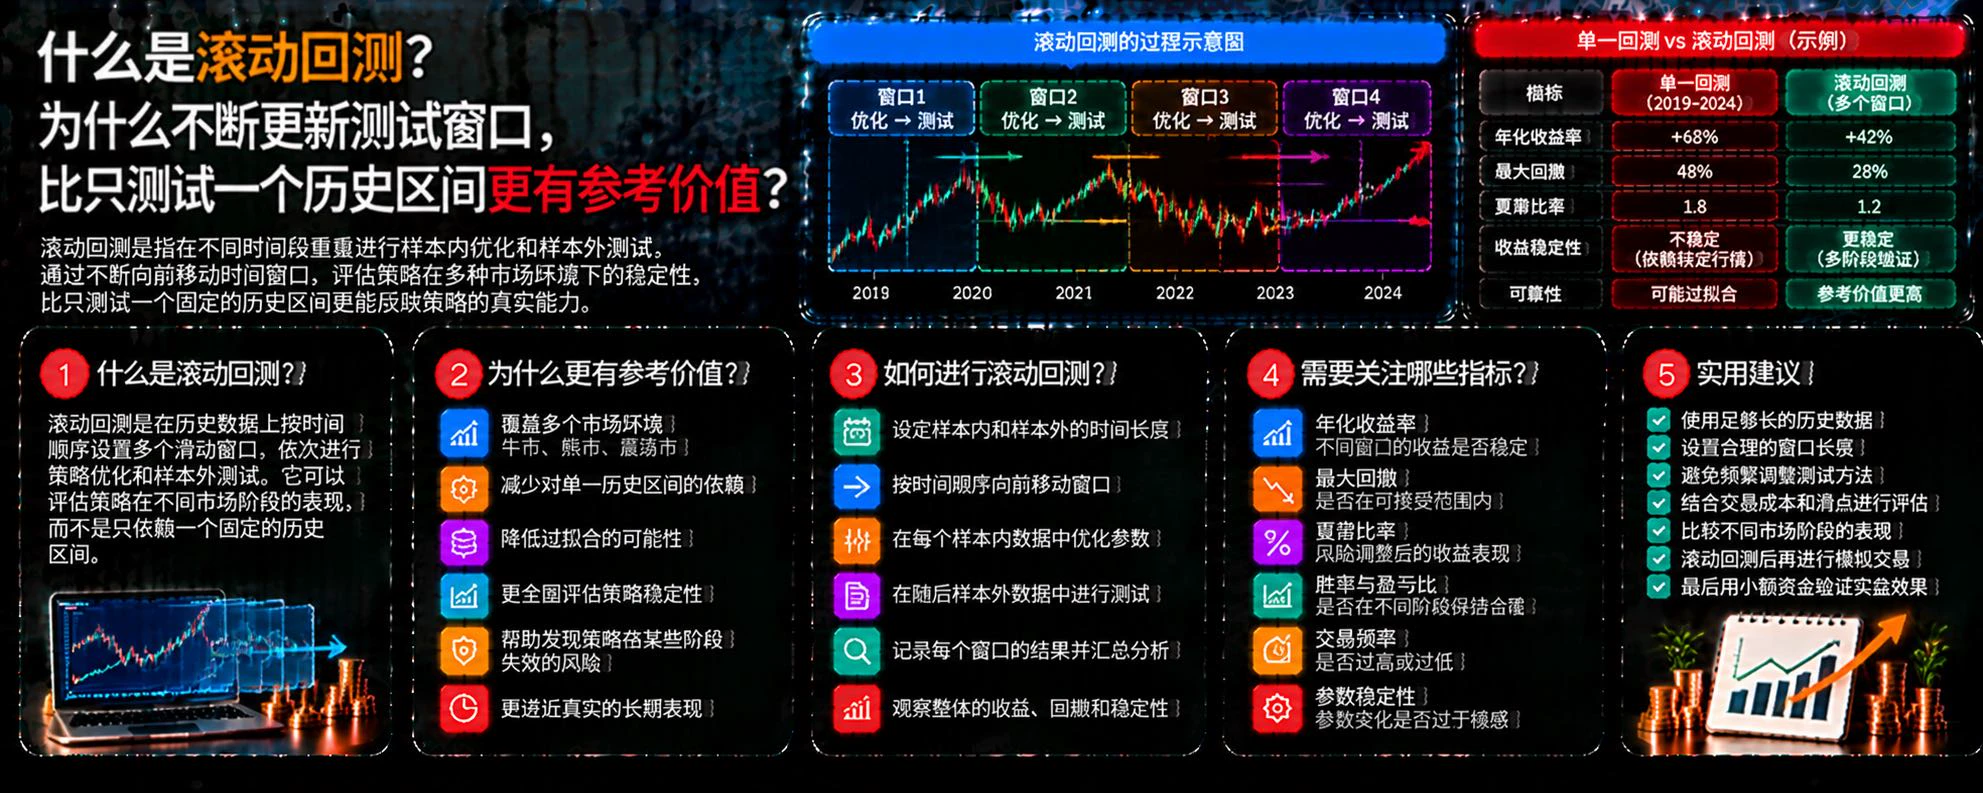
What Is Rolling Backtesting? Why Is Continuously Updating the Test Window More Informative Than Testing Just One Historical Period?
In cryptocurrency trading, a strategy may perform well only during a certain period of historical market conditions but fail to adapt to subsequent market changes. Testing just one fixed period can easily overlook how the strategy performs in different environments. Rolling backtesting helps traders assess a strategy’s stability more comprehensively by continuously updating the test window.
First, what is rolling backtesting?
Rolling backtesting divides historical
post-image
  • 2
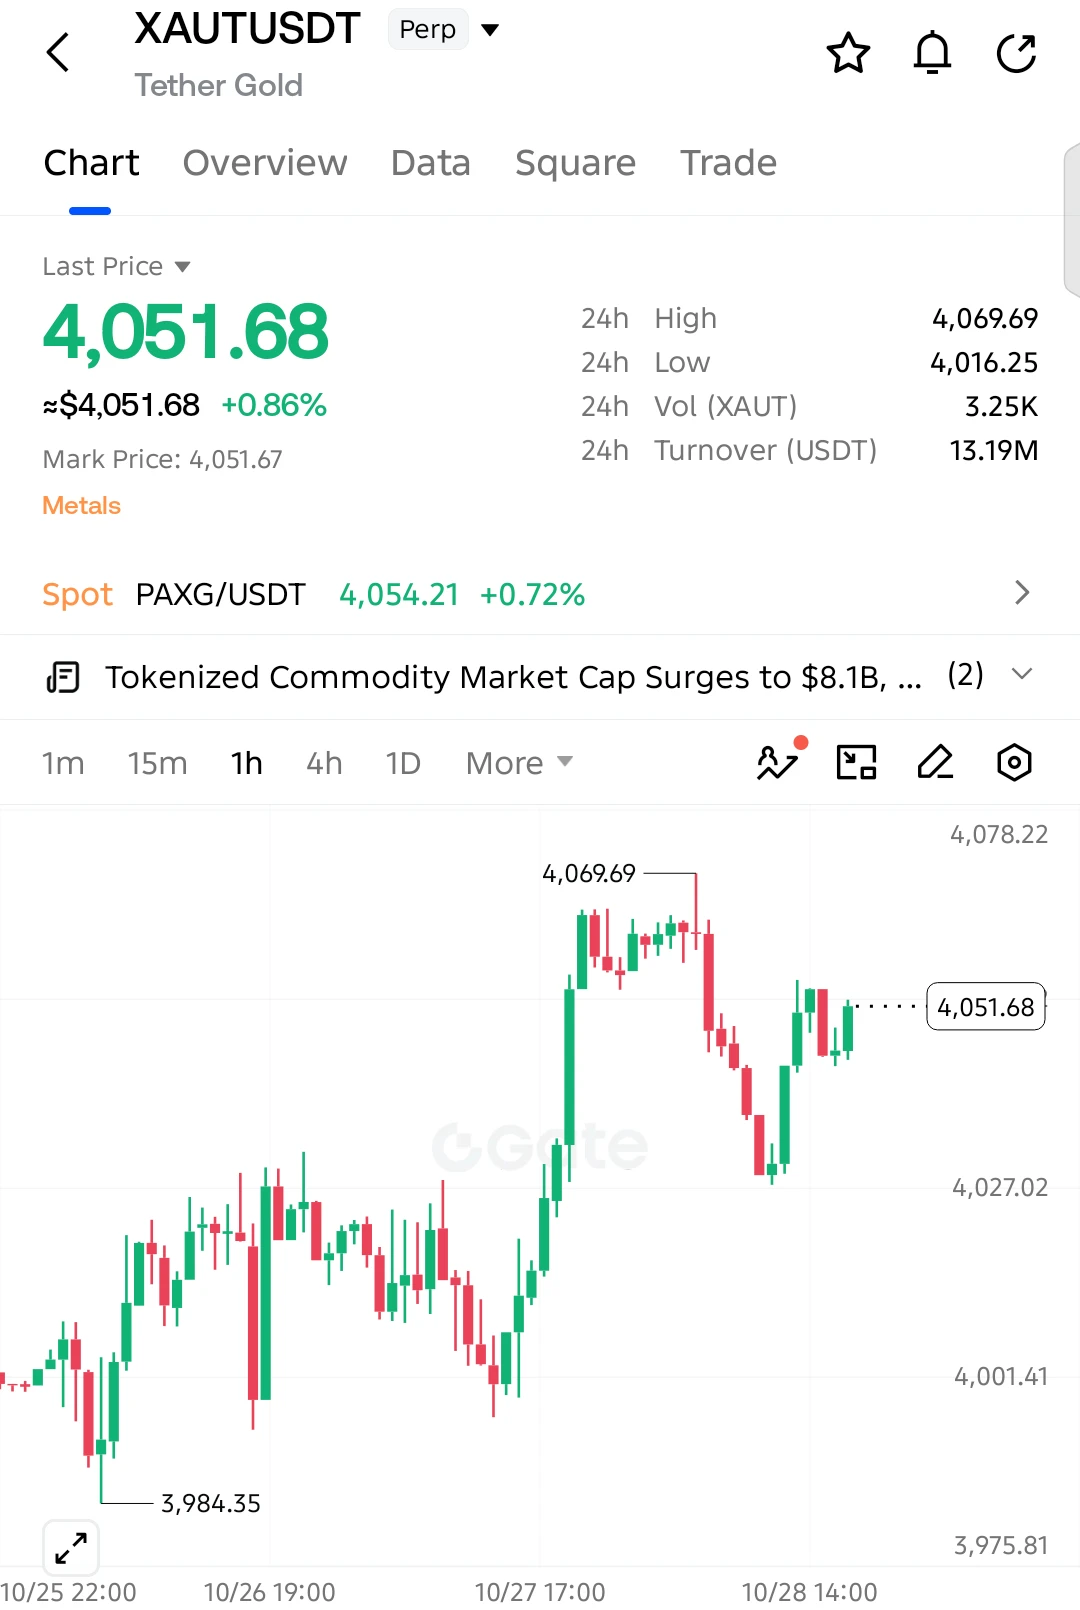
$XAUT LONG SETUP — CAN GOLD RECLAIM $4,070?
$XAUT is recovering strongly after bouncing from the $4,027 support area. Buyers have pushed the price back above $4,050, and the 1H chart suggests another attempt at the $4,069 resistance zone could be coming.
Entry: $4,055–$4,060 (after confirmation)
SL: $4,038
TP1: $4,070
TP2: $4,085
TP3: $4,100
Extended Target: $4,125
Holding above $4,027 keeps the recovery structure intact, while a rejection near $4,055–$4,070 could trigger another pullback.
Will gold break $4,070 or face another rejection?
post-image
XAUT+0.30%
  • 2
  • 1
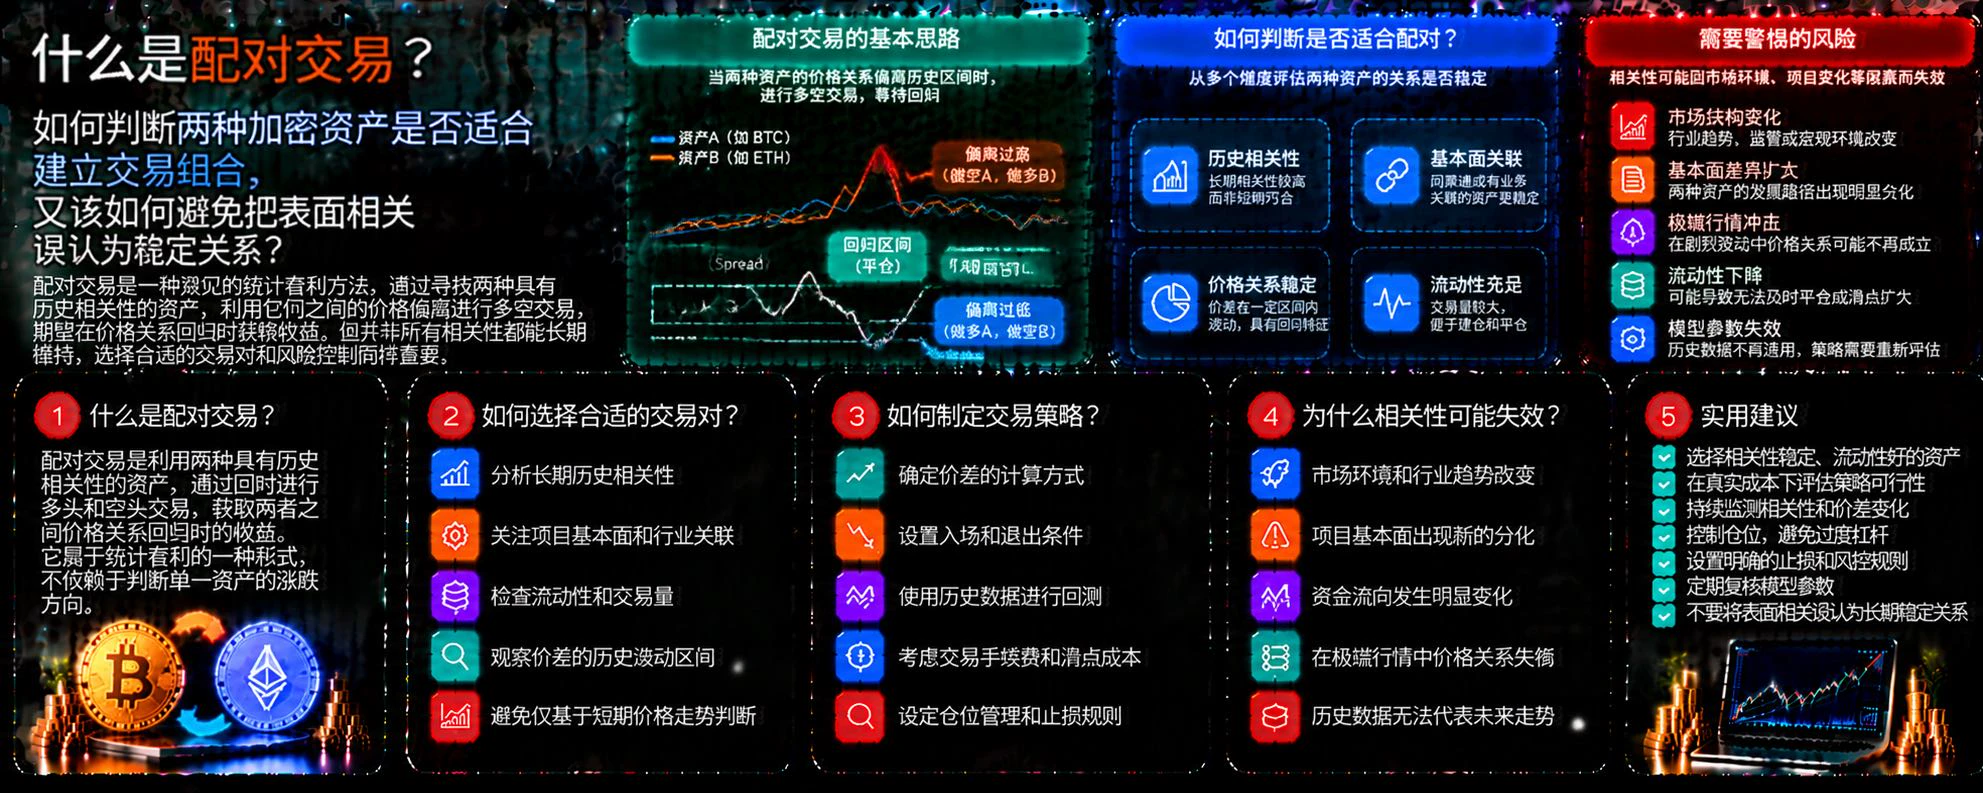
What is pairs trading? How do you determine whether two crypto assets are suitable for a trading pair, and how can you avoid mistaking superficial correlation for a stable relationship?
In cryptocurrency markets, some assets often rise and fall together, but that does not mean they always maintain a stable price relationship. Pairs trading seeks to identify opportunities from relative price deviations between two assets by opening long and short positions simultaneously, reducing dependence on the overall market direction.
First, what is pairs trading?
Pairs trading is a common statistical arb
post-image
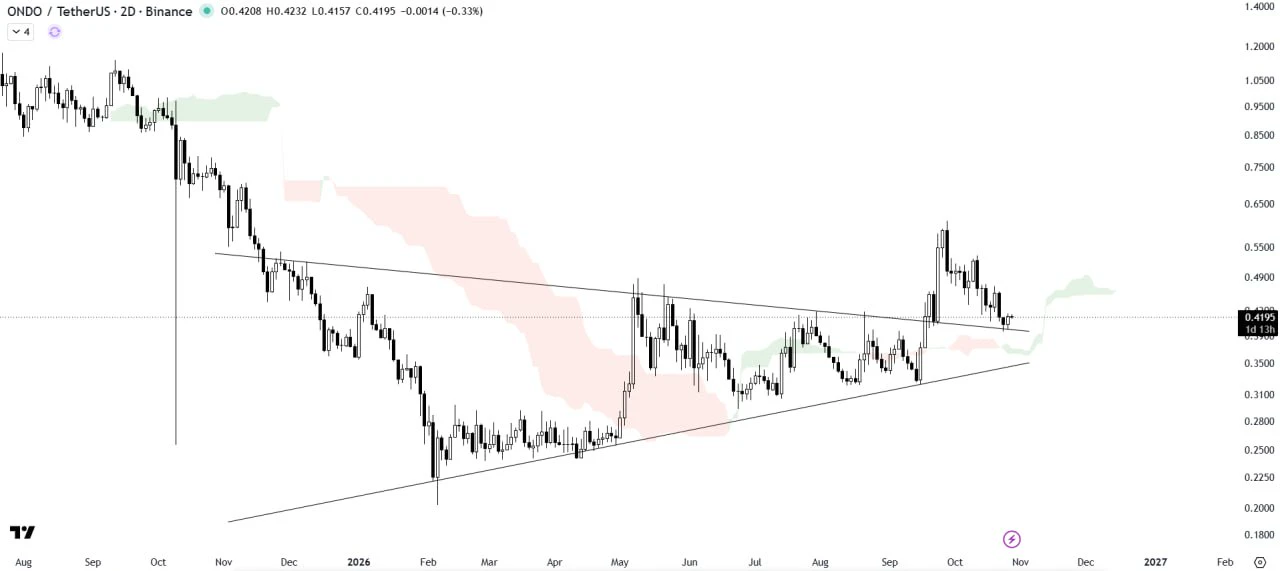
$ONDO /USDT — THE NEXT MOVE MATTERS
ONDO has broken above its symmetrical triangle and retested the breakout zone successfully.
The Ichimoku Cloud adds support to the bullish setup. Holding this structure could trigger another strong move higher, while losing support would weaken the setup.
Confirmation over speculation.
#FedDecisionCountdown #GateFirstToLaunchGoldCFD7X23Trading #SKHynixQ3RevenueHitsRecordHigh #MicrosoftGoogleEarnings
post-image
ONDO-0.29%
[Urgent Risk Alert] Datavault AI, listed on Nasdaq, saw its stock price nearly halved in a single day, plunging close to 50%. The trigger was a massive amount of locked-up crypto assets: since June 2026, the $150 million $BTC it holds on the Biconomy platform has been unwithdrawable, leaving its liquidity channel completely jammed.
The background behind this $BTC merits a closer look — in September 2025, Datavault AI and Scilex Holding reached an equity swap agreement, under which Scilex paid for the shares in BTC, transferred off-chain to a Biconomy account. Withdrawals are now blocked, and
post-image
BTC-0.67%
ET-0.70%
🎃【Halloween】Even before the Fed policy announcement, AI-related stocks began to rally!
live-cover
LIVE2,573
Load More

Join 40 M users in our growing community

⚡️ Join 40 M users in the crypto craze discussion

💬 Engage with your favorite top creators

👍 See what interests you

Trending Topics

FedDecisionCountdown

30.59k Views1.25k Discussing

The Fed will announce its rate decision on October 28 at 18:00 (UTC), followed by a press conference at 18:30 (UTC). Markets widely expect rates to remain unchanged, with attention turning to future policy signals. Could this decision break crypto out of its trading range? What signals are you watching?

GateFirstToLaunchGoldCFD7X23Trading

49.04k Views6.4k Discussing

SKHynixQ3RevenueHitsRecordHigh

5.99k Views2.65k Discussing

View More