






Square
Following
Hot
News
Notifications
Profile
Share your thoughts
placeholder
Article
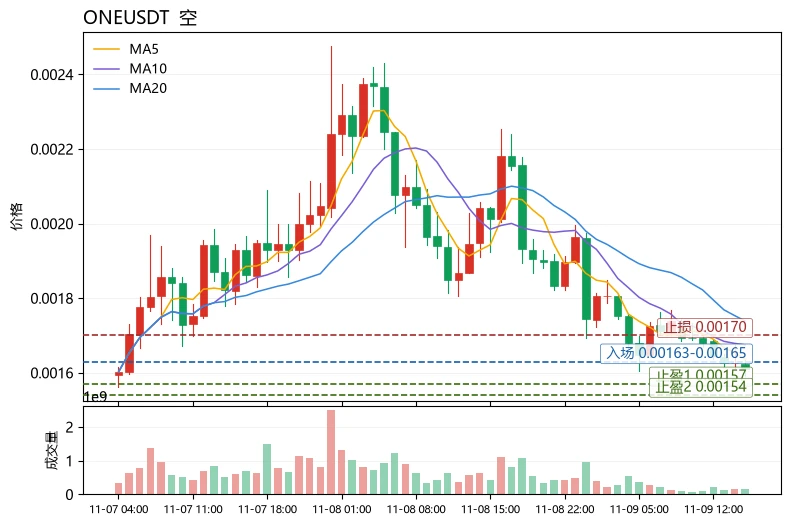
$ONE It has fallen so much—can we buy the dip? The technical answer is: not yet. This is just an oversold bounce within a bearish trend, not a reversal.
$ONE Current price: 0.00161, down 17.98% in 24h. The moving-average structure is a textbook bearish alignment: MA5=0.0016372 is above the price and well below MA20=0.00173885. The medium-term moving averages continue to slope downward, so any rebound must first clear MA5. The MACD histogram=-8.771e-06 remains negative, and bearish momentum has not faded. RSI=36.3 is approaching the weak zone but has not yet reached the oversold extreme below
post-image
ONE-1.19%
BMT+5.93%
Ethereum’s rebound is much weaker than Bitcoin’s, and no bottoming pattern has appeared on the daily chart#美国10月CPI即将公布
ETH-1.26%
BTC-0.67%
  • 1
Trenches
牛逼
牛
bade
b
牛逼
0x96...7777
Market Cap
$.
Change
.
24h Vol
$.
Holders
.
ZIG
Z
bade
b
ZIG
0x8c...1145
Market Cap
$.
Change
.
24h Vol
$.
Holders
.
BTC
B
bade
b
BTC
C5xp...pump
Market Cap
$.
Change
.
24h Vol
$.
Holders
.
STONK
S
bade
b
STONK
6GmA...UNgx
Market Cap
$.
Change
.
24h Vol
$.
Holders
.
ANSEM
A
bade
b
ANSEM
9cRC...pump
Market Cap
$.
Change
.
24h Vol
$.
Holders
.
What Is the Sortino Ratio? Why Can Focusing Only on Volatility Misjudge a Trading Strategy?

In cryptocurrency trading, two strategies with similar returns can offer very different risk experiences. One strategy may often suffer sharp declines, while another may mostly see upward fluctuations. Measuring risk only with standard volatility can overlook this difference. The Sortino Ratio is a metric that can help provide a more complete analysis.

First, what is the Sortino Ratio?

The Sortino Ratio measures returns above a target return relative to downside risk. It is similar to the Sharpe Rati
post-image
Congrats to everyone who got on board with this ETH short!
ETH has smoothly hit our first target of 2,100. We’ll keep shorting intraday, and the overall momentum remains smooth.
Shorting just feels right! You wouldn’t understand the joy of being a seasoned bear.
The bears have been eating well lately. Brother Ye said he’d help everyone seize the opportunities, and he always keeps his word.
Keep watching and stick to the plan. Let’s try to capture the rest of the move! $ETH #ETH
ETH-1.26%
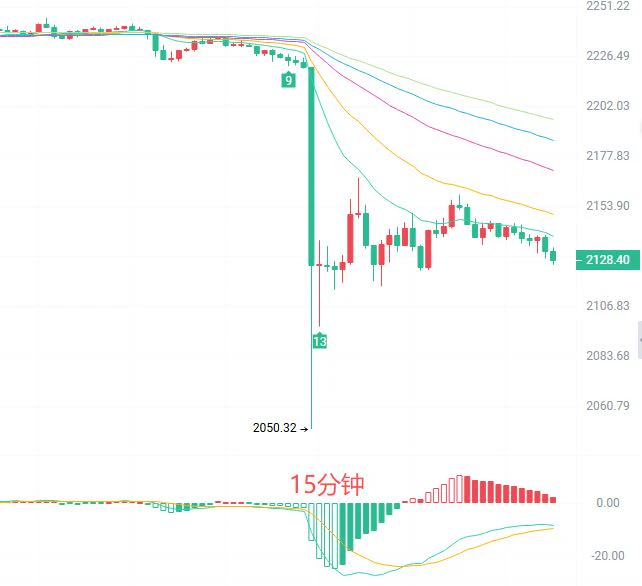
Guys! ETH has crashed again!
It plunged straight from 2235 to 2100, and is catching its breath at 2127 now. Yesterday we were still saying 2166 would hold, but today one big bearish candle broke through. How many people bought the dip at 2170 and got buried?

In plain English:
On the 2-hour chart, all five moving averages are overhead; the bearish alignment is intact
MACD green bars have expanded to -20.52. Bears are still accelerating; this isn't a decline that's running out of steam
BOLL is opening downward, with the lower band at 2119 and price hugging the edge of the band
The 15-minute cha
post-image
ETH-1.23%
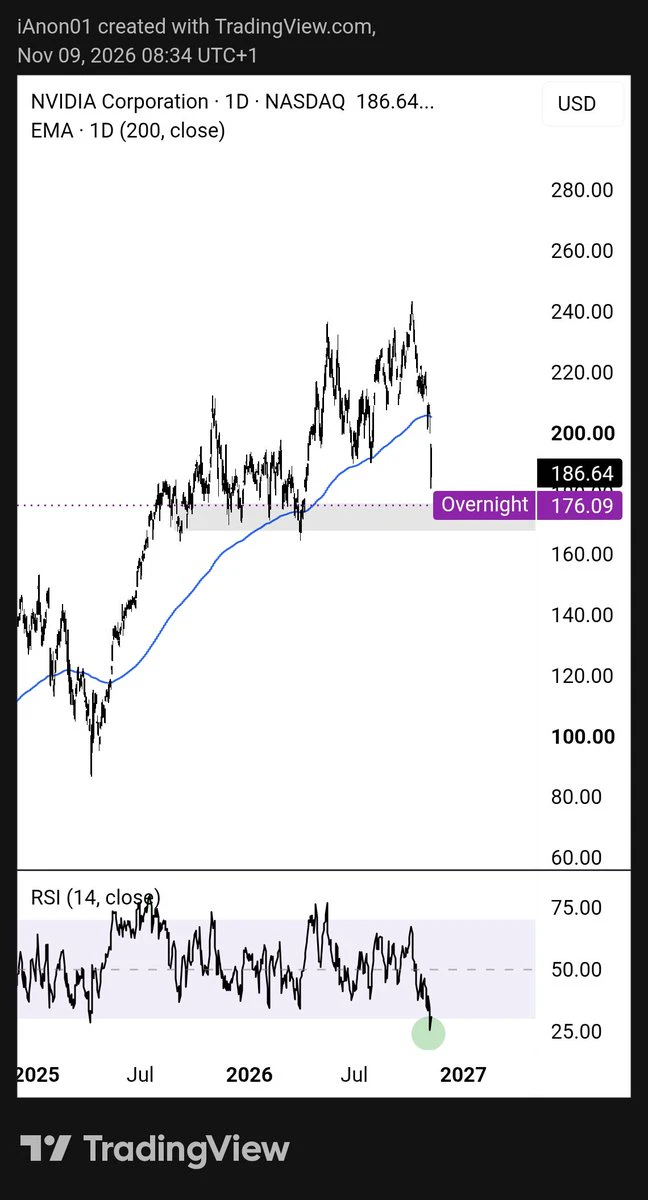
$NVDA
Jensen being punished for having an affair with a chinese spy.
We are being blessed with cheap equity. If price hits 176, forward P/E is 12-15😅.
post-image
NVDA+2.80%
November 11, 2026
post-image
Your crypto wallet is your gateway to interacting with blockchain networks.
But here's something important: owning a wallet also means taking responsibility for its security.
Protect your recovery phrase.
Never share your private keys.
Verify websites before connecting.
Be careful with suspicious links.
Security should never be an afterthought.
#CryptoSecurity #Blockchain #Web3Safety
post-image
The dip buyers are all on board now, right? BTC has 1,300 points of room to run. Take profits in batches, and keep the core position aimed around 738-735.
#USCPIDataIncoming
#美国10月CPI即将公布 #每周来晒
: Why the Upcoming US Inflation Report Could Shape the Future of Crypto Markets
The financial world is closely watching the upcoming US Consumer Price Index (CPI) report, as this important economic indicator could have a significant impact on global financial markets, investor sentiment, and cryptocurrency prices. Inflation remains one of the most important factors influencing the Federal Reserve's monetary policy, making the upcoming CPI data particularly important for traders and long-term investors.

The Consumer Price Index measures changes in the p
🔥【Nvidia Earnings Preview】Stock Under Pressure: How Long Can the AI Computing Power Boom Last?

📌 Tonight at 20:00 (UTC+8), join us on Gate Live for a discussion:
• Nvidia’s board launches an investigation: What is the market most concerned about now?
• How long can the AI computing power boom last? How long will it take tech giants to recoup their investments in data centers?
• If earnings exceed expectations, can tech stocks and BTC rebound too?

🎁 Two rounds of giveaways await
100 USDT position experience vouchers ×3 | Gate soccer balls ×3

🎙️ Special guests: [@加密大司马](gt://mention/g1j2S
post-image
NVDA+2.80%
BTC-0.67%
  • 3
TODAY LIVE TECNICAL WITH SIGNALS
live-cover
LIVE1,936
#GateRanksThirdIn24HNetInflows
Gate posted about $40.66 million in net inflows over 24 hours, third among centralized exchanges. The easy headline is that money is flowing in because of confidence. I’d rather test that claim than repeat it.

What the number is

It is one 24 hour snapshot from a public tracker that estimates flows using the wallets an exchange has disclosed. That makes it an estimate, and a single day can be distorted by wallet moves or price changes. Useful, but not a precise measure of user confidence.

The ranking keeps changing

Recent snapshots for Gate that I found: abou
post-image
GateSquare
💰 The market continues to fluctuate, while Gate's 24-hour net inflows rank among the top three globally

According to DefiLlama data, Gate recorded net inflows of about $40.66 million over the past 24 hours, ranking third among centralized exchanges worldwide. 🏆

Amid market volatility, fund flows have once again become a focus of attention.

Some believe inflows reflect trading demand and market confidence; others think short-term inflows may simply result from portfolio adjustments, margin top-ups, or waiting for the next trading opportunity.

Inflows are a positive signal, but more data is needed to determine whether they can translate into sustained buying pressure.

💬 What do you think will be more important to watch next: spot trading volume, sustained fund inflows, or BTC's price performance?

Join #Gate24小时净流入全球第三 on Gate Square to share your market observations, trading strategies, or ideas on fund allocation.

📖 Odaily reports:
https://www.odaily.news/zh-CN/newsflash/532275

repost-content-media
BTC-0.67%
  • 3
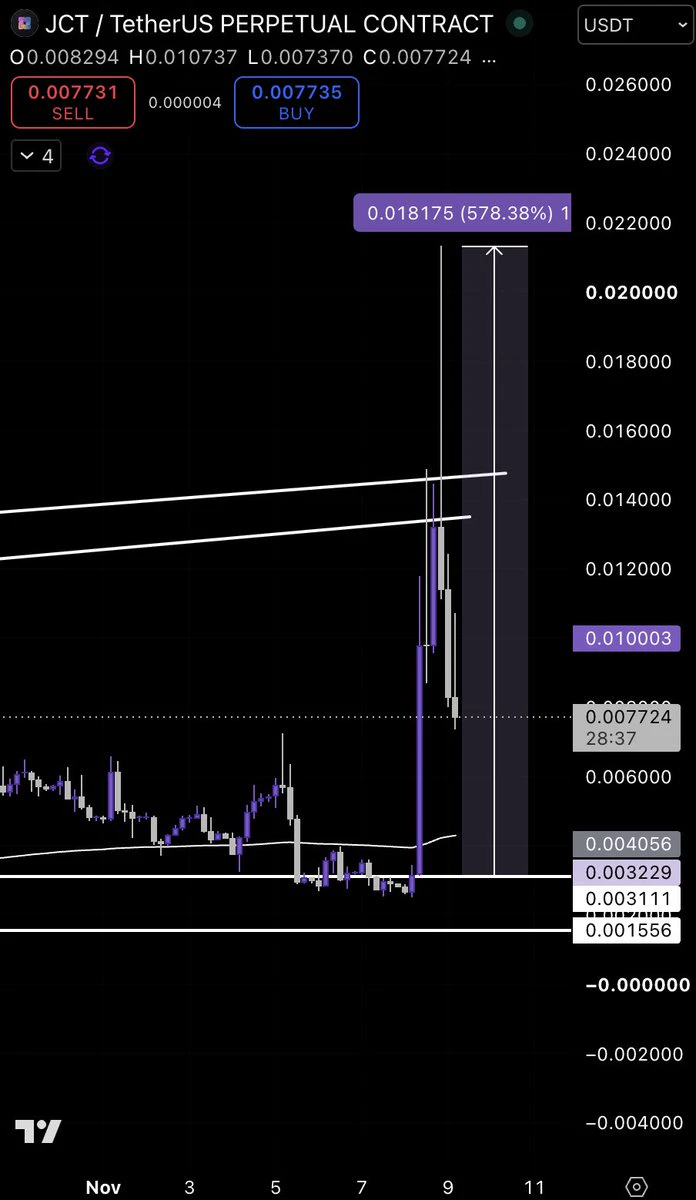
ethereum:0xc477b6dfd26ec2460b3b92de18837fd476ea7549 finally hit the area we were waiting for! 🎯
Price reached our $0.0031–0.0032 accumulation zone before the explosive move.
Now trading around $0.0077, with the next major resistance around $0.0135–0.0147.
Patience pays. We had the levels mapped out before the move. 🟢
post-image
#Ahr999EntersBottomBuyingZone Ahr999 Enters Bottom Buying Zone: Is Bitcoin Approaching a Major Accumulation Opportunity?

The Bitcoin market is attracting attention as the Ahr999 indicator enters what is commonly known as the bottom buying zone. This development is important for long-term investors because the indicator is designed to help evaluate whether Bitcoin is trading at relatively attractive levels compared with its historical growth trends.

The Ahr999 indicator is a popular Bitcoin valuation tool used by some long-term investors to understand market conditions. It combines Bitcoin's
BTC-0.67%
How many days has it been since I last posted an update to talk big? Let me talk big again today: a brand-new strategic dividend-sharing partnership model. Let’s have fun making money together, guys
I'm dying laughing
The most spot-on image from the Jensen Huang discussion
post-image
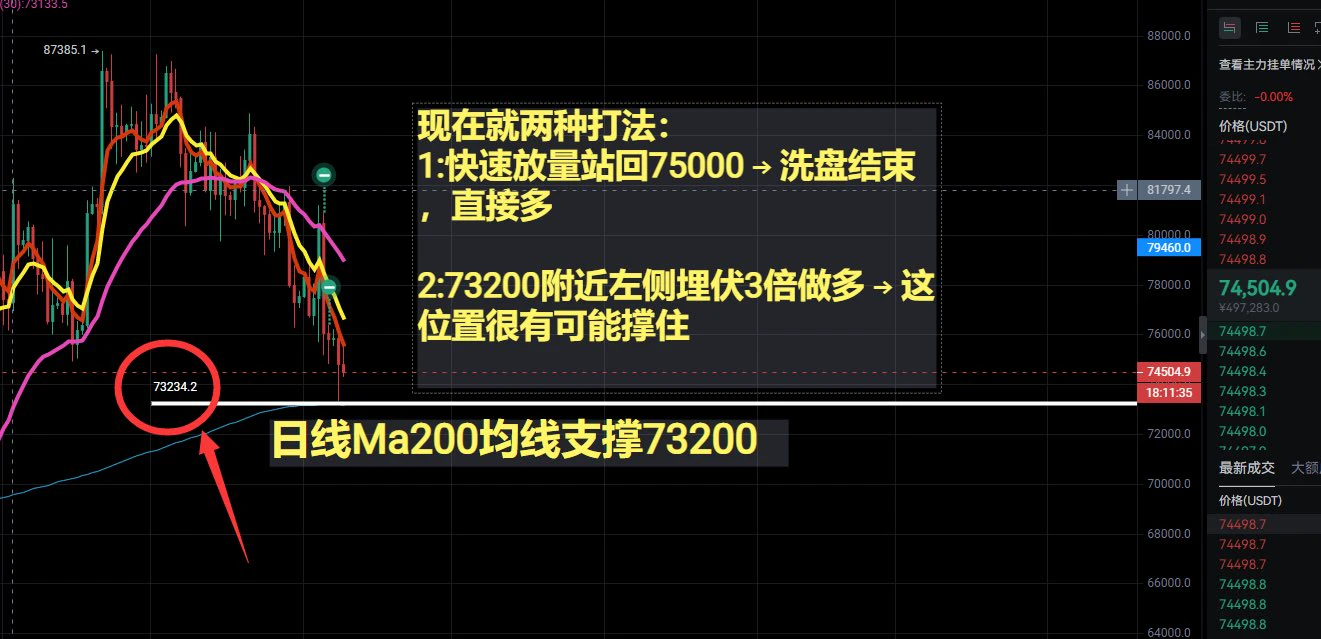
📊 Crypto Daily | Nov 9 Morning: $850 million wiped out overnight! BTC crashes below 74,000 to a new low since August, 140,000 liquidated—three tankers catch fire in Hormuz, and PoR is due today with no sign of it!

Guys, this weekend’s hit was harsher than expected: BTC plunged below 74,000 on Sunday night, hitting a low of 73,708 (a new low since August), and is now at 74,274, down nearly 2%. The 75,000 level is completely lost. This wasn’t just a leveraged long squeeze—three tankers exploded and caught fire in the Strait of Hormuz in a single day, and Qeshm Island was attacked by US forces.
post-image
BTC-0.65%
GLDX-0.40%
PAXG+0.37%
CME-0.40%
Bitcoin continues to slide, leaving the market gripped by panic, but on-chain data shows an unusual divergence: long-term holders are beginning to loosen their grip, while short-term holders remain relatively calm.

Data from November 5 showed that realized losses transferred to exchanges by long-term holders (LTHs) reached $139 million, enough to indicate that some long-time holders can no longer withstand the current market pressure. But short-term holders (STHs) have not seen a comparable wave of panic selling. After substantial turnover in the preceding period, the cost basis of short-term
post-image
BTC-0.65%
BTC UPDATES
live-cover
LIVE1,809
Load More

Join 40 M users in our growing community

⚡️ Join 40 M users in the crypto craze discussion

💬 Engage with your favorite top creators

👍 See what interests you

Trending Topics

USCPIDataIncoming

28.2k Views1.84k Discussing

The U.S. October CPI report will be released on November 10 at 8:30 a.m. ET. September CPI came in at 3.7% year over year, and markets will be watching closely for signs that inflation is cooling, especially in core CPI. A softer-than-expected reading could strengthen rate-cut expectations, while hotter inflation may pressure risk assets through higher Treasury yields and a stronger dollar. How do you think this CPI print will move $BTC, U.S. stocks and gold?

RedBullDoublePodiumInBrazil

1.76k Views30.52k Discussing

BTCFlashCrash

72.71k Views66.22k Discussing

View More