Square
Following
Hot
News
Notifications
Profile
Share your thoughts
placeholder
Article
$NBIS is expected to post $907M in revenue this quarter while it posted only $582.3M revenue previous quarter.
Thats a 55% jump expected in one single quarter. I think with the way the stock is performing, there is every single chance that it misses that estimate and by quite some margin and Stock plunges to $100 or lower.
My 2c.
post-image
NBIS+7.73%
🚀 JCT/USDT Perpetual Market Breakdown: Massive Momentum Surge!

The market is witnessing an extraordinary price action update on JCT/USDT, capturing massive attention across Gate.io Square with an explosive breakout. Here is a comprehensive technical and data-driven analysis of the current market dynamics:

📊 Key Market Statistics
Last Price: ~$0.011059

24h Change: +284.93% surge

24h High: $0.014795

24h Low: $0.002514

24h Volume (JCT): 10.32B

24h Turnover (USDT): $114.18M

📈 Technical Analysis & Price Action
Parabolic Breakout: JCT has broken out significantly from it
JCT-3.26%
Trenches
ZIG
Z
bade
b
ZIG
0x8c...1145
Market Cap
$.
Change
.
24h Vol
$.
Holders
.
STONK
S
bade
b
STONK
6GmA...UNgx
Market Cap
$.
Change
.
24h Vol
$.
Holders
.
CLAUDIA
C
bade
b
CLAUDIA
2j5S...W2ZM
Market Cap
$.
Change
.
24h Vol
$.
Holders
BTC
B
bade
b
BTC
C5xp...pump
Market Cap
$.
Change
.
24h Vol
$.
Holders
.
FLOAT
F
bade
b
FLOAT
Bv1a...BMmr
Market Cap
$.
Change
.
24h Vol
$.
Holders
.
The Modern Person’s Wealth-Disappearing Act: There’s a Financial Trap for Everyone

As long as you have a little spare cash and the idea of “investing” crosses your mind, you’ve already entered this battlefield of “genius traders.”
As one blogger summed up the perfect cycle: Those who didn’t buy silver bought gold; those who didn’t buy gold bought stocks; those who didn’t buy stocks bought funds; those who didn’t buy funds bought futures. And even those who thought they were the smartest and bought cars and houses are quietly bearing the brunt of it all.
Think that’s the end of it? A commenter
BTC-0.65%
Asia buys, buys, buys, Europe and the U.S. sell, sell, sell
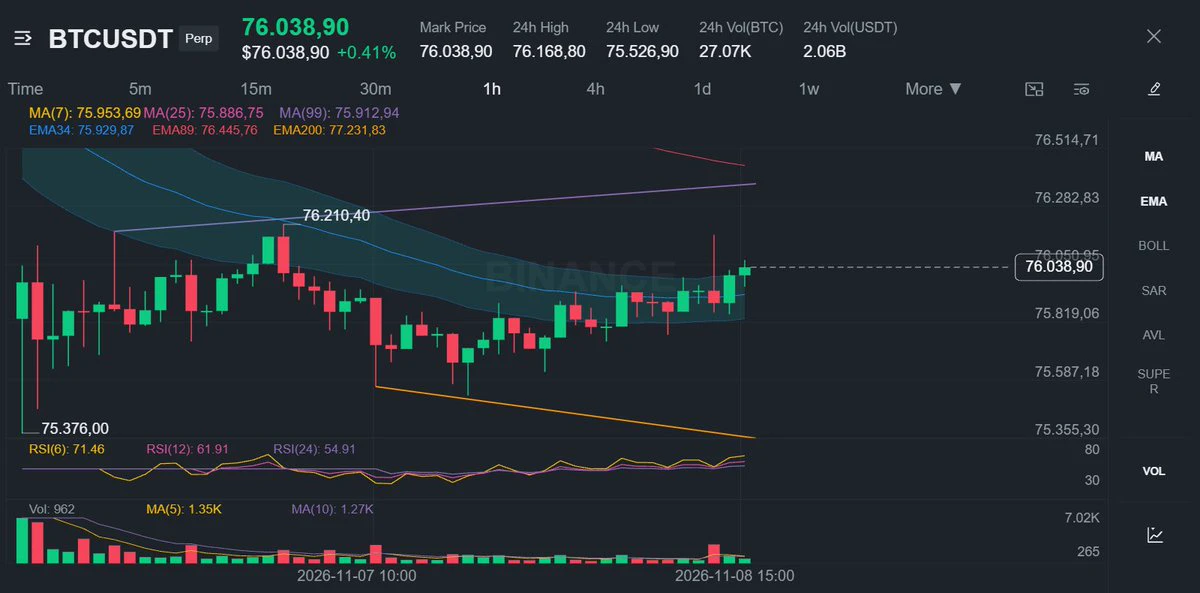
The portfolio starts with just 500 USDT; take a large position and add funds once it becomes profitable
As always, the main focus is BTC + ETH
NEAR HYPE SOL LINK SUI, full speed ahead
post-image
BTC-0.67%
ETH-1.26%
HYPE+0.24%
SOL-0.77%
SUI-1.05%
  • 1
Prediction markets assign a 52 probability that Bitcoin will rise to $70,000 by the end of 2026
live-cover
LIVE807
BTC Prediction near to 70,000 at the end of the year join discussion in my live Stream
post-image
BTC-0.67%
11.8 Monday Gold Opening Outlook
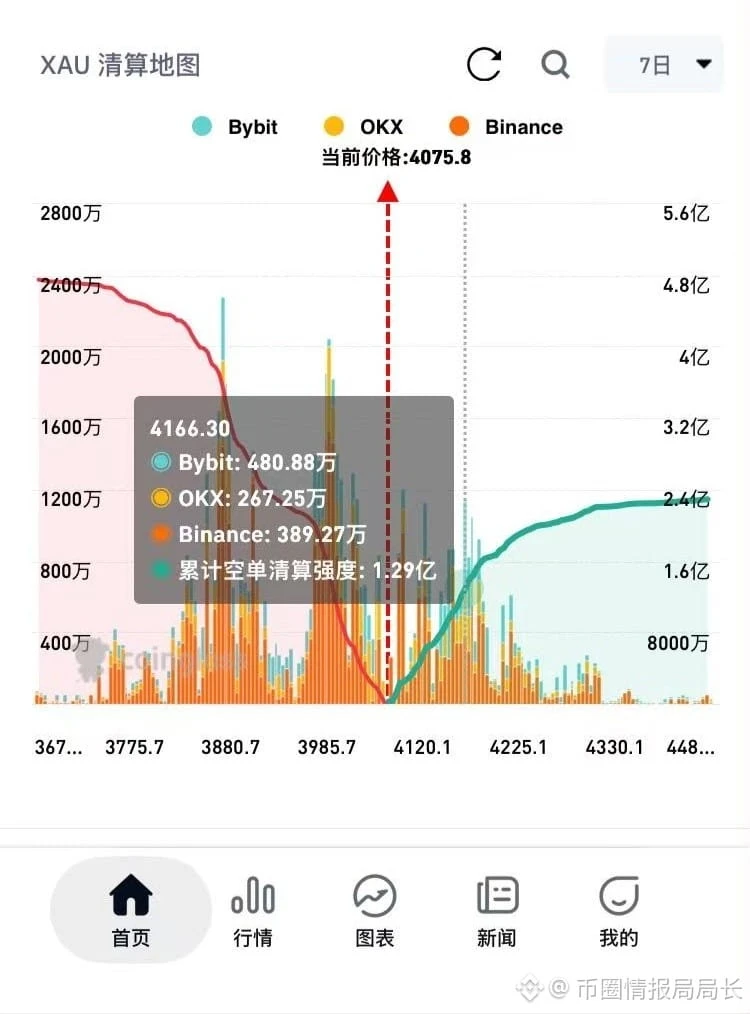
With over 8 years of experience, I wouldn’t claim to have the whole market under control, but I’m well acquainted with its ups and downs. I can anticipate the direction of key drivers of gold prices, such as nonfarm payrolls and Fed policy. $MU I always approach the market with respect. I don’t promise to win every trade; I rely on support levels and swing-trading strategies. Jingyi’s dear followers, stay steady and secure your profits. Many people chase rallies and sell off in downturns, but I stick to selling high and buying low. While others hesitate and mi
post-image
MU+4.71%
#Ahr999EntersBottomBuyingZone
AHR999 Enters the Bottom Buying Zone – Is Bitcoin Preparing for Its Next Big Opportunity? ₿
The cryptocurrency market is constantly moving through different cycles of fear, uncertainty, corrections, and recovery. However, some market indicators can help investors understand when Bitcoin may be approaching an attractive long-term accumulation zone. One indicator that has attracted attention among crypto enthusiasts is the AHR999 Indicator.
The latest visual concept highlights an important message: AHR999 is entering the bottom buying zone, potentially creating an
BTC-0.67%
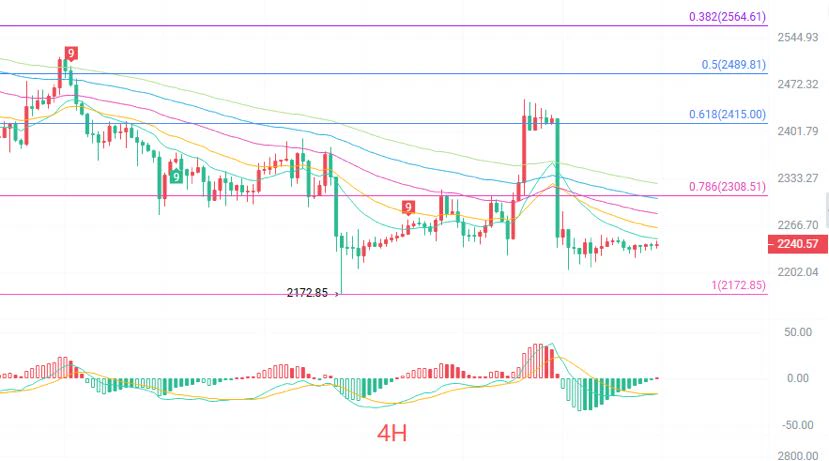
On the daily timeframe, the moving averages are in a perfect bearish alignment: price is below EMA15 at 2295, EMA30 at 2354, EMA60 at 2382, and EMA120 at 2324. The MACD lines are deeply negative, with an early-stage bullish divergence and golden cross forming. Bollinger Band width is narrowing, with the middle band at 2317 acting as dynamic resistance and the lower band at 2166 as key support. The TD count is at 4, with no completed reversal. Price has retraced approximately 20.3% from the high of 2806.76.
On the four-hour timeframe, EMA15 at 2248 is immediate resistance, while EMA30/60/90/120
post-image
ETH-1.23%
CRYPTO MARKET UPDATES
live-cover
LIVE737
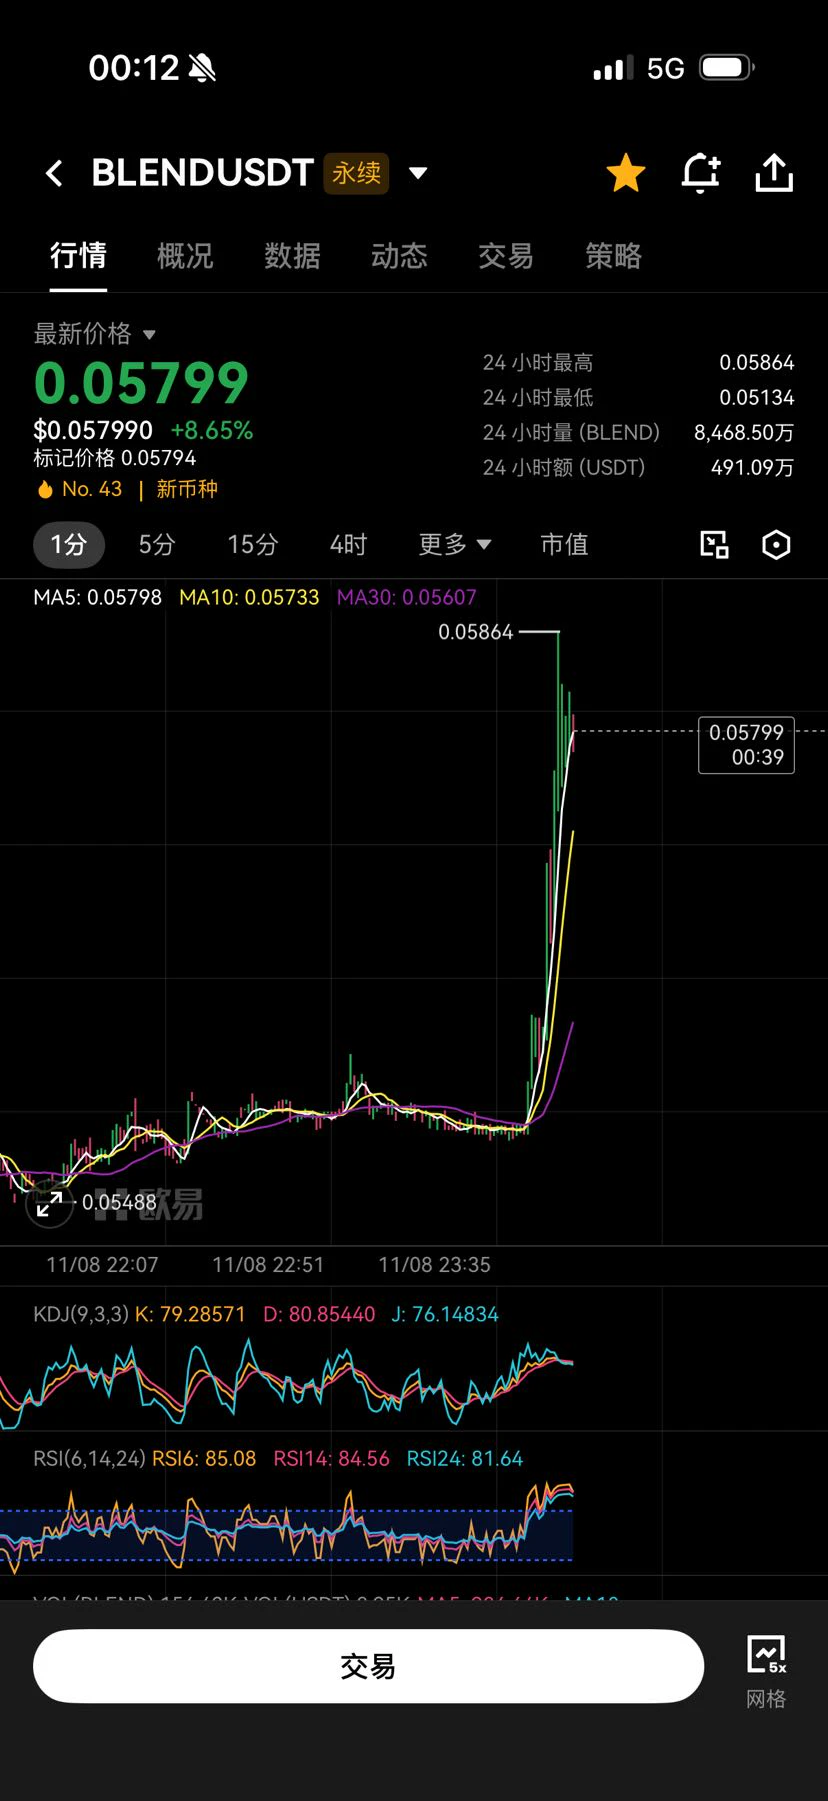
BLEND, which I shared this afternoon, is taking off! Let me know if you got in. Let’s make some gains together~
post-image
BLEND-5.41%
  • 3
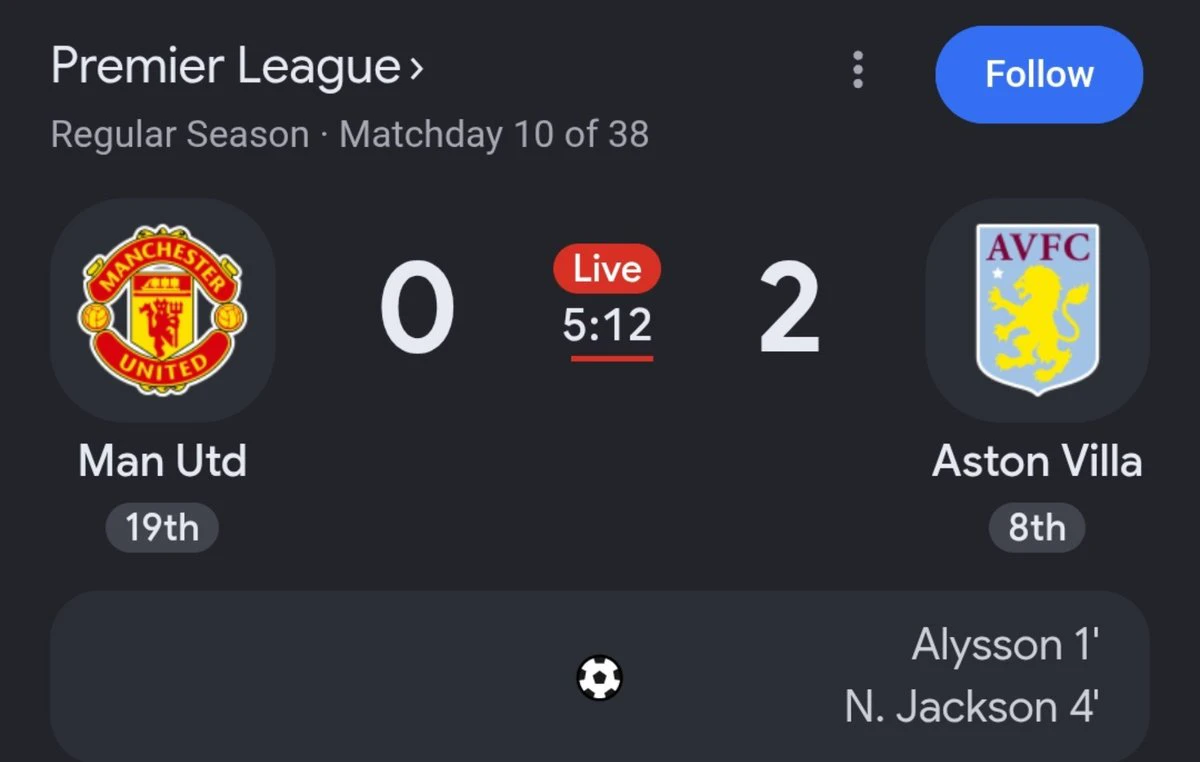
AS Roma is not Aston Villa.....
🤣🤣🤣🤣🤣🤣
post-image
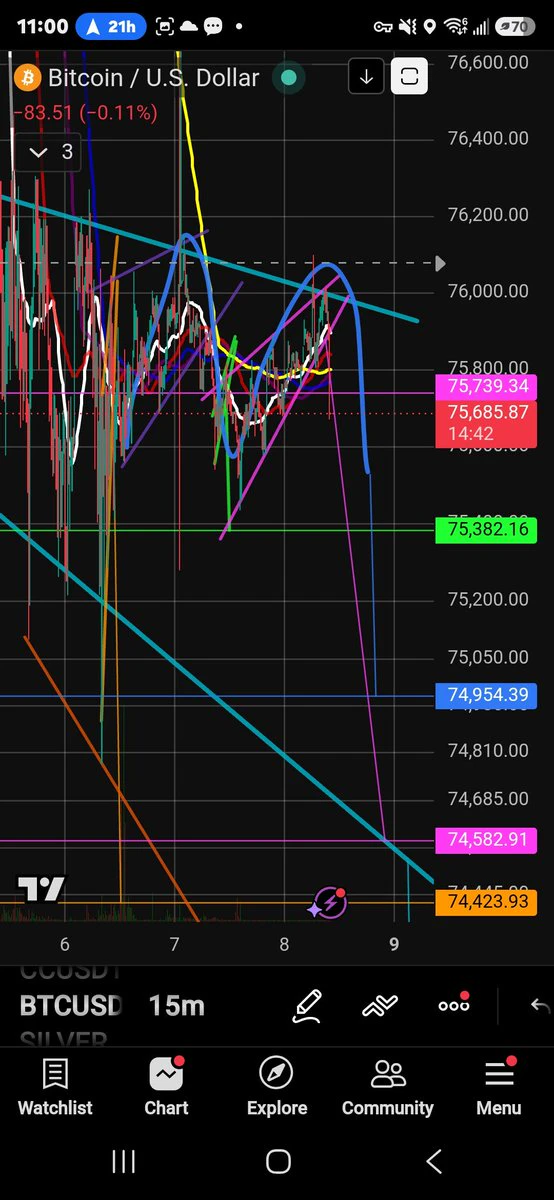
$BTC Breaking Downwards Fron The Pink Rising Wedge As Projected
Yes the chart is definitely messy. I understand. 💯
All of the patterns and measured moves play a role in price action.
I used to constantly clean the charts. Then I started to let it go.
This is when I realized how connected it all really is!
Nothing is ever financial advice.
I look at thing different than most.
My Goal Is To Learn And Teach The Symbiotic Nature Of The Charts.
#BTC #Crypto #Trading
post-image
BTC-0.67%
This aipassport—I honestly can't think of what else these few buttons can do... It just feels like making it play videos or listen to the radio would be even more pointless... After thinking it over and over, I made a QR code wallet and put my subway, bus, and payment QR codes in it. Even though it's still a pointless app that adds an unnecessary extra step, I really can't think of anything else this thing could do 😂... People with no imagination shouldn't buy this kind of thing 😂
post-image
BitFuFu’s October Bitcoin Mining Output Falls Despite Steady Hashrate
BitFuFu mined 137 BTC in October, down from 167 in September, even as managed hashrate held near 19.5 EH/s. The company attributed the drop in part to rising network difficulty, a reminder that stable capacity does not guarantee stable production.
A Bitcoin miner can run broadly the same amount of computing power and still produce fewer coins. BitFuFu’s latest monthly operating statement provides a neat example. The company reported November 6 that it mined 137 BTC in October, down from 167 in September, while total hashrate
post-image
BTC-0.67%
$FIL It’s been steadily grinding lower, and it looks like it’s about to break below the previous low—it’s only a matter of one wick. 0.4 isn’t far off either. I’ll place 50% of the 5,000 at 0.4, then place the remaining 50% at 0.1 and see whether I get stuck holding the bag again. This will be my last time averaging down. Surely it won’t fall to 0.00-something; there’s no chance of that right now, though in 2 years, who knows,
post-image
FIL-2.00%
Load More

Join 40 M users in our growing community

⚡️ Join 40 M users in the crypto craze discussion

💬 Engage with your favorite top creators

👍 See what interests you

Trending Topics

USCPIDataIncoming

12.56k Views1.64k Discussing

The U.S. October CPI report will be released on November 10 at 8:30 a.m. ET. September CPI came in at 3.7% year over year, and markets will be watching closely for signs that inflation is cooling, especially in core CPI. A softer-than-expected reading could strengthen rate-cut expectations, while hotter inflation may pressure risk assets through higher Treasury yields and a stronger dollar. How do you think this CPI print will move $BTC, U.S. stocks and gold?

USAIStocksHitHard

28.11k Views3.74k Discussing

USNonfarmPayrolls

53.62k Views4.48k Discussing

View More