Square
Following
Hot
News
Profile
Share your thoughts
placeholder
Article
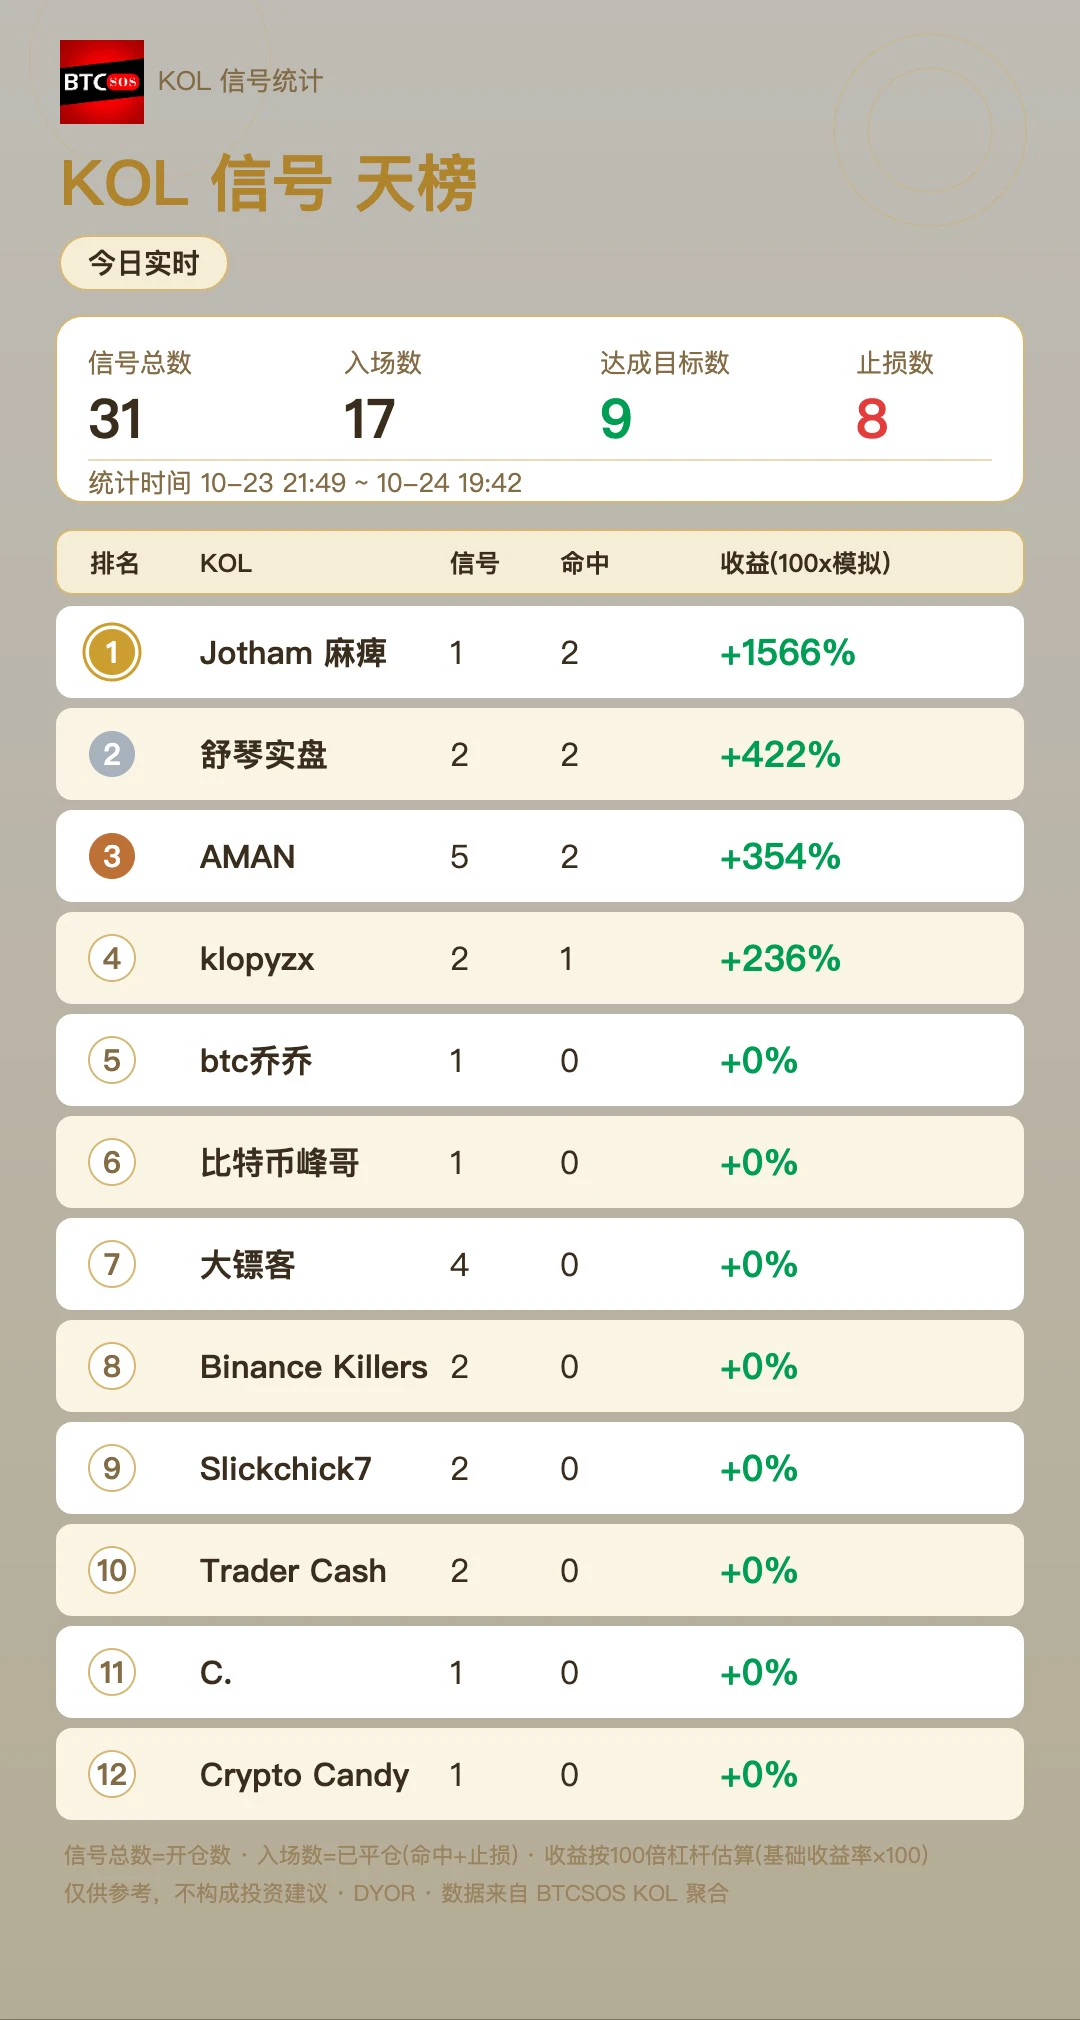
🏆 **Today’s KOL Performance Rankings (Simulated 100x Basis)**
Jotham Mabi dominates the leaderboard: 2 settled trades, both wins, a 100% win rate, and simulated returns of +1566%! Shu Qin follows closely with live trades: 2 wins out of 2, +422%. Today’s total signal count was 31, with 17 trades settled: 9 wins and 8 stop-losses, for an overall win rate of 53%.
Today’s top performer was explosive. Who can challenge them next?
👇See the full rankings in the attached image--------------------------------$AWE $CHIP $FLR #特斯拉Q3汽车毛利率回升,自由现金流转正 TSLA +0.45% xTSLA +0.46%
post-image
AWE+0.03%
CHIP-4.50%
FLR-2.85%
TSLA-0.62%
Why Do Stablecoins Depeg? Understanding the Risk Mechanisms Behind Digital Dollars—from Reserves and Redemption to Market Liquidity
In the Web3 market, stablecoins are often used as units of account for trading, on-chain payment tools, and sources of DeFi liquidity.
Because many stablecoins target the US dollar, users can easily get the impression that as long as the price stays close to $1, they are as safe as cash.
But that is not the case.
A stablecoin’s price stability depends on multiple factors, including reserve assets, redemption mechanisms, market liquidity, smart contracts, and user
post-image
Trenches
ZIG
Z
bade
b
ZIG
0x8c...1145
Market Cap
$.
Change
.
24h Vol
$.
Holders
.
AGT
A
bade
b
AGT
0x5d...e274
Market Cap
$.
Change
.
24h Vol
$.
Holders
.
YMB
Y
bade
b
YMB
2TKD...pump
Market Cap
$.
Change
.
24h Vol
$.
Holders
.
BIRB
B
bade
b
BIRB
G7vQ...KNwG
Market Cap
$.
Change
.
24h Vol
$.
Holders
.
CNPY
C
bade
b
CNPY
0xc6...ddd2
Market Cap
$.
Change
.
24h Vol
$.
Holders
.
The UAE's digital government regulator is moving the document vault of UAEPASS, the national ID used by 12.5 million people, to a dedicated Avalanche L1.
More than 350 government and private-sector entities rely on UAEPASS.
@avax
AVAX-3.00%
The hardest part of trading sometimes isn’t getting the direction right, but admitting that you don’t have enough evidence yet.
When I review a trade, I ask myself three questions:
What conditions was I relying on before entering?
What signal would indicate that I need to reassess my original judgment?
Was the position size and risk within what I could afford to take on?
If I can’t answer these three questions, maybe what I need isn’t a more certain opinion, but to write out my plan first.
When you review your trades, which step are you most likely to overlook?#btc #crypto
BTC-1.37%
#GateSquareHalloween BTC at $80,790, ETH Near $2,370: The Real Crypto Monster Is Leverage Without a Plan
The scariest moment in crypto is not always a sudden red candle. It is watching the market move against you while your position is too large, your leverage is too high, and your exit plan exists only in your head.
This Halloween, Bitcoin is hovering around $80,790 and Ethereum near $2,370. Both are facing pressure, and the market is delivering a familiar warning: when volatility rises, a trade based on fear of missing out can turn into a liquidation before the trader has time to react.
**Th
post-image
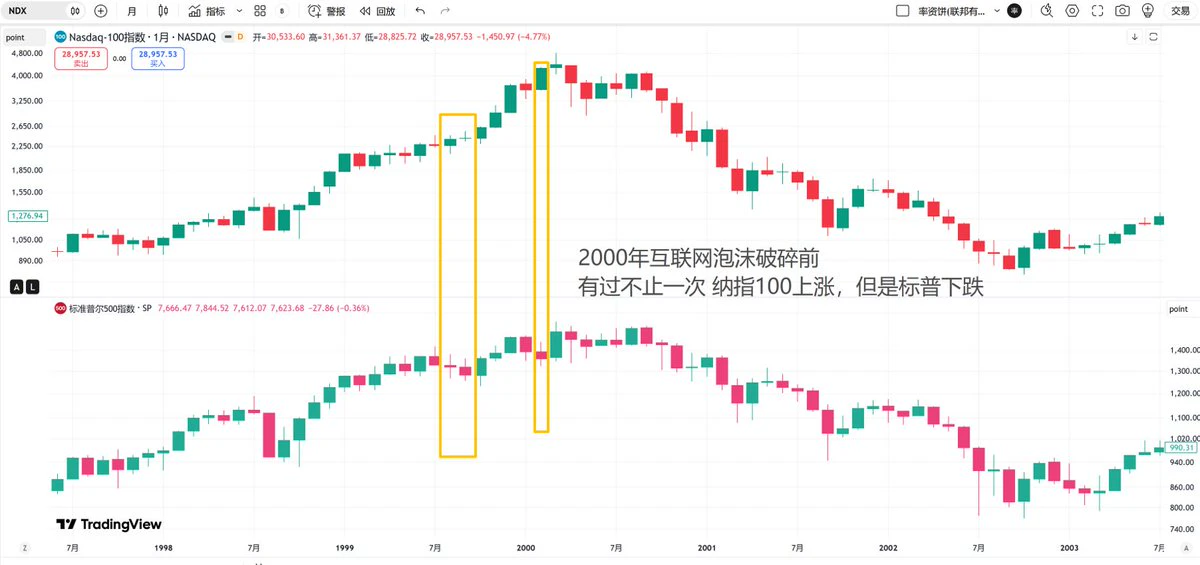
Before the dot-com bubble burst in 2000, this happened more than once:
The Nasdaq 100 rose while the S&P fell—in August–September 1999 and February 2000.
The leaders among internet tech stocks were probably siphoning money out of the US stock market.
The most recent occurrence of the same phenomenon was in December 2024, and the US stock market did indeed correct in February–May 2025. This may have been a coincidence, though, since Trump was imposing tariffs at the time.
Since 2025, this monthly chart pattern has not appeared. The monthly charts for NDX and SPX have been highly synchronized.
O
post-image
SPX-6.34%
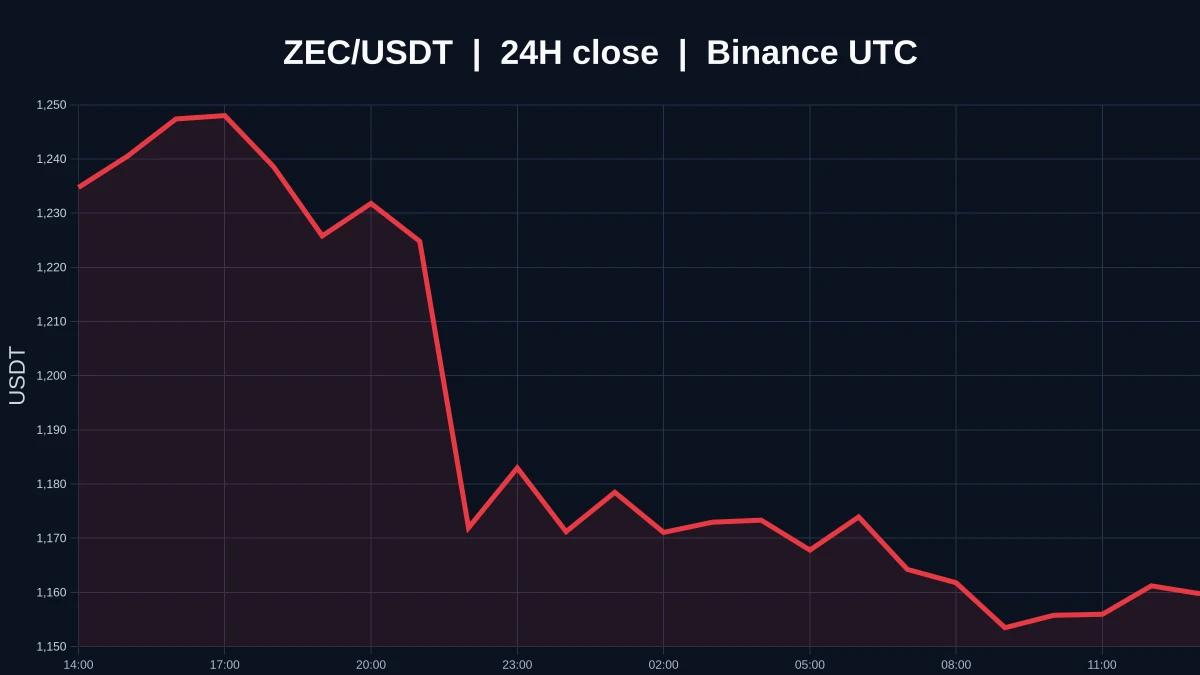
$ZEC Currently trading at 1160.21, down 6.16% over 24H. The 1H outlook is weak, with price below the EMA20 at 1178.01 and RSI at 33.54; the 4H outlook is weaker, with RSI at just 18.23 and the structure under pressure. 1H resistance is at 1258.61, with support at 1142.22; 4H resistance is at 1368.40, with the same support at 1142.22. Volume is only 0.30x the average of the last 20 candles, so a break on a single candle requires confirmation from participation.
In the next review, check whether price can hold above the 1258.61 resistance level. The setup is invalidated if price falls below the
post-image
ZEC-6.79%
You can always trust my AI-approved signals. 👀
Lately, all I do every day is sit in front of my computer binge-watching short dramas on Hongguo and waiting for signals.
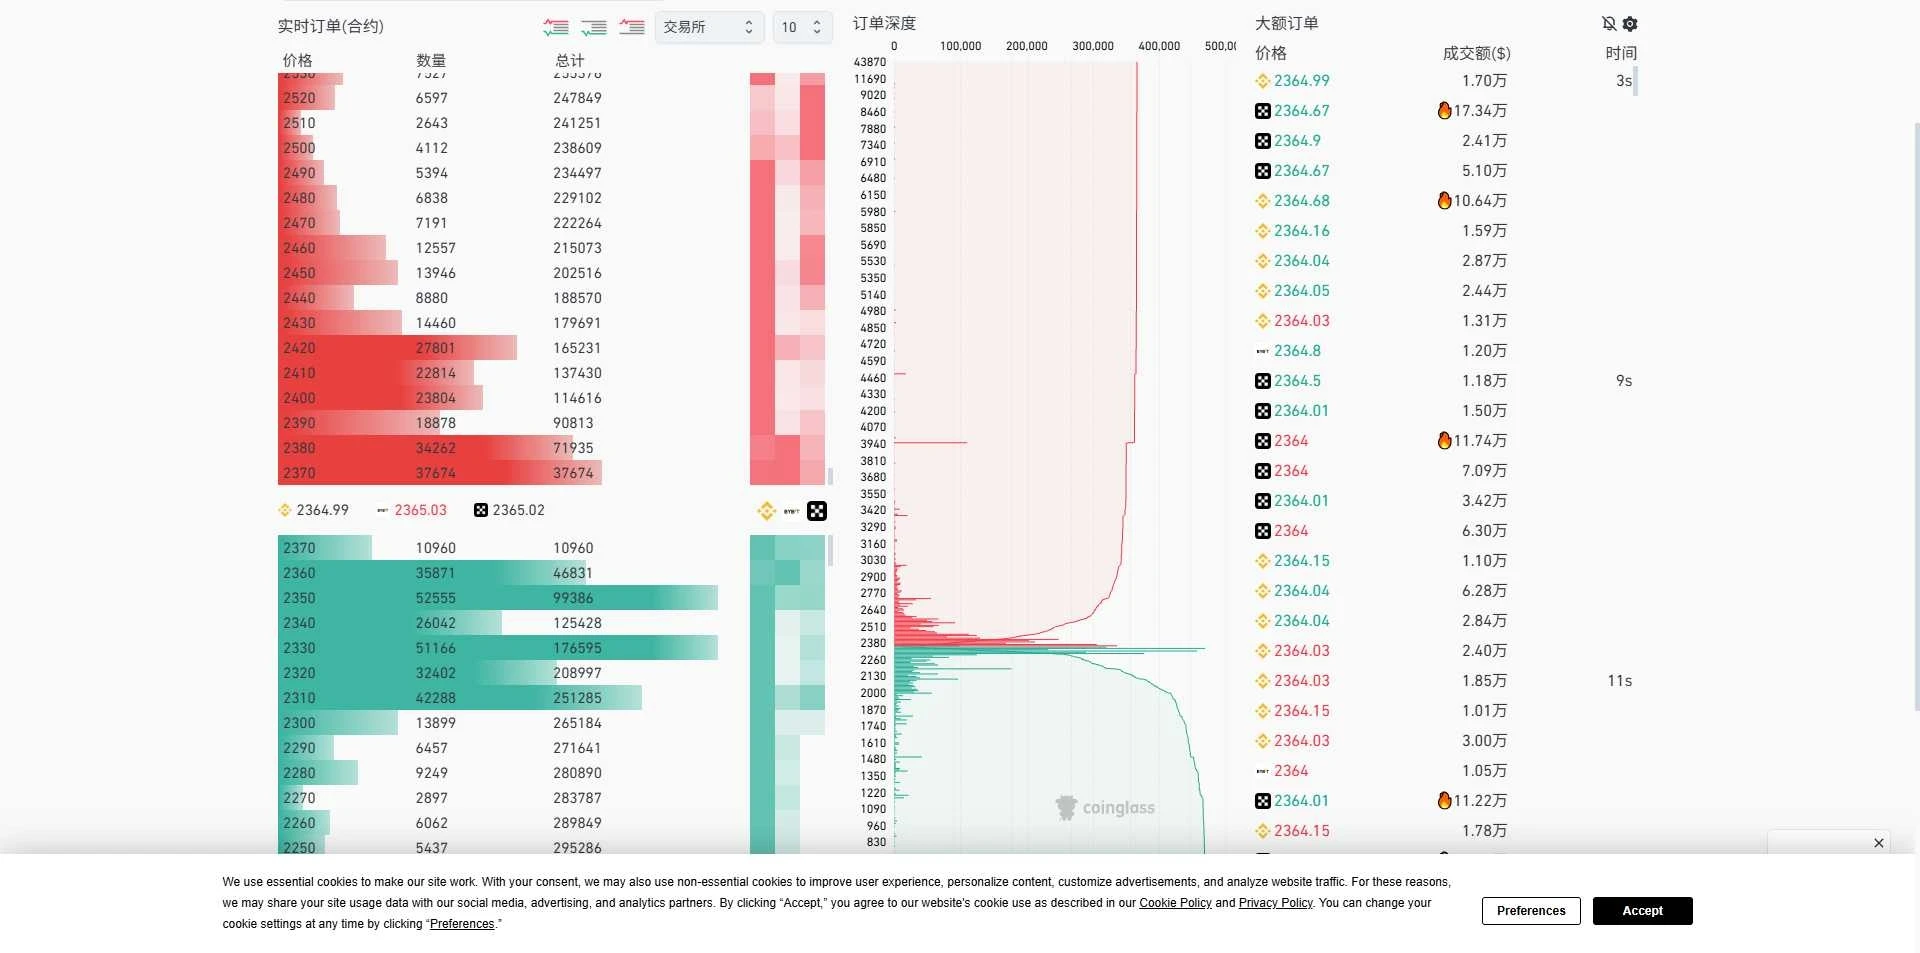
$ETH A rebound rally—is the bottom in and the market stabilizing?
Ethereum plunged yesterday, mainly due to the impact of crude oil prices, putting the entire market under pressure. Meanwhile, Friday’s funds were mainly defensive, with no strong recovery.
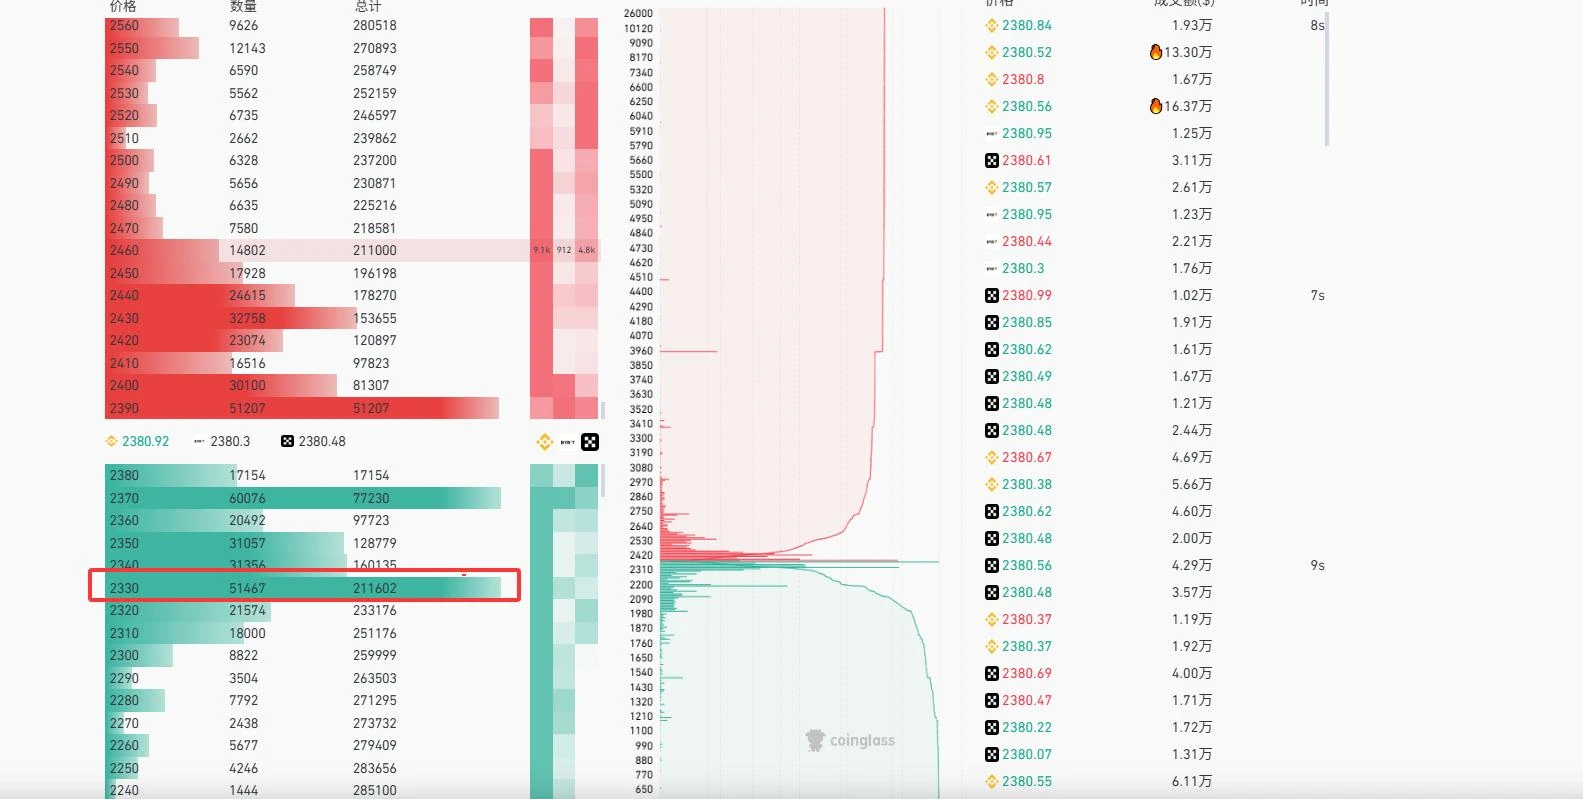
The data shows that there are many buy orders placed near the bottom. The market is generally waiting for a recovery on Monday, but these orders are mainly concentrated around 2330, while sell orders are mostly clustered around 2380.
There are two possible scenarios: first, a recovery to around 2400 followed by a decline, potentially to aroun
post-image
WallStreetTradingAnalystStar
$ETH Bears are very strong; the shorting market has arrived🔥
Coin Bro warned about Black Friday early on, with a bearish outlook across the board: any rally must be shorted. Tonight, everything is under pressure. Gold, major cryptocurrencies, and U.S. stocks all lack the capital to push higher.
Coin Bro believes ETH could fall to around 2375, but strangely, many longs have chosen to place limit orders at 2330. Could ETH plunge even further?#美股科技股集体大跌
repost-content-media
ETH-1.79%
Bitwise: Bitcoin implied volatility falls to a three-year low as long-term holders continue to distr
live-cover
LIVE1,801
$JCT This is not a short-selling recommendation. Open a long position at $0.003. JCT could still fall to that price, as its price is quite volatile. Long strategy. Go long with 1x - 3x leverage!
Entry price: $0.003Target price: $0.01Stop-loss price: $0.0025
post-image
JCT+25.14%
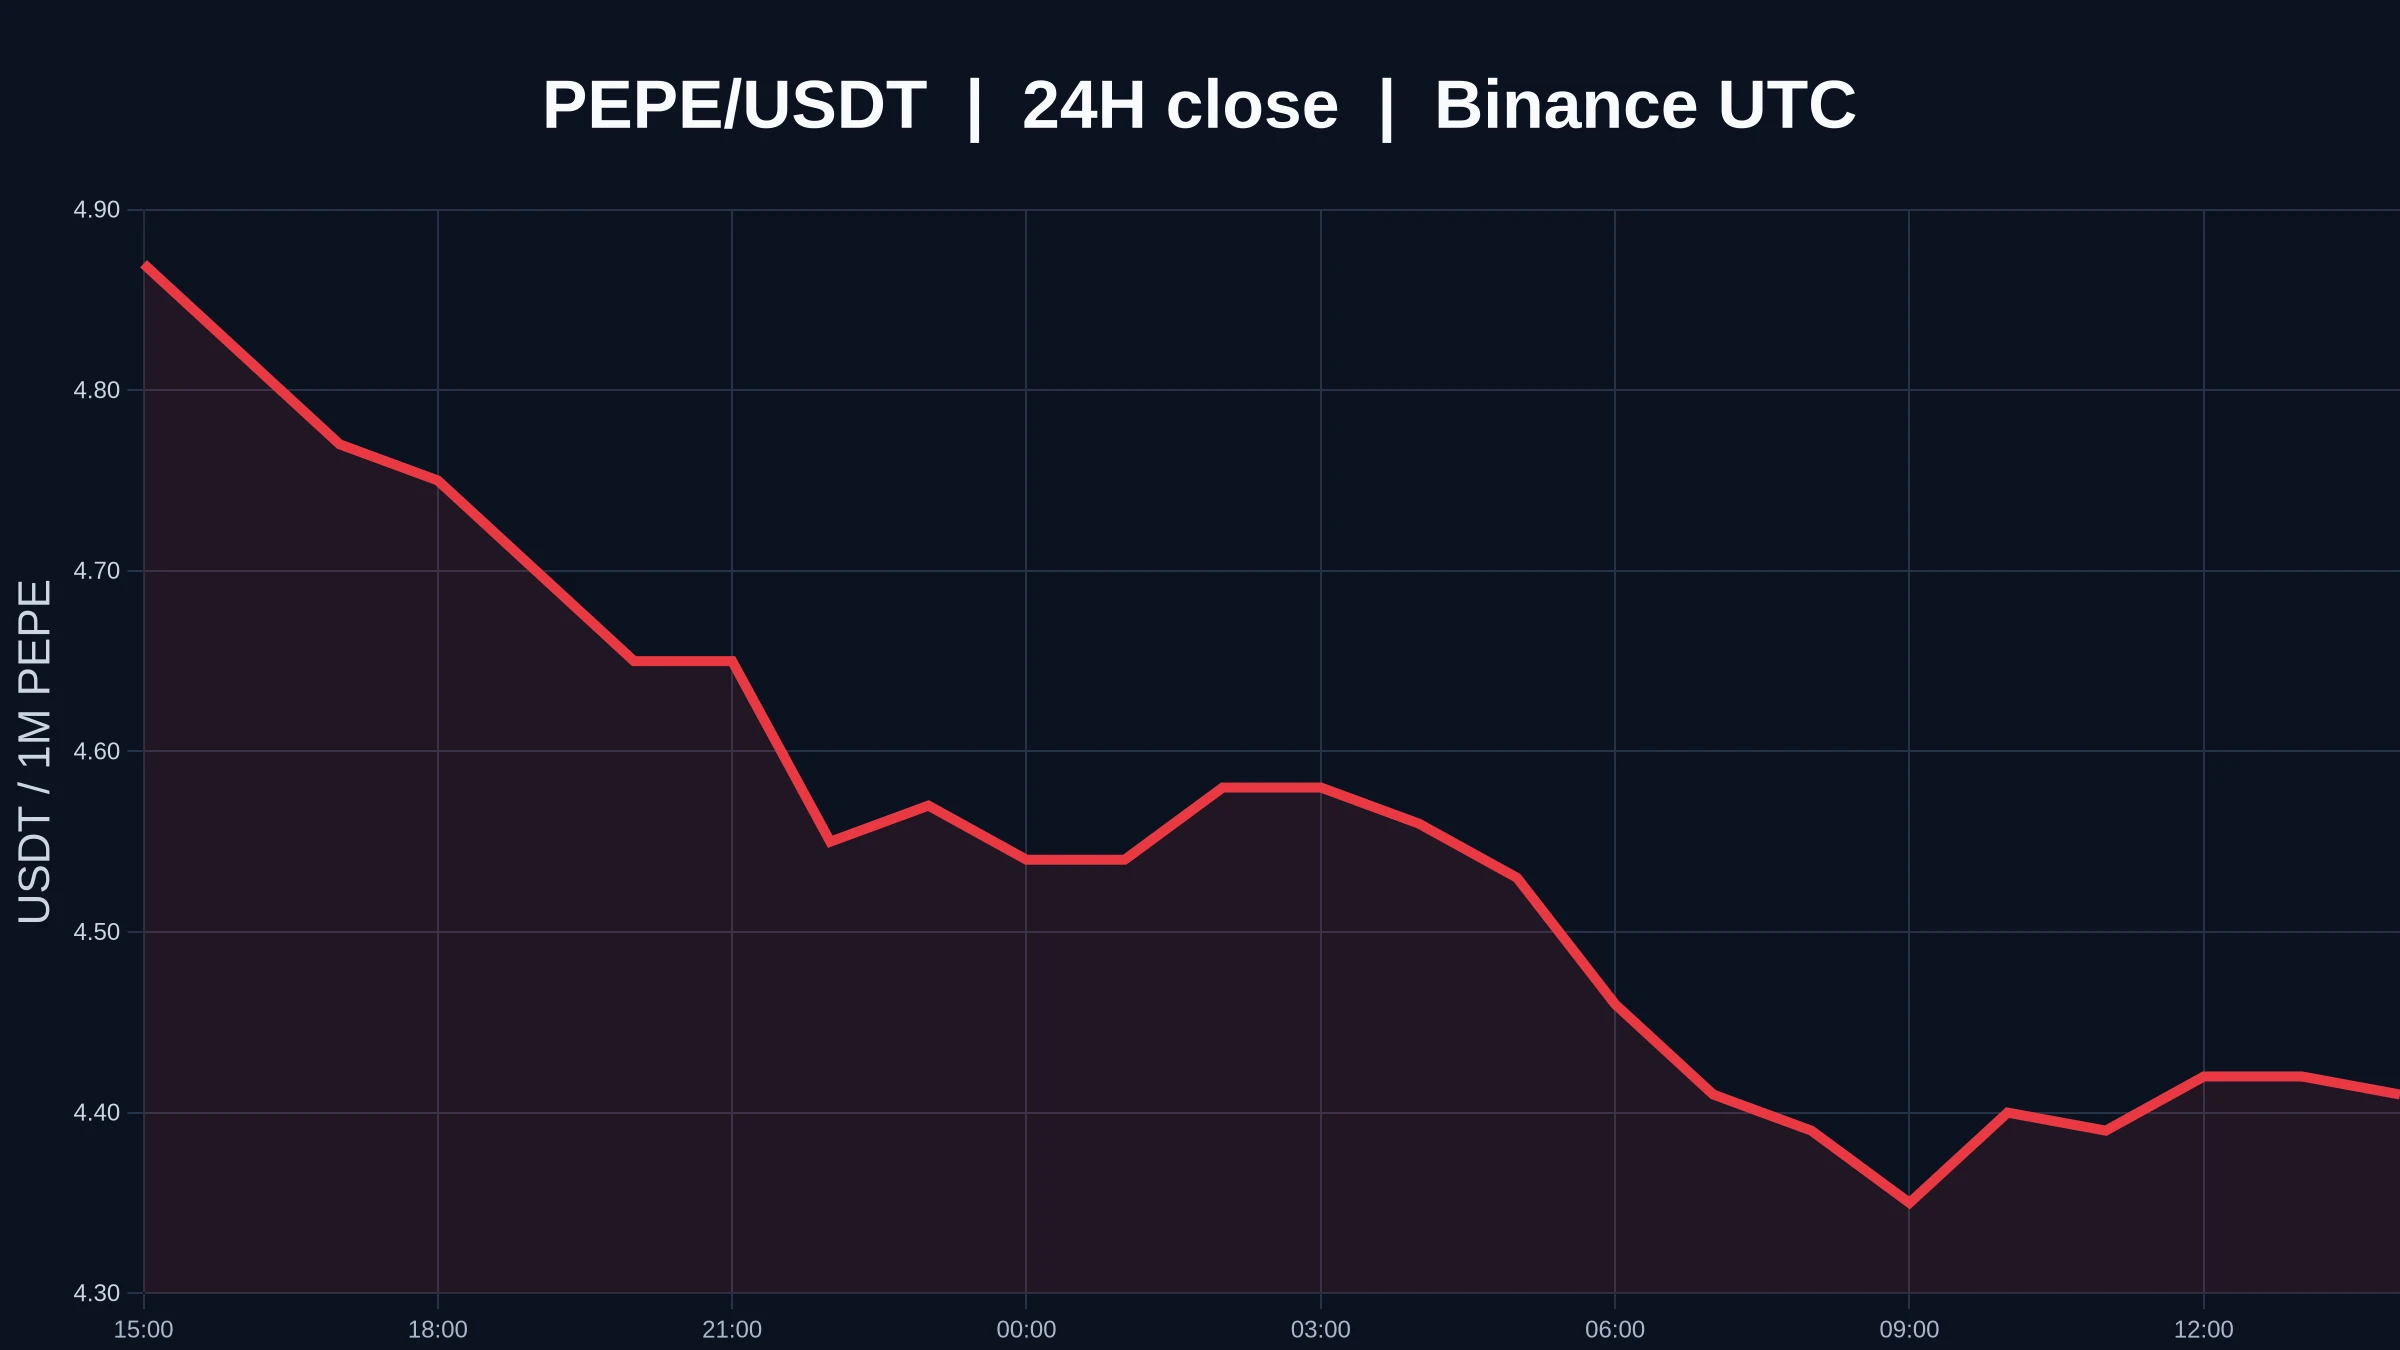
$PEPE plunged 13.02% in 24 hours and is now trading at 0.00000441 USDT. After a sharp move, the market often expects an oversold bounce, but the 1-hour and 4-hour trends are both weak, and trading participation is only 0.00x, making this look more like a continuation of the decline.
It’s easy to believe that the price is near the 1-hour support at 0.00000431, and that oversold indicators could trigger a recovery. If it stabilizes there and reclaims the level, a short-term bounce is possible.
But can the bounce last? Trading volume suggests otherwise: participation at 0.00x indicates no follow-
post-image
PEPE-11.39%
When market conditions are rough, I’m not as interested in staking out coins anymore.
I’d rather stake out people.
Because you never know what the next golden dog will be called, but people who’ve scored big results round after round are probably still going to spot opportunities earlier than most next time.
So the most worthwhile thing to do right now is go through the FOMO Top100 one by one.
· Who’s good at SOL
· Who likes going heavy on tokens with market caps in the hundreds of thousands
· Who can get in on tokens at a $10 million market cap
· Who’s still steadily adding to their positions
SOL-3.36%
#GateWCTCS9全球交易赛 #辣妹儿李嘉欣
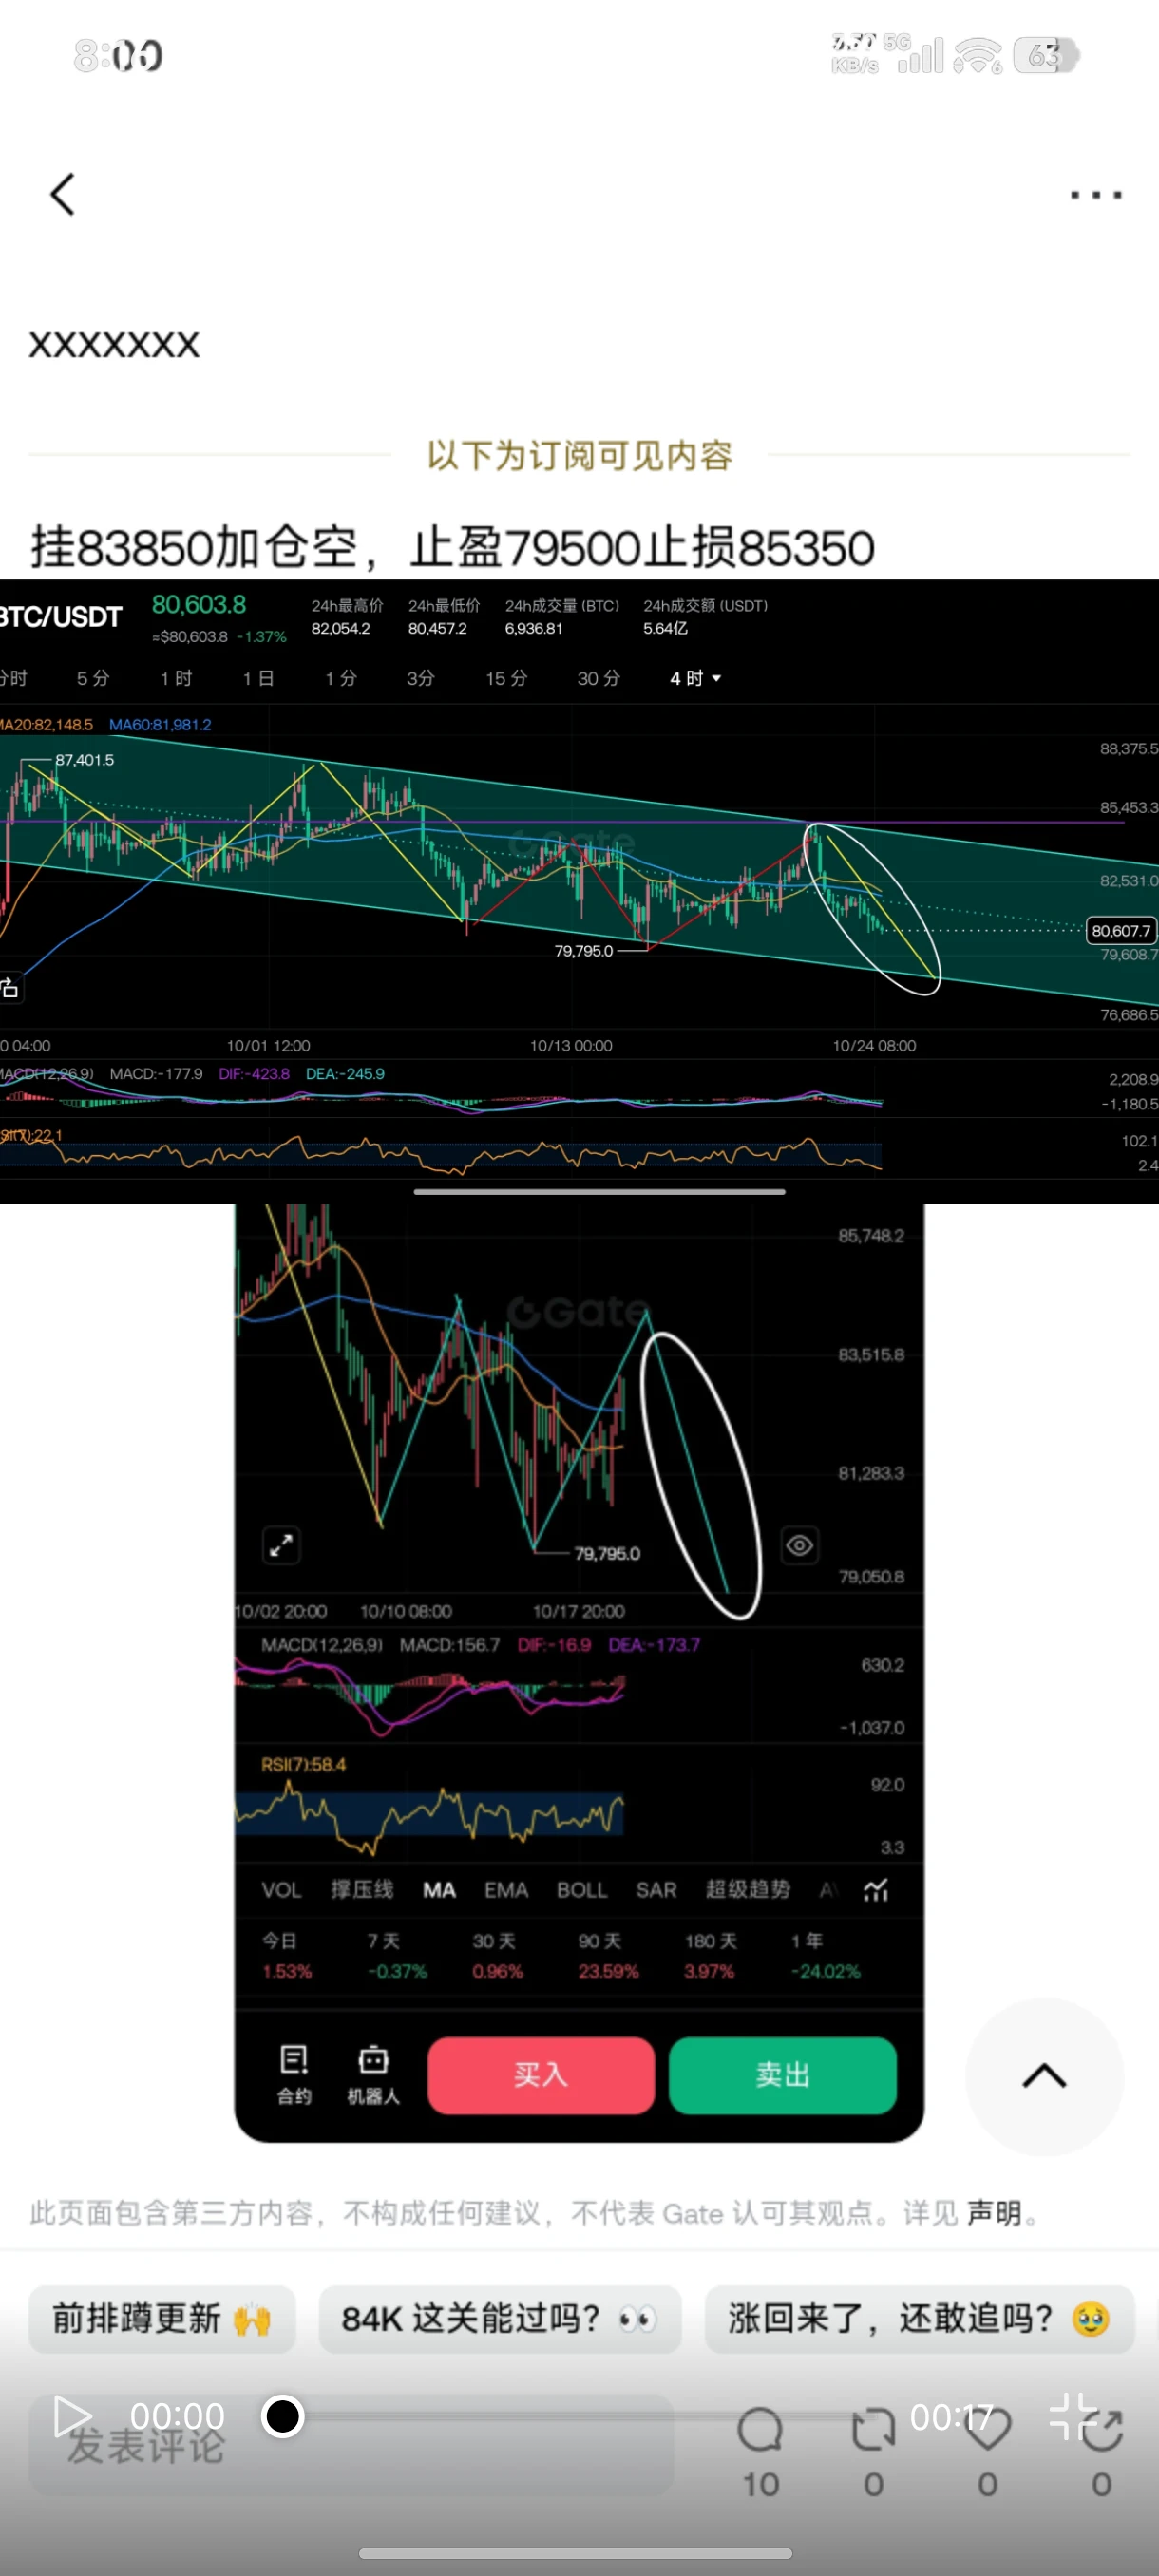
This move has been going back and forth and turned into a major descending channel???
If it keeps moving like this, I can basically guess that next week the main topic in all the major livestreams will be this descending channel. Let the market choose a direction and trade small positions: if the upper channel holds, you can short; if the lower channel holds, you can go long. Who knows whether any of the minor levels in between will break. Once you enter a trade, take a bite and run, or take partial profits, leave the rest on, and move your stop to breakeven to see ho
post-image
  • 3
Analysis new crypto coin
live-cover
LIVE1,570
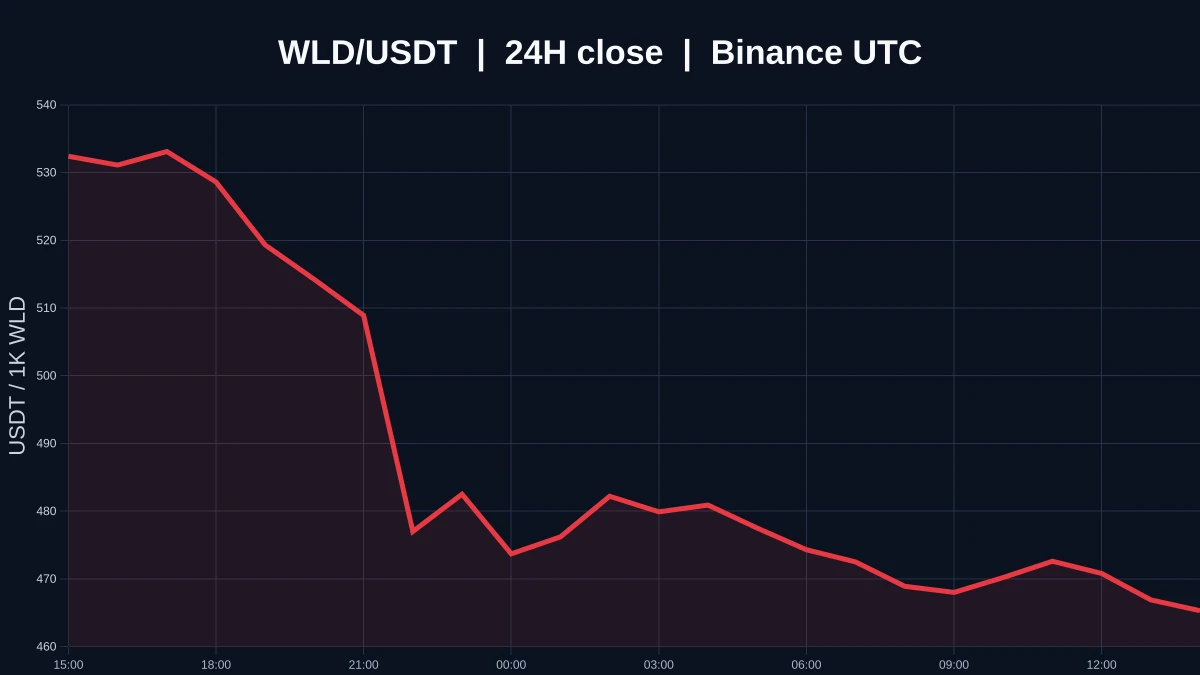
$WLD is currently trading at 0.4653, down 13.16% over 24H. The 1H RSI is weak at 38.8, while the 4H RSI is weaker at 24.2. Watch whether price can hold above the 0.5358 resistance and reclaim 0.4642 if support is lost. Volume is only 0.08x the average of the last 20 bars, so participation needs to be confirmed. Market volatility is high; for observation only.
post-image
WLD-13.31%
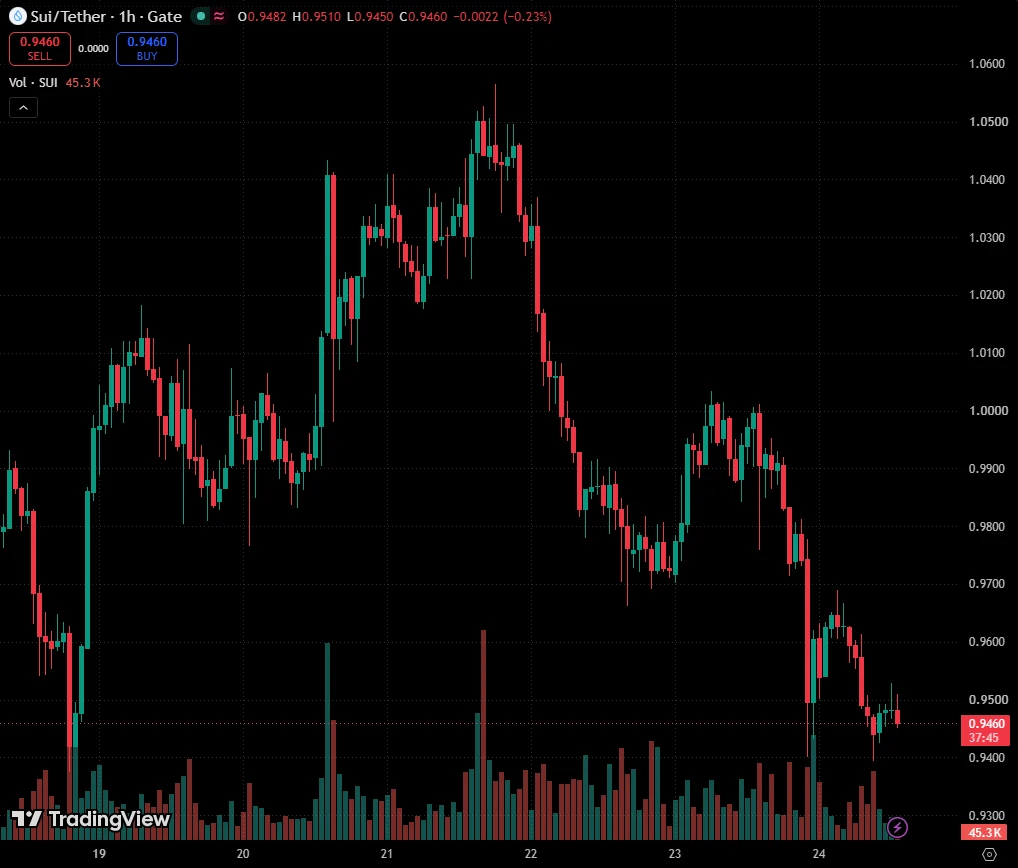
$SUI SUI / USDT (DOUBLE BOTTOM FORMATION)
Market Structure & Technical Outlook
Price is currently in a bearish trend, consistently forming Lower Lows (LLs) and Lower Highs (LHs). However, bullish RSI divergence on the 1H timeframe indicates a potential loss of bearish momentum. Additionally, a Double Bottom pattern has formed at a strong support zone, suggesting the possibility of a bullish reversal.
Price may reverse its current trend following a breakout above the previous Lower High (LH). Therefore, a Buy Stop order has been placed above the LH level to confirm a potential bullish market st
post-image
SUI-5.73%
#美股财报季 #Gate广场万圣节 Three Levels of Earnings Valuation
When reading a financial report, investors need to look at three levels; retail investors usually only look at the first.
Level One Absolute Growth: how much revenue and profit increased year over year
This level is easiest to see and easiest to be misled by. When last year's base was low, the growth rate looks good but means nothing. When you see "300% year-over-year growth," first ask: Was the company loss-making last year?
Level Two Quarter-over-Quarter Momentum: whether this quarter accelerated or slowed compared with the previous quar
post-image
ThisIsTranslateContent:
#美股财报季 #Gate广场万圣节 Three Layers of Earnings Pricing
When reviewing an earnings report, investors need to look at three layers; retail investors usually only look at the first.
Layer One Absolute growth: how much revenue and profit grew year over year
This is the easiest layer to see, and also the easiest to be misled by. When last year's base was low, the growth rate may look good but mean nothing. When you see "300% year-over-year growth," first ask: Was the company loss-making last year?
Layer Two Sequential momentum: did this quarter accelerate or slow down compared with last quarter?
For growth stocks, sequential deceleration is more damaging than a year-over-year decline—because it means business conditions have reached a turning point. Many stocks are still reporting year-over-year earnings growth, but their share prices plunge because sequential growth has turned downward.
Layer Three Price-position alignment
How well it aligns with the current share price
The same 30% growth is positive when the share price is near a low, but after the share price has doubled, it is "in line with expectations," or even "below expectations." This layer is the most abstract, but it is the most critical in determining short-term price movements.
Three scenarios where "good earnings still lead to a drop"
Even when earnings are good, the reasons for a decline can be completely different, as can the appropriate actions. Scenario One: Earnings beat expectations, but the share price is high!
The market will immediately ask: Can the next quarter be even better? If the answer is "no," then investors take profits. AI computing hardware largely falls into this category today—not because earnings are bad, but because it is hard for the growth trajectory to get even steeper. Scenario Two: Earnings meet expectations, but the industry's fundamentals are questioned
This kind of decline often does not end in a single day, because it takes time to disprove the doubts.
Scenario Three: Earnings miss expectations, but the share price is already near a low
This may instead be an opportunity, because the bad news has already been priced in. But one strict condition must be met: guidance for the next quarter cannot be worse.
Management's comments on the next quarter are more important than this quarter's figures.
The three scenarios call for three different actions: the first is to reduce holdings, the second is to watch, and only the third merits consideration.
There is only one difference—whether the share price has already priced in the bad news.
How to distinguish a "wrongly sold-off stock" from one that "deserves to fall": four indicators, all drawn from the financial statements themselves and more reliable than any earnings forecast.
Indicator One Operating cash flow: net profit has risen, but has cash flow kept up?
If net profit grows but operating cash flow is negative, it means the profit is "on paper" and may have been built up through accounts receivable. These companies are the first to run into trouble in a tight-credit environment.
Indicator Two Gross margin: revenue has risen, but has gross margin fallen?
If revenue grows while gross margin declines, it means growth is being bought through price cuts. This kind of growth is unsustainable and becomes increasingly onerous. For truly healthy growth, gross margin should be stable or even rising.
Indicator Three Contract liabilities: have customers paid in advance?
An increase in this account means customers have already paid, securing future revenue; a decrease means orders are being worked through, and there may be a gap in the pipeline later. This is especially important to watch for manufacturing and software companies.
Indicator Four Adjusted net profit
Was the profit actually earned from "selling goods"? A large gap between adjusted net profit and net profit indicates that profits came from asset sales, government subsidies, or investment gains. Such profits will not recur next year; using this year's P/E ratio to estimate next year's earnings will lead to a miscalculation.
A practical tip
Check the disclosure date. Companies whose disclosure dates fall in the final few days often have mediocre earnings—companies with good earnings tend to disclose early because early disclosure can affect the share price sooner. This is a probabilistic pattern, not an absolute rule, but it is very useful.
repost-content-media
  • 2
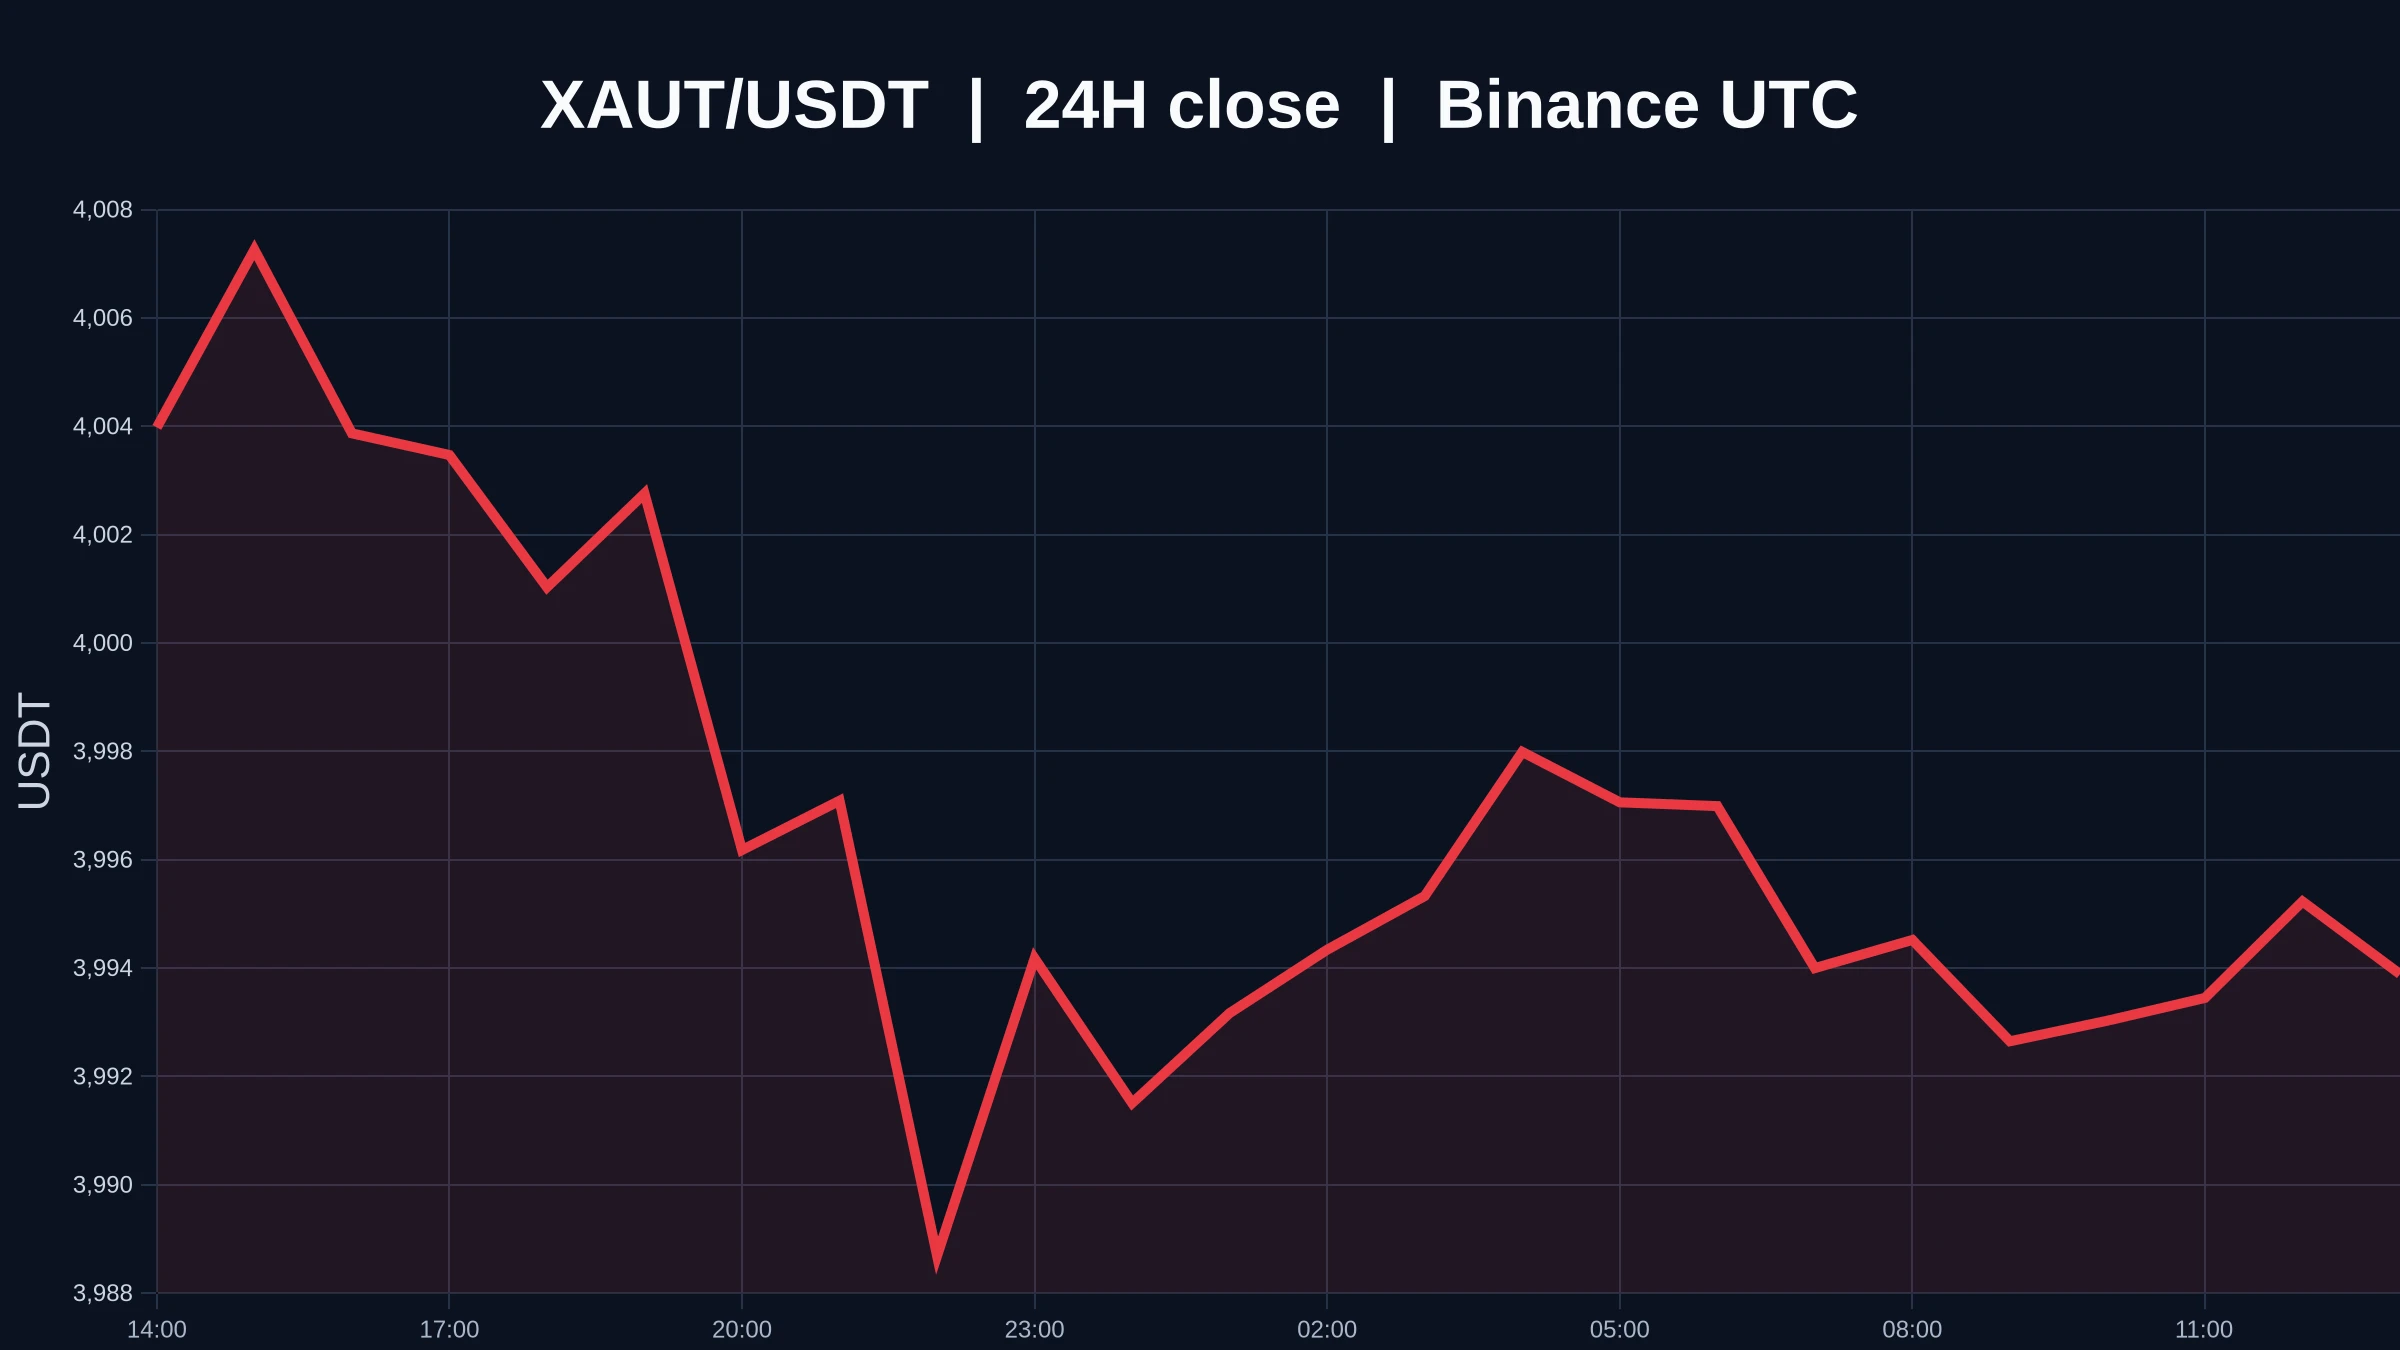
$XAUT Being Oversold Doesn’t Mean It Has Bottomed; Rebound Demand Is Increasing, but a Reversal Still Needs Confirmation
$XAUT is now trading at 3,993.22 USDT, down 0.86% over 24 hours, after fluctuating between 3,980.01 and 4,029.69. The 1-hour support is at 3,980.01, with resistance at 4,027.1. The 1-hour trend is weak, as is the 4-hour trend, while trading participation is only 0.15x. In this snapshot, the price has already fallen considerably, but the numbers alone do not constitute evidence of a bottom. Oversold and bottomed are separated by one thing: the price has to stop falling.
My v
post-image
XAUT-0.46%
#SolanaNonVoteTxHits8.92B #WCTCS9 ‌Solana's record usage meets a $100 test: an event study of the Alpenglow week at SOL $101.43
The record transaction count and the Alpenglow upgrade both landed this week, and SOL still sits near $101.43, a few dollars above the round number everyone is watching. I treated the week like an event study: what happened on each day, what the price did, and what the evidence says about the next move.
The record behind the hashtag
Solana reported 8.92 billion non-vote transactions for Q3 2026, up 104% from Q4 2025 and about 24% from Q2's 7.19 billion. Those numbers
post-image
SOL-3.36%
Load More

Join 40 M users in our growing community

⚡️ Join 40 M users in the crypto craze discussion

💬 Engage with your favorite top creators

👍 See what interests you

Trending Topics

USEarningsSeason

48.61k Views3.22k Discussing

The U.S. Q3 earnings season is in full swing, with major tech companies including Tesla and Meta reporting results. Market focus is shifting beyond revenue and profit toward AI spending, capital expenditure, margins and forward guidance. Which company’s earnings are you watching most closely?

GateWCTCS9GlobalTradingCompetition

550.81k Views7.83k Discussing

USConsumerSentimentNearRecordLow

2.48k Views182 Discussing

View More