
Square
Following
Hot
News
Notifications
Profile
Share your thoughts
placeholder
Article
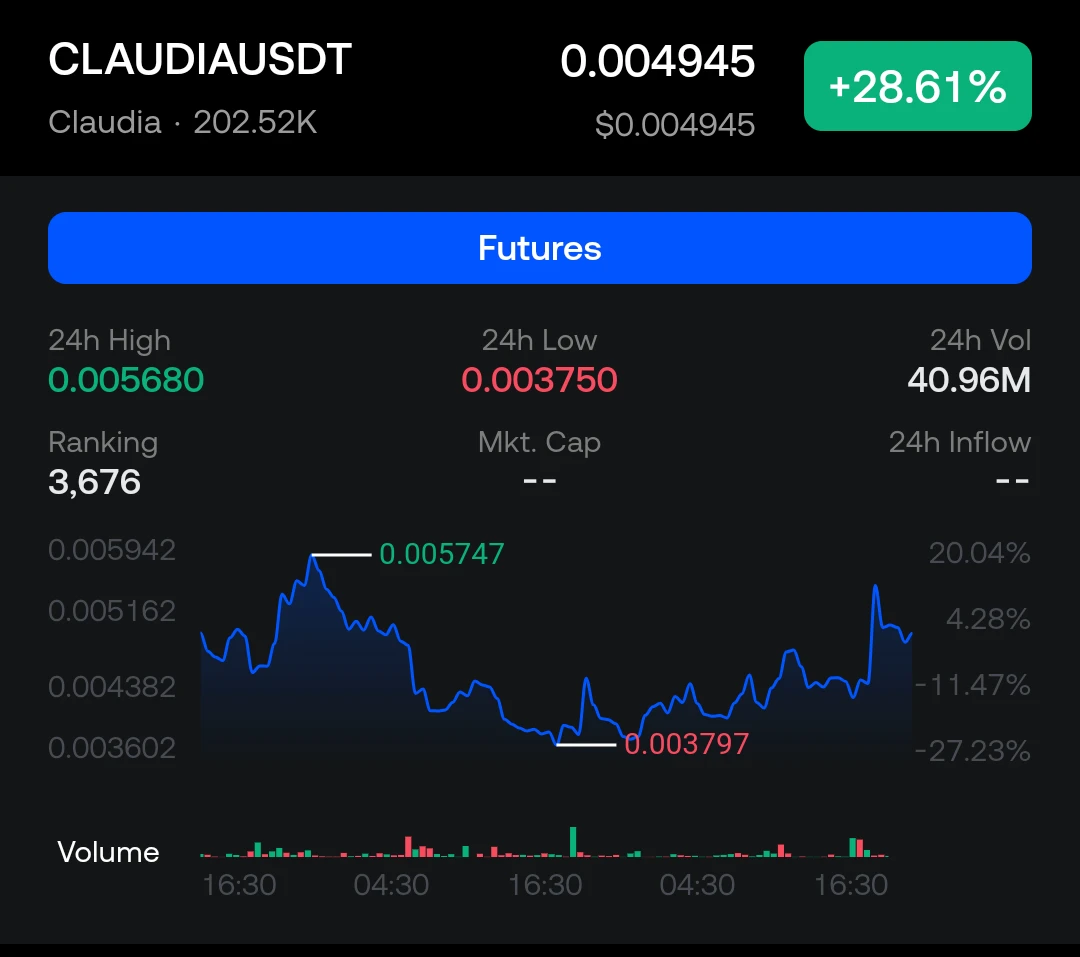
CLAUDIAUSDT – Perp 📊

🤖 Why did Claudia go to therapy? Because she couldn't handle the extreme personality swings of her own chart! 🎢📈

Bias: Extreme volatility. Massive spike to 0.0057, dump to 0.0037, and now a sharp V-shaped bounce back to the highs. Highly manipulated. ⚠️

📉 Short
Entry: 0.00550 – 0.00568 (Rejection from 24h high)
TP1: 0.00500
TP2: 0.00450
TP3: 0.00379 (Swing low)
SL: 0.00580 (Above 24h high)

📈 Long
Entry: 0.00440 – 0.00460 (Confluence: Mid-range support)
TP1: 0.00500
TP2: 0.00540
TP3: 0.00568 (24h high)
SL: 0.00400 (Below recent higher low)

🔑 Key Levels
Resista
post-image
CLAUDIA
CLAUDIAClaudia
Pump.Fun
MC:$2.01KHolders:1
26.08%
$SOPH This is garbage that should be delisted and shut down. I lost 3,000 on it today
post-image
SOPH-3.83%
Trenches
Snoopy
S
bade
b
Snoopy
7mEh...47Cn
Market Cap
$.
Change
.
24h Vol
$.
Holders
.
mihao
m
bade
b
mihao
4Cxj...pump
Market Cap
$.
Change
.
24h Vol
$.
Holders
.
bill
b
bade
b
bill
85Rh...pump
Market Cap
$.
Change
.
24h Vol
$.
Holders
.
AGT
A
bade
b
AGT
0x5d...e274
Market Cap
$.
Change
.
24h Vol
$.
Holders
.
PIEVERSE
P
bade
b
PIEVERSE
0x0e...25a9
Market Cap
$.
Change
.
24h Vol
$.
Holders
.
BTC pulled off a deep V-shaped reversal today, plunging to $61,000 before being yanked right back to $66,000. The buying pressure was genuinely fierce.
Bitcoin briefly plunged to around $61,000 intraday. Many were still waiting for it to keep crashing, but in the blink of an eye, the price had been pulled back to $66,000. The rebound was so fast it made you wonder if you were seeing the chart right. ETH, SOL, and XRP played out the same scenario, with clear buying support at the lows—buyers stepped in as soon as prices fell.
$BTC WICKED down to $61,946, then shot straight back up to around $6
post-image
BTC-0.67%
ETH-1.26%
XRP-1.15%
They've extracted your coin to zero
post-image
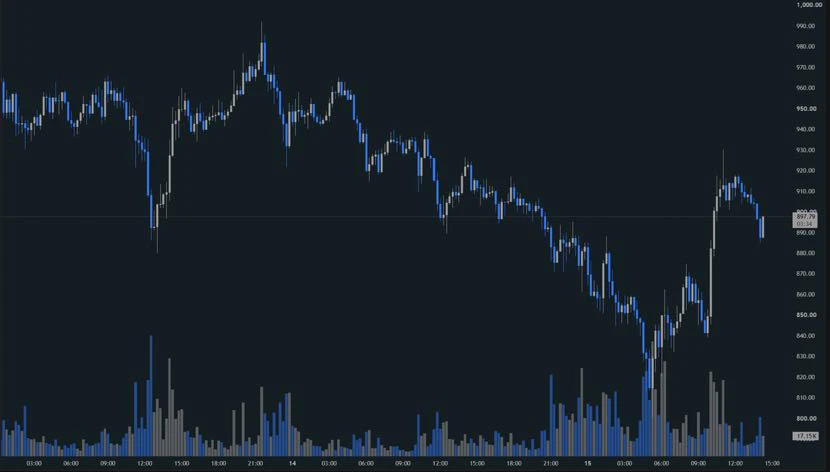
$ZEC There’s one detail about this selloff that I think is worth discussing 🤔

The 888 area we’d been watching was originally a support zone formed by a previous daily high, but this weekend’s selloff broke straight through it, with the low even touching around 800

But here’s the interesting part:

This morning, ZEC surged quickly from its low, briefly rebounding to around 930 and reclaiming the key zone it had previously lost

Looking at this price action alone, it does have the feel of a false breakdown

The problem, though, is that a series of Lower Highs and Lower Lows had already formed
post-image
ZEC+1.16%
  • 1
  • 2
Most posts don't fail in the middle. They fail in the first line, before anyone taps "see more".
So before you post, audit that one line. 5 checks:
1. Is it short?
Aim for under 12 words. If it runs past two lines on a phone, it's an intro, not a hook.
2. Is there something concrete?
A number, a name, a result. "We improved onboarding" is a shrug. "We cut our onboarding from 9 steps to 3" is a reason to keep reading.
3. Is the emoji doing anything?
One can work. Three in the first line read like a template.
4. Has the question earned its place?
A question hook works when the reader really want
post-image
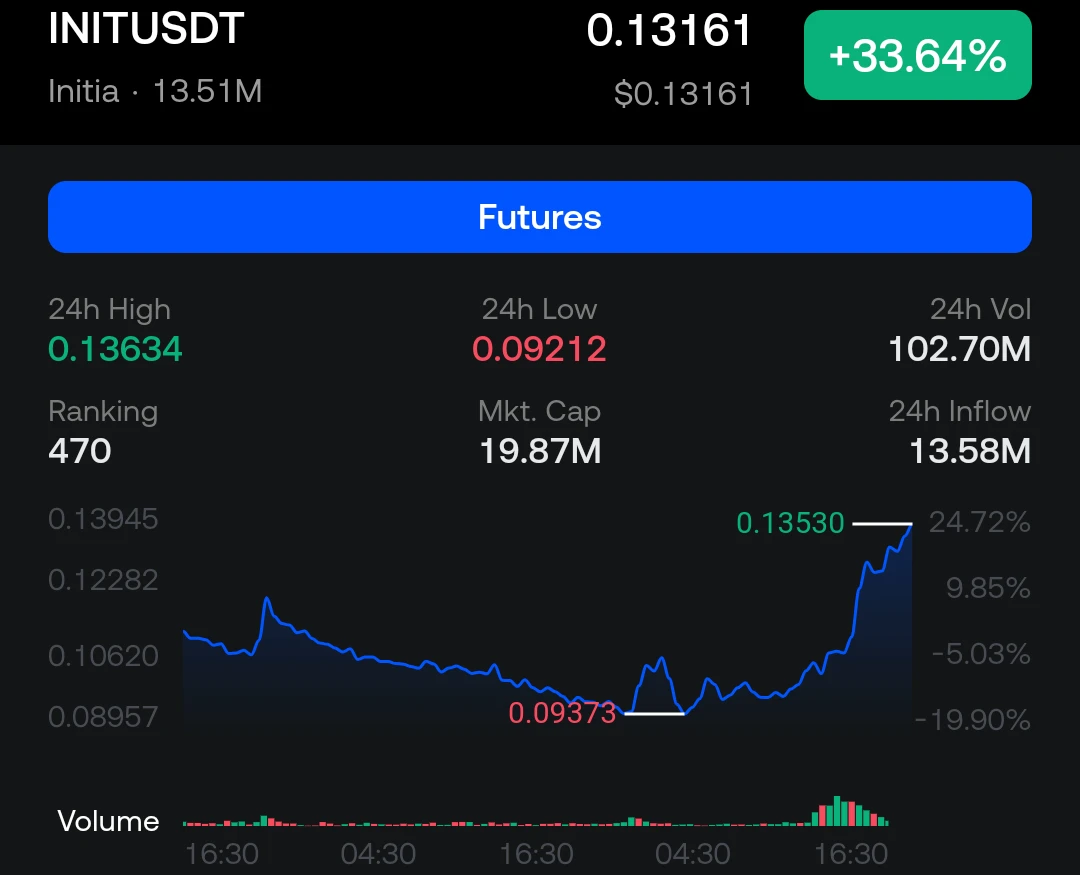
$INIT ‌INITUSDT – Perp 📊

🚀 Why did Initia go to therapy? Because it couldn't handle the pressure of initializing its own massive comeback! 🛠️📈

Bias: Strong Bullish momentum. Price printed a deep V-bottom at 0.092 and has been unstoppable since, aggressively testing the 24h high. Expect a breakout or a pullback to support. 🔥

📈 Long
Entry: 0.12000 – 0.12200 (Pullback to prior consolidation)
TP1: 0.12800
TP2: 0.13161 (Current)
TP3: 0.13634 (24h high)
SL: 0.11500 (Below the breakout origin)

📉 Short
Entry: 0.13500 – 0.13634 (Rejection from local top)
TP1: 0.12600
TP2: 0.11800
TP3: 0.1
post-image
INIT-1.74%
If $0.23000 holds on the pullback, I plan to go long $ARIA . Take profit: $0.24000 Stop loss: $0.22500
post-image
ARIA+22.03%
The AI Infrastructure Carnage: $4.2 Trillion Wiped Out
Marked as "Important," AI Data Center Infrastructure Stocks have shed $4.2 trillion since June amid demand concerns. The tickers show Comfort Systems (FIX) down 1.29% and Corning (GLW) down 4.35%.
This is a staggering and deeply sobering headline that provides crucial context for the recent market volatility. A $4.2 trillion loss in market capitalization is a catastrophic destruction of wealth. It indicates that the market is experiencing a severe "AI Winter" scare or a massive reality check regarding the timeline and profitability of AI
post-image
FIX-1.29%
GLW-4.35%
MSFT+0.22%
AMZN-0.29%
GOOGL-0.98%
Looking back at the “blockchain earthquake” on May 12, 2022
CRYPTO MARKET OVERVIEW
live-cover
LIVE1,200
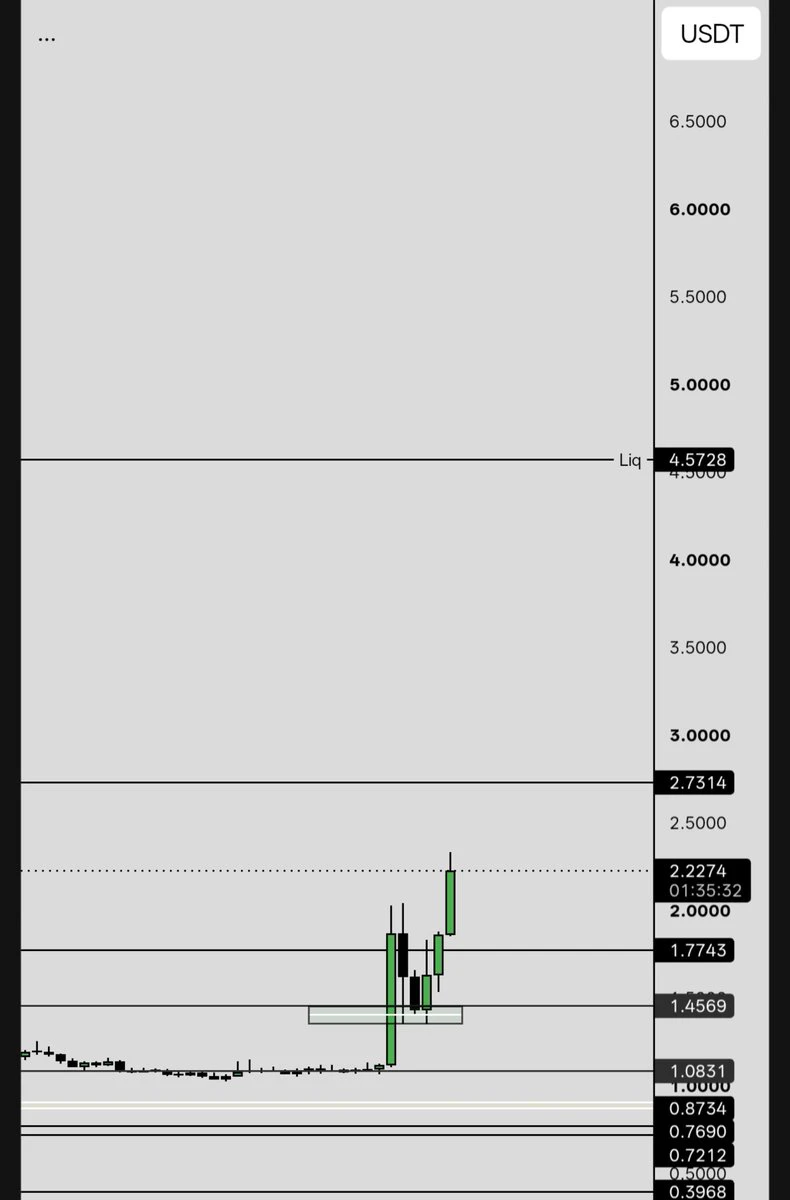
#Evaa $Evaa holds 2$ next tp at 2.73$ and 4.57$
post-image
EVAA-0.49%
$BTW Short positions are unbeatable, short positions
post-image
BTW-7.42%
Jaylen is here—everyone’s coming away with 0 points!!!
ethereum:0x118b70df4f06fa5678e7d543e6066e028c8ea0c0 are we gud sir in dead #market ?
do we need to study more PA?
midnight-3:native #kite topgainers
ETH-1.26%
NIGHT-3.10%
KITE-0.15%
That funding rate at 2 a.m. was insanely negative—longs got absolutely crushed. But what really determines tomorrow’s direction isn’t the futures market; it’s the Fed’s decision at 2 p.m. Cut rates, and risk assets get some breathing room; hold steady, and we grind sideways; actually hike, and tech stocks get wrecked first. It’s that simple. Don’t ask why. Save this, and come back tomorrow to see if it checks out.
post-image
  • 1
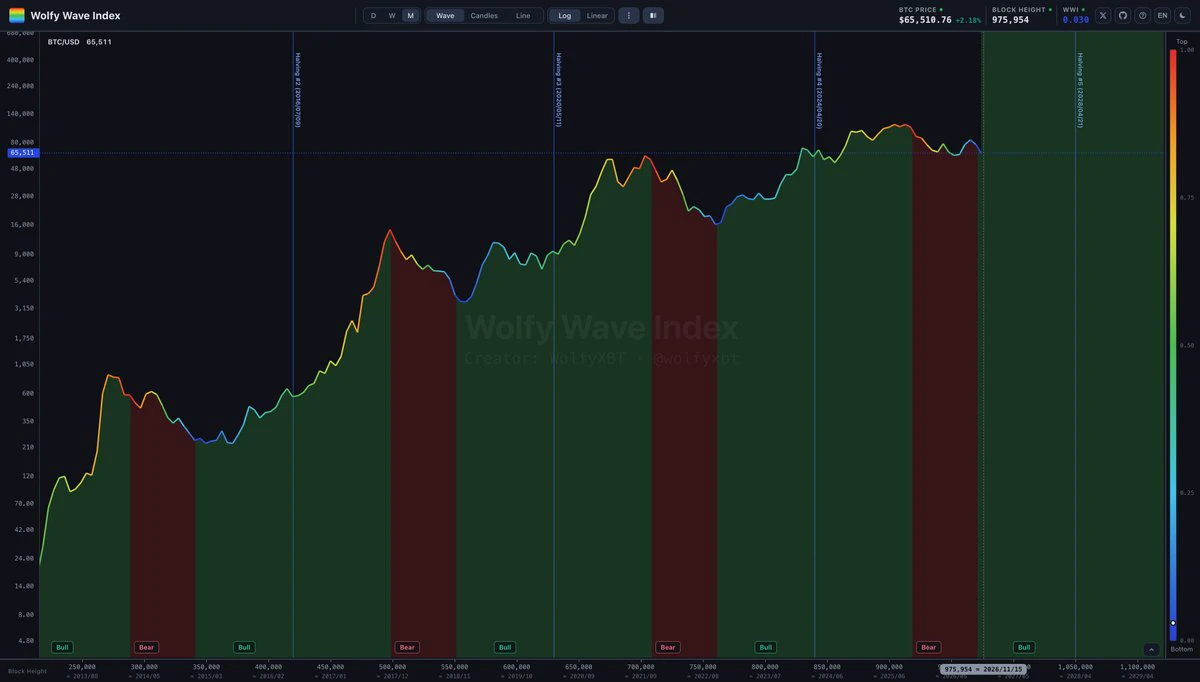
In the end, you’ll find that when Bitcoin really starts falling, it doesn’t need any reason. It ignores all fundamentals, technicals, news, and macro policies.
It just suddenly keeps drifting lower and lower until everyone is speechless, until everyone is convinced. The same goes when it rises.
The only thing with a pattern and any value as a reference is the four-year halving cycle. That’s why I created the Wolf Wave Cycle Index, hoping to help everyone see more clearly where we currently are in the four-year halving cycle.
post-image
BTC-0.67%
LONG ALERT SENT 🤯 I’m going long here‼️‼️‼️👇 Entry: 0.01691 Stop-loss: 0.01675 TP1: 0.01719 TP2: 0.01745 TP3: 0.01727 Click here to trade 👇⬆️⬆️ Go long with me...👇⬆️ $SENT
post-image
SENT-5.09%
BTC Market Crash or Just a Healthy Correction?
live-cover
LIVE1,976
Analysis only
Item Short position
15-minute entry 1,828–1,845 range (preferably after a pullback fails to break above the upper band)
Stop-loss Above 1,858 (previous high + above the upper band)
Target 1 1,806 (15m midline)
Target 2 1,767 (15m lower band)
Target 3 1,710 (4H previous low; a break below 1,753 is needed for confirmation)
Looking at both charts, the short setup is valid, but wait for the right entry. Don’t chase a short at 1,828.

4-hour chart — the broader trend remains bearish

Price at 1,828 is below the BOLL midline at 1,916.85, which is sloping downward—a clear bearish struct
ETH-1.23%
Load More

Join 40 M users in our growing community

⚡️ Join 40 M users in the crypto craze discussion

💬 Engage with your favorite top creators

👍 See what interests you

Trending Topics

GateIPOAccessAnthropic

350.2K Views2.7K Discussing

Gate IPO Access Phase 3 features Anthropic (ANT), with USDT subscription interest starting from 100 USDT. Successful allocations will be delivered as real shares to Gate Stock Accounts. Indicative price: $70–$78/share Subscription: Nov 12–17 (UTC+8) Allocation is not guaranteed. Please manage risk accordingly.

Dr.HanOxfordUnionSpeech

151.3K Views510 Discussing

USOctoberPPIBelowExpectations

481.4K Views1.4K Discussing

View More