
Square
Following
Hot
News
Notifications
Profile
Share your thoughts
placeholder
Article
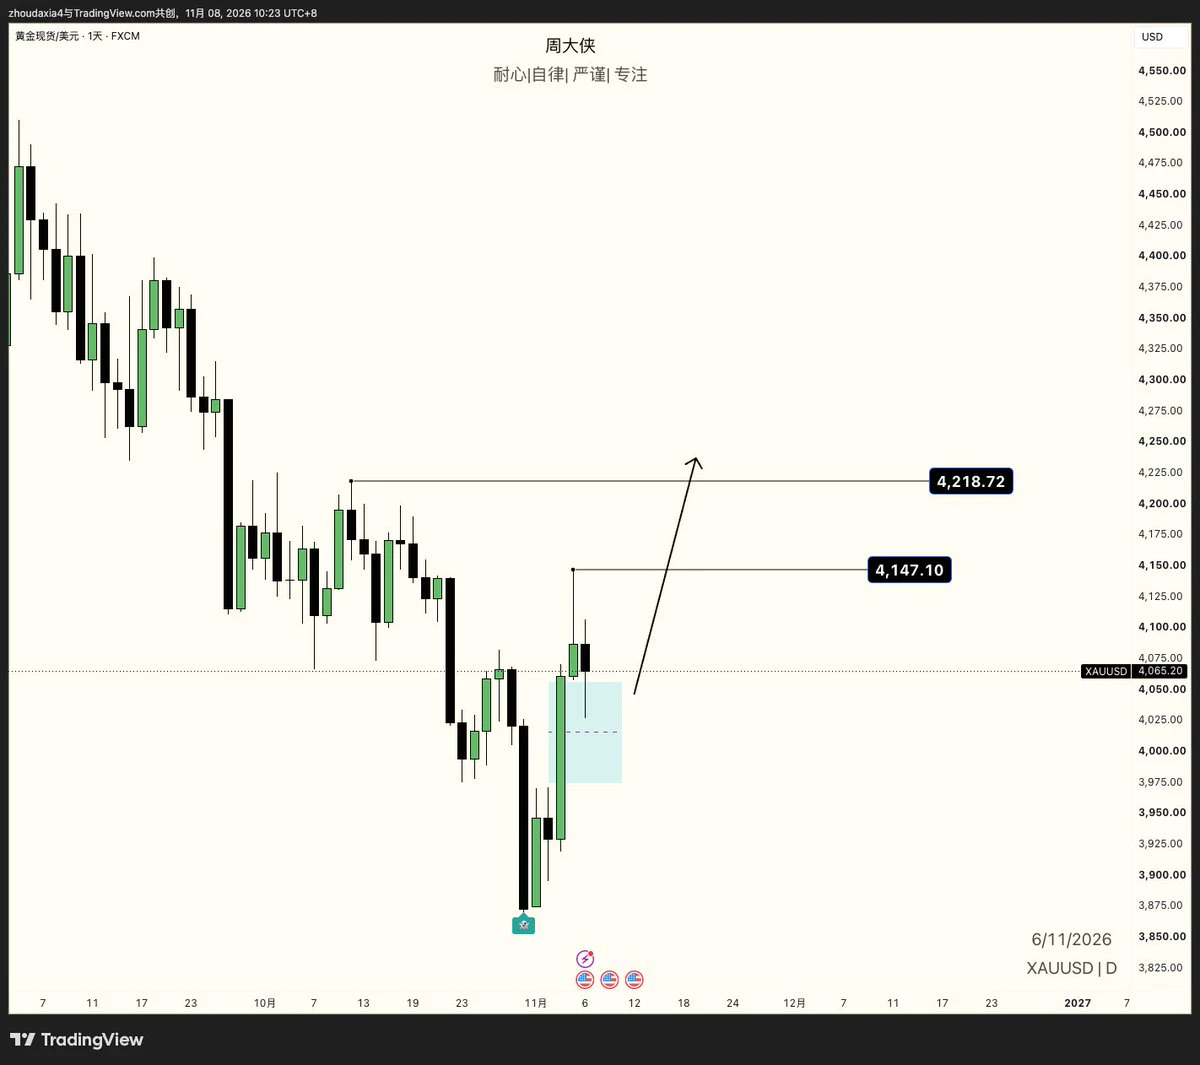
Gold daily chart bullish bias vs. weekly chart bearish bias. #XAU
post-image
GLDX-0.40%
PAXG+0.37%
XAU+0.38%
  • 1
Let's see how many fish have slipped through the cracks of nine-year compulsory education.
post-image
Trenches
ZIG
Z
bade
b
ZIG
0x8c...1145
Market Cap
$.
Change
.
24h Vol
$.
Holders
.
STONK
S
bade
b
STONK
6GmA...UNgx
Market Cap
$.
Change
.
24h Vol
$.
Holders
IDOL
I
bade
b
IDOL
0x3b...ab07
Market Cap
$.
Change
.
24h Vol
$.
Holders
.
FLOAT
F
bade
b
FLOAT
Bv1a...BMmr
Market Cap
$.
Change
.
24h Vol
$.
Holders
.
CLAUDIA
C
bade
b
CLAUDIA
2j5S...W2ZM
Market Cap
$.
Change
.
24h Vol
$.
Holders
.
#BTCETFOutflowsContinue

BTC ETF Outflows Continue: Is Institutional Demand for Bitcoin Losing Momentum?

What Is Driving the Latest Withdrawals?

Are investors losing confidence in Bitcoin, or are they simply becoming more cautious after a period of market uncertainty? This is an important question as US spot Bitcoin ETFs continue to record net outflows, raising concerns about institutional demand and the direction of the crypto market.

The latest figures show that selling pressure through Bitcoin investment funds remained significant during the first week of November 2026. However, underst
post-image
BTC-0.67%
  • 3
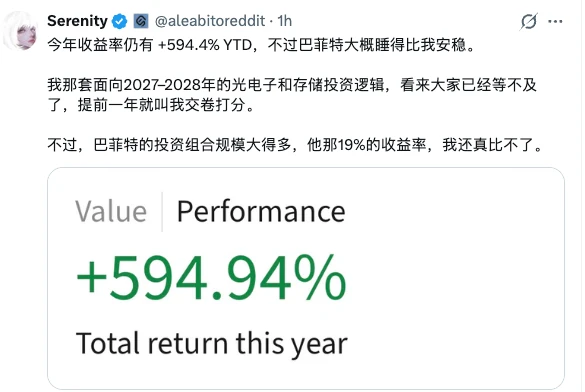
This so-called “I’m better than Buffett” comparison is absolutely shameless.
Buffett achieved 19% returns for 50 consecutive years, ultimately multiplying his assets 100-fold, 1,000-fold.
This AI Bottleneck thing—keep playing it for another year and it’ll wipe you all out to zero.
You think you can compare yourself to Buffett?
post-image
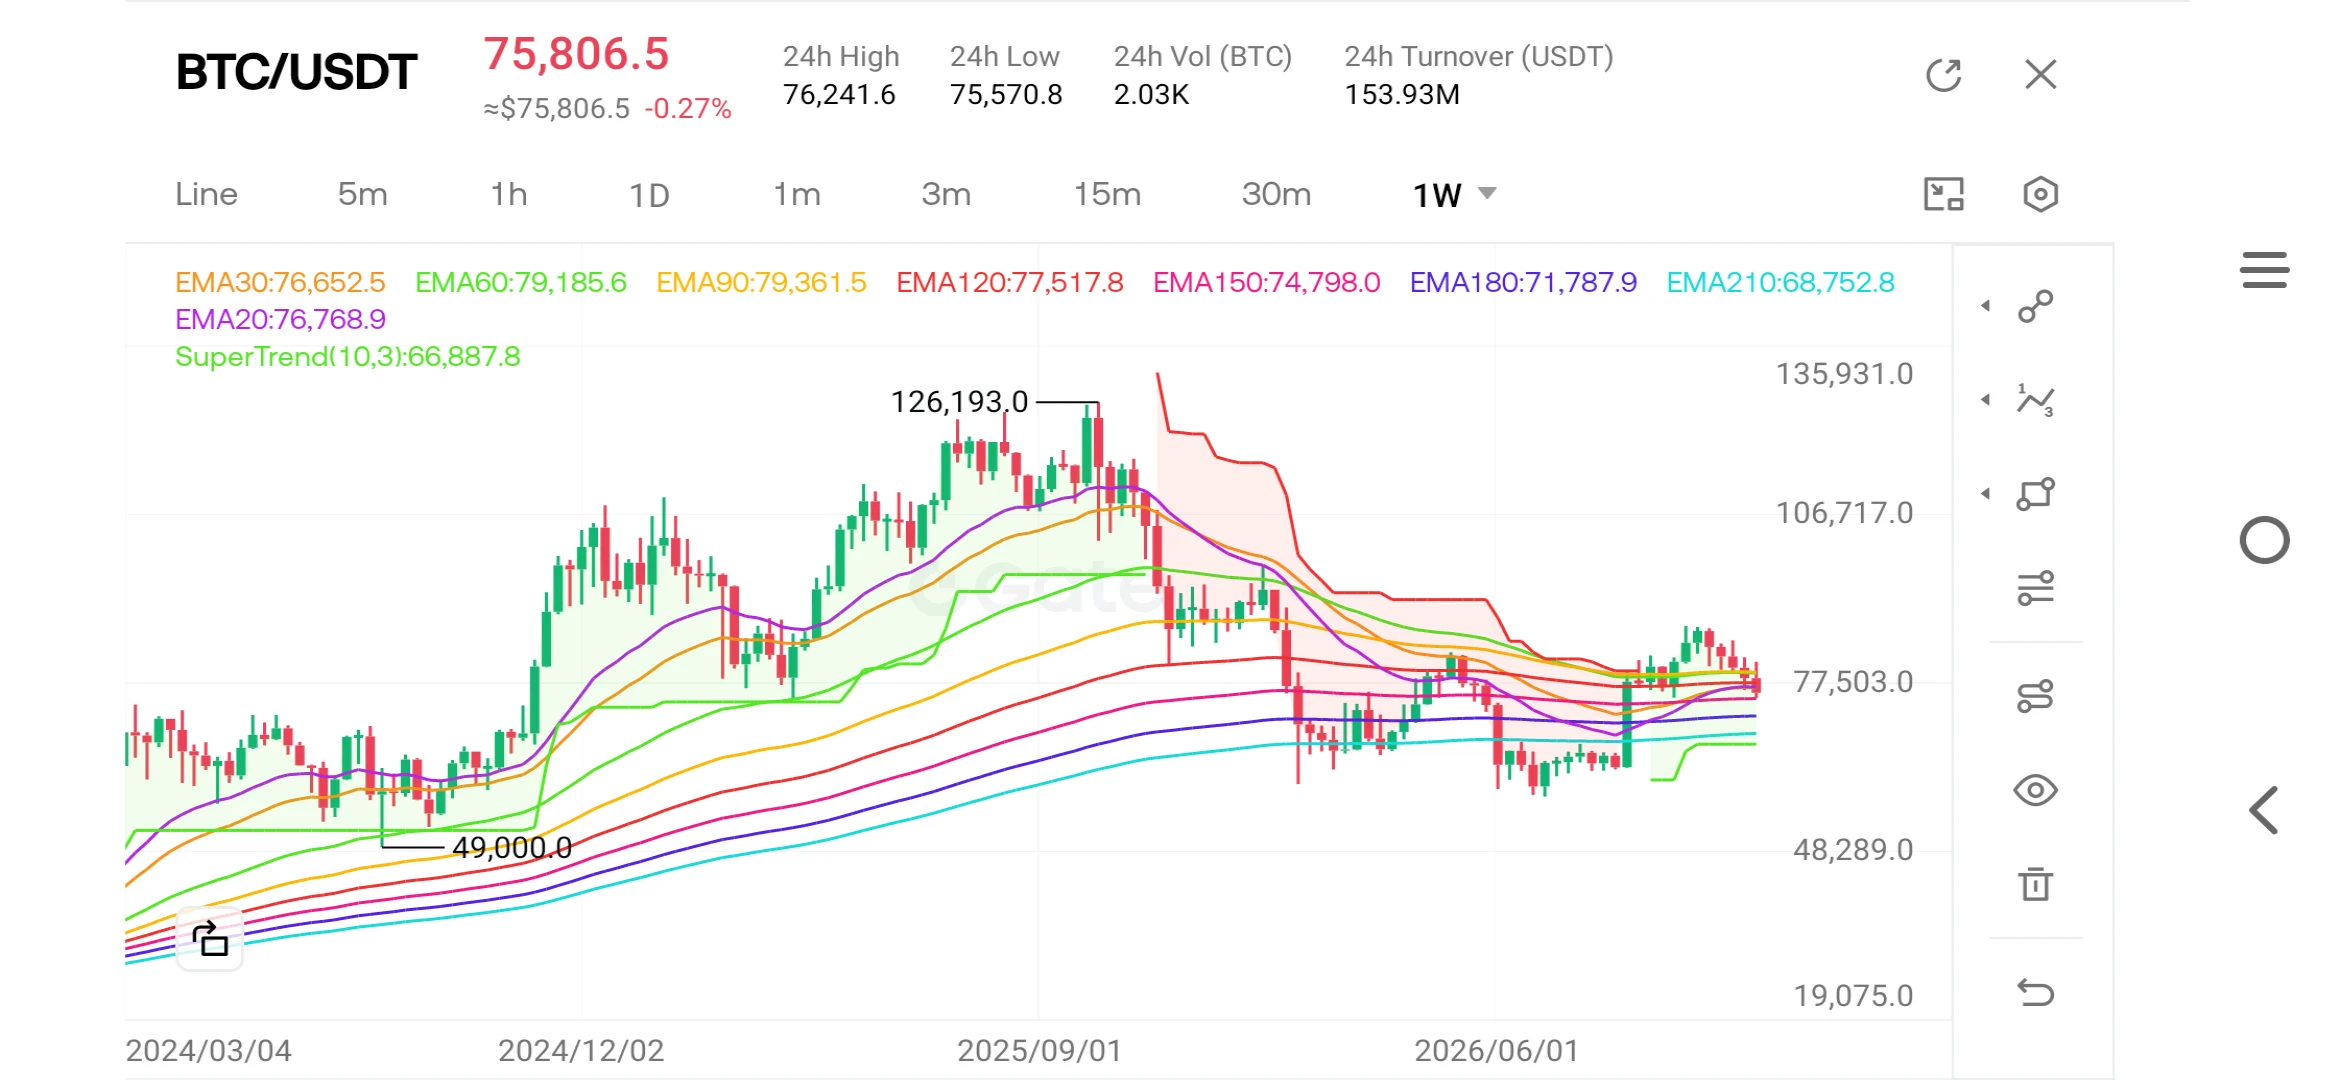
Why has the Ahr999 dropped below 0.45, and what does this signify?

As Bitcoin trades within the $75,000–$76,000 range, the Ahr999 indicator has fallen below the 0.45 threshold to approximately 0.43—a level historically identified as a "buy-the-dip" zone. It has been confirmed that previous instances where the indicator dipped below 0.45 coincided with the market bottoms seen in late 2018, early 2020, and the 2022 bear market. Furthermore, it is noted that Bitcoin is currently attempting to defend the $75,000 support level, with the market’s focus fixed on the U.S. Consumer Price Index (CPI) d
post-image
BTC-0.67%
  • 1
AI Stocks Battered, but Goldman Suddenly Turns Bullish! $125 Billion Pouring Into Data Centers—Who’s Quietly Cashing In?

AI tech stocks have just gone through a sharp correction, and while investors are busy checking whether their accounts have shrunk, Goldman is throwing the market a dose of contrarian hype: U.S. data center construction spending is projected to reach $125 billion by 2028!
Now that’s interesting: the stock market is crying out in pain, while Wall Street is still figuring out how to build more server farms.
Goldman’s bullish thesis is not complicated. Demand for computing pow
MU+4.71%
  • 1
$SOL Can it make it back to $200? This question has been asked a lot lately. First, let’s look at some real data: one trader shared a portfolio showing $SOL down 1.32% and $GIGGLE down 2.25%, yet the cumulative PnL was +1,042.83 USDT—showing that they rely not on simply holding one coin, but on timing and position management. Back to SOL itself: $200 won’t happen just because people call for it. It depends on whether on-chain activity can remain strong, whether ecosystem projects have new narratives, and whether broader market liquidity is favorable. SOL’s last rally was driven by the meme
post-image
GIGGLE-1.51%
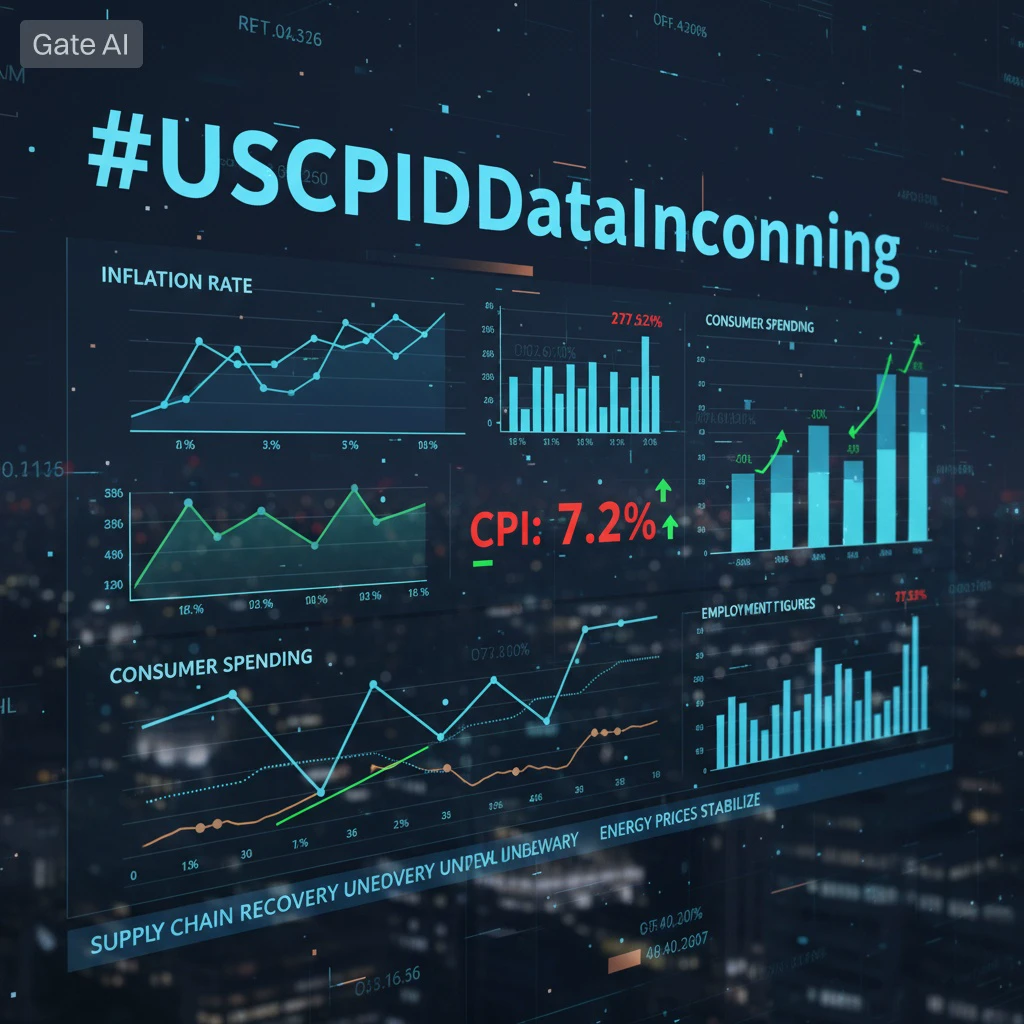
#USCPIDataIncoming #每周来晒
Unpacking the October CPI Scenarios and Monetary Crossroads

The global financial system is bracing for a high-stakes macroeconomic checkpoint as the U.S. Bureau of Labor Statistics (BLS) prepares to release its October Consumer Price Index (CPI) report on Tuesday, November 10, 2026, at 8:30 AM ET (6:30 PM Pakistan Time). Following the exceptionally robust October Nonfarm Payrolls report (+165,000 jobs, 4.1% unemployment), this inflation print serves as the ultimate decider for the Federal Reserve's final monetary policy track of the year.
Traditional equities, digita
post-image
GAS-0.57%
SPX500+0.19%
XAU+0.38%
BTC-0.67%
  • 1
Good morning, recap
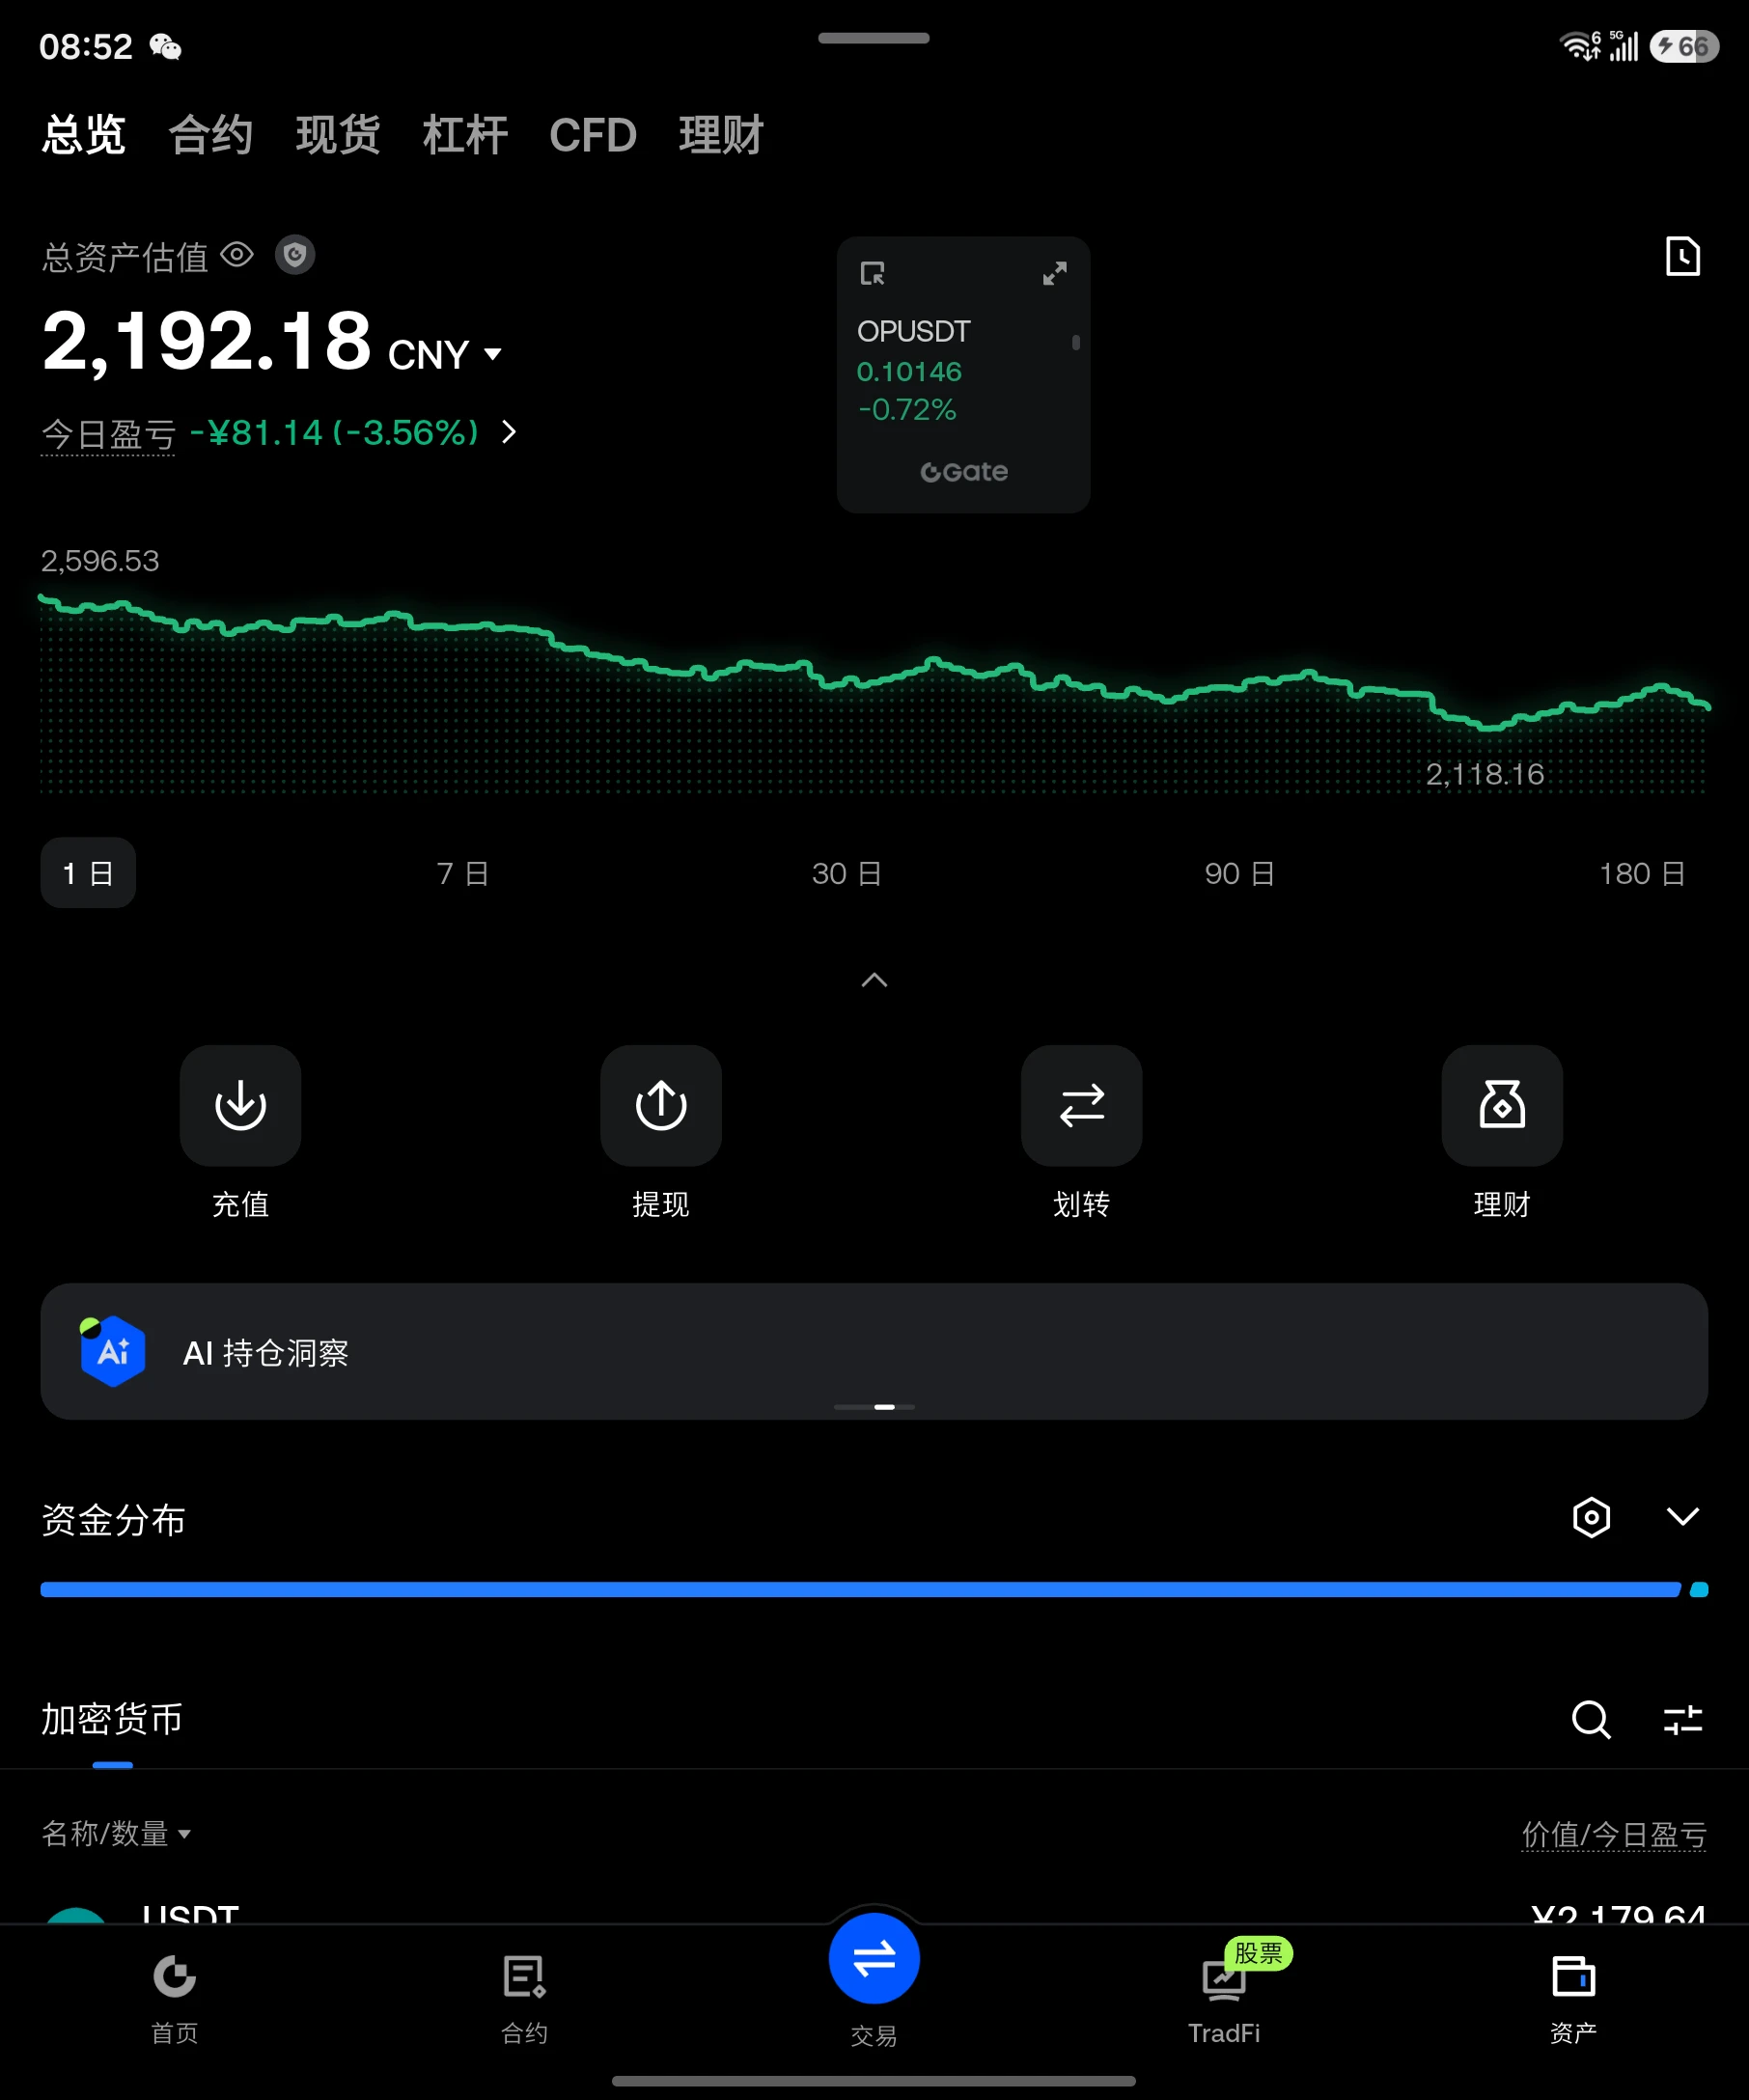
Continue holding the OP long position; the broader market, ETH, and OP are all showing a short-term bearish trend
Stay the course
Stay the course
post-image
OP-1.31%
ETH-1.26%
  • 2
Yesterday I asked Grok Bot to keep an eye on DMIT restocks, and it used up 30% of my $100 plan’s weekly quota in one day. I’m furious 😭
post-image
$UAI That hit took back the 23,000 I’d just made back in my account. Yesterday I was enjoying the view above 0.15; today it’s straight down to 0.0799, down 43.49% in 24 hours, with trading volume at 74.6M—this isn’t a pullback; it’s wiping out leveraged traders wholesale.
But after taking a loss, it’s time to get to work. I pulled the data again: the 24-hour low is 0.0766, and the current price is 0.0799, just 4% off the bottom. A trading volume of 74.6M isn’t massive for a drop this sharp, which means panic selling hasn’t fully played out, but there’s also no death signal of liquidity drying
UAI-7.58%
  • 1
In BTC trading, many people see the price break through an important resistance level and immediately chase the rally, worried they’ll miss an opportunity to profit. But experienced traders often pay attention to another important signal after a breakout: the pullback.
Why is a pullback after a breakout worth watching?
First, it helps confirm whether the breakout is valid. After the original resistance level is broken, it may turn into new support. If the price falls back to this area but doesn’t break significantly below it, that may indicate the market is reconfirming its role as support.
Se
BTC-0.67%
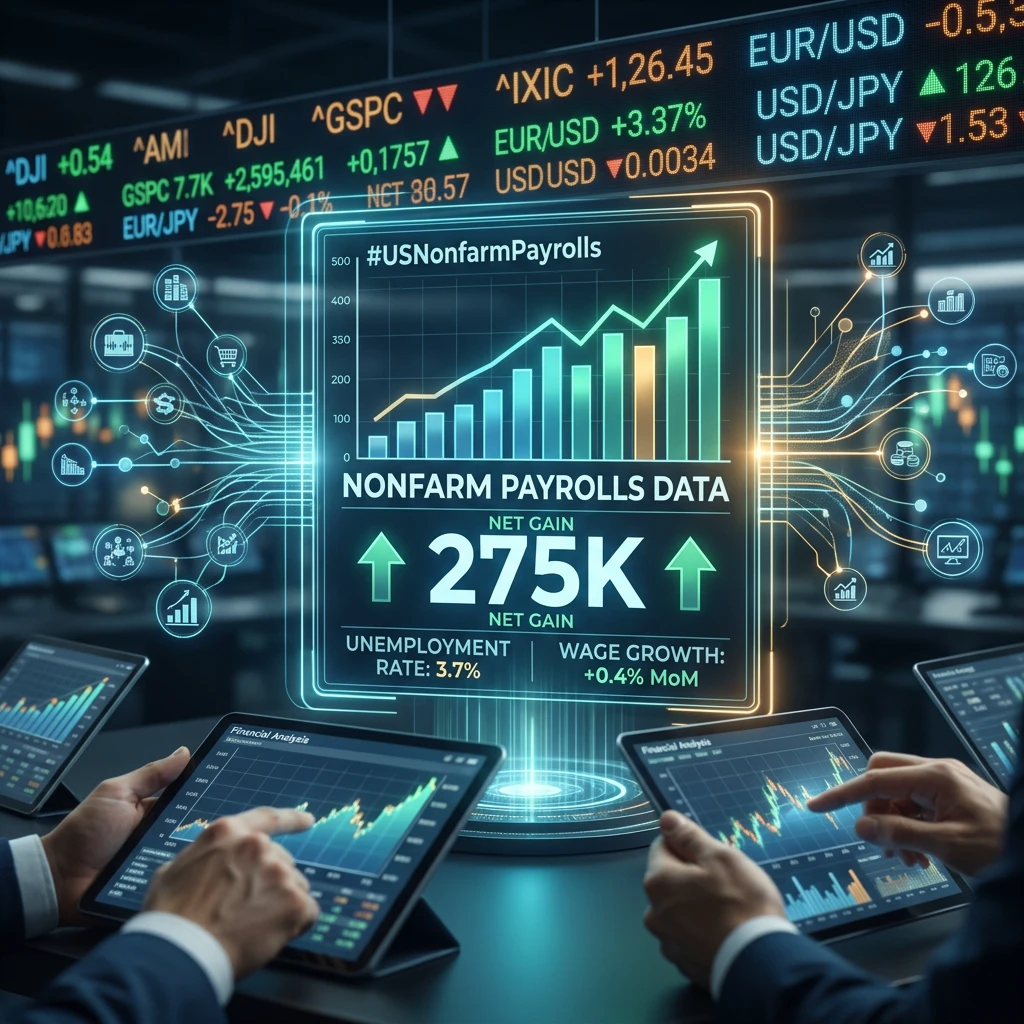
#USNonfarmPayrolls

US Nonfarm Payrolls: Is a Strong Jobs Report Always Good News for the Economy?

Q1. Does a higher number of new jobs always mean the US economy is getting stronger?

Not necessarily. This is one of the biggest misunderstandings about the US Nonfarm Payrolls (NFP) report. More jobs can signal economic strength, but the full picture depends on unemployment, wage growth, working hours, and the direction of hiring.

The October 2026 employment report offers an interesting example. It showed stronger job creation than economists expected, but some parts of the labor market stil
post-image
BTC-0.67%
🚀🚀🚀$BTC ‌$GT ‌$ETH ‌#CPI数据前瞻
post-image
BTC-0.65%
GT-2.24%
ETH-1.23%
  • 4
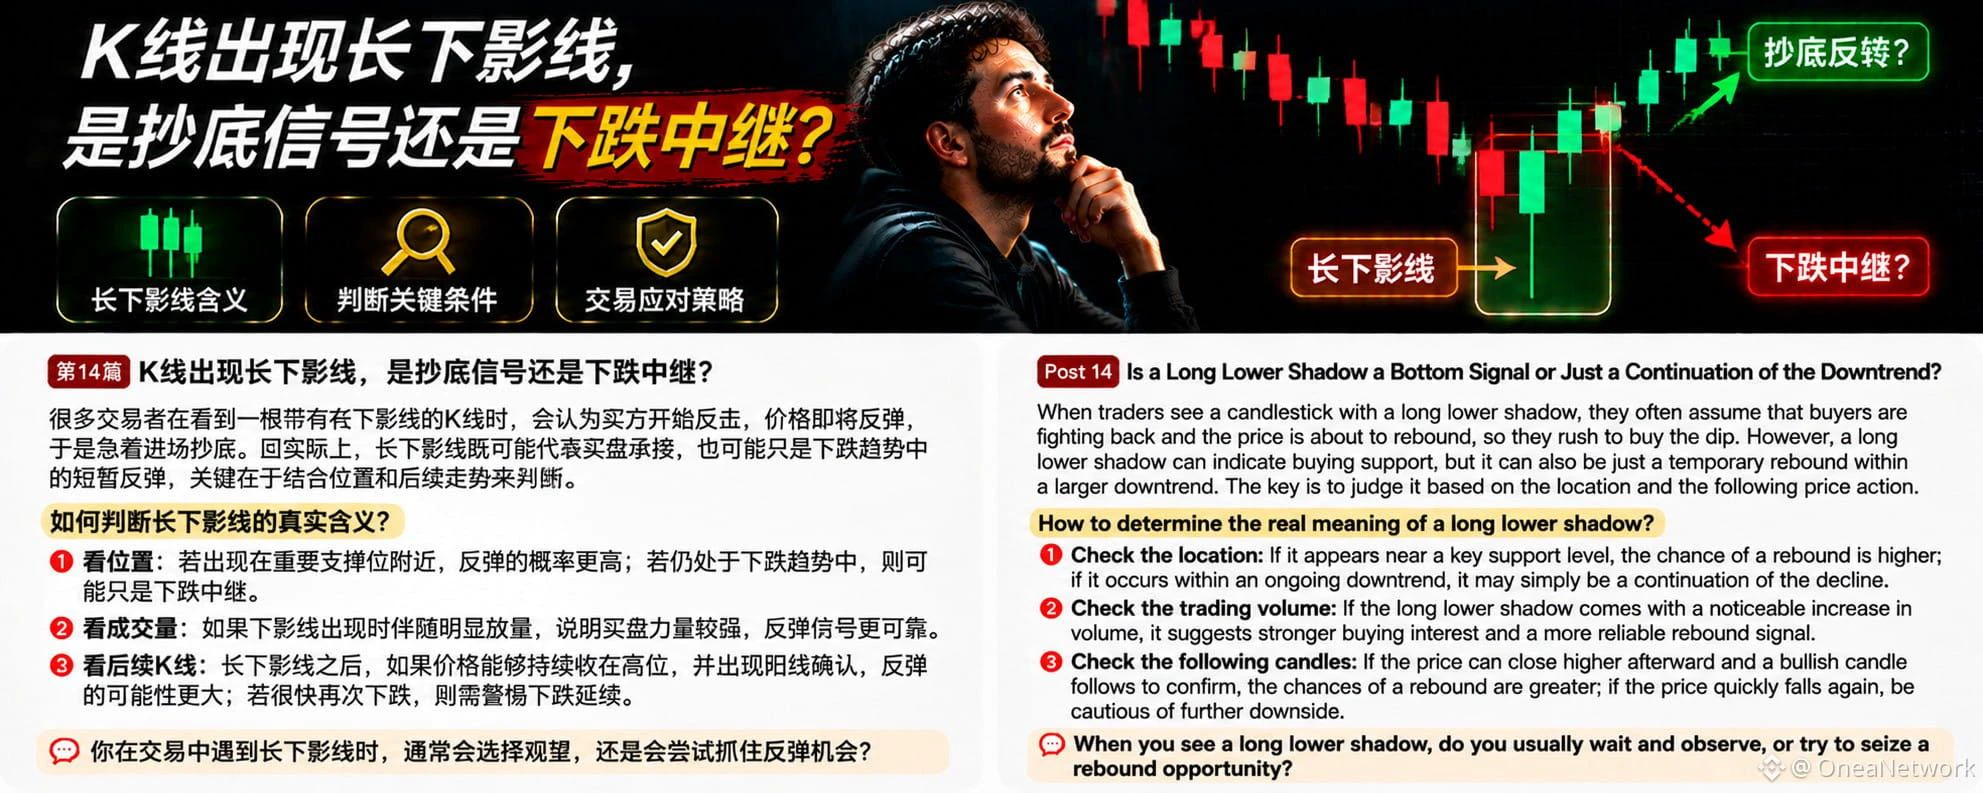
In BTC trading, many people see a candlestick with a long lower wick and assume buyers are starting to fight back and the price is about to rebound, so they rush in to buy the dip. But in reality, a long lower wick does not necessarily mean a trend reversal; it may simply be a brief bounce during a decline.
So, how should you judge?
First, look at where it appears. If a long lower wick forms near an important support level from earlier, it suggests that strong buying may have absorbed selling pressure after the price fell to this area, making the potential rebound a more meaningful signal. But
post-image
BTC-0.67%
Near market update
live-cover
LIVE1,974
Layout: Bitcoin, Ethereum, Dogecoin
live-cover
LIVE880
  • 1
#TRX

TRX Holds Near $0.32: What Is Supporting the Price, and What Could Change the Picture?

A Small Move, but What Does It Tell Us?

Imagine checking your crypto portfolio in the morning and seeing TRX slightly higher than the previous day. The price has not made a dramatic jump, but it is moving in a positive direction. Is this the beginning of a stronger recovery, or simply a period of normal market movement?

As of November 8, 2026, at 01:30 UTC, TRX/USDT was trading at $0.3205, recording a 24-hour increase of 0.8%. Its 24-hour trading volume was approximately $2.65 million USDT.

This i
post-image
TRX+0.42%
BTC-0.67%
  • 1
$ZEC I caught the falling knife at 1241, and my hands are still shaking.
Let’s start with the data—no need to comfort me yet. ZEC is currently at 1241.52, down 8.06% over 24h, with an intraday high of 1355.45 and low of 1235.21. Trading volume is 1.349 billion—it hasn’t contracted, which means panic selling is still underway. I reviewed ZEC’s price action across the past three halving cycles: after the first halving, a roughly -12% shakeout came on day 18; after the second, it was -9.8% on day 22; after the third, -8.5% on day 15. Today is exactly day 16 after this halving, with a decline of 8
ZEC+1.16%
$EPIC just remember boldly...this coin has ever reached 74.80200 once on March 1st,2021...and this coin average is supposed to be above 1 USDT and then the Total Coin Supply is only 33.60 Millions coin...so what you afraid of,...???just make it back to where this coin belong,above 1 USDT...pump it all the way to this coin is where its belong and put it back decently,which is above 1 USDT (you can check by yourself on the1M Chart,at the beginning of this coin launched/traded,the ATH was 74.80200 USDT and averaging above 1 USDT)...this coin is RWA...so please no more childish dramas,be gentle an
post-image
Load More

Join 40 M users in our growing community

⚡️ Join 40 M users in the crypto craze discussion

💬 Engage with your favorite top creators

👍 See what interests you

Trending Topics

USCPIDataIncoming

188 Views1.46k Discussing

The U.S. October CPI report will be released on November 10 at 8:30 a.m. ET. September CPI came in at 3.7% year over year, and markets will be watching closely for signs that inflation is cooling, especially in core CPI. A softer-than-expected reading could strengthen rate-cut expectations, while hotter inflation may pressure risk assets through higher Treasury yields and a stronger dollar. How do you think this CPI print will move $BTC, U.S. stocks and gold?

USAIStocksHitHard

23.2k Views3.69k Discussing

USNonfarmPayrolls

39.23k Views4.37k Discussing

View More