



Share your thoughts
placeholder
Article
📊 $CRV looking interesting.
The level to watch is $0.40–$0.45 on the weekly.
• Flip + hold ✓ → 1W 200EMA next
And if $CRV flips the 1W 200EMA into support, then $1.0–$1.4 comes into play for the med term. 📈✍️
#CRV #CRVUSDT #Curve #Alts #Crypto
post-image
CRV+10.59%
$SUSHI
SUSHI's current move has followed a “volume expansion breakout—surge and pullback” rhythm: Gate spot is quoted at 0.2511 USDT, up 32.01% over 24 hours, with approximately 536.9k USDT in trading volume; the price rose steadily from around 0.19, reached a high of 0.2839, and then pulled back for consolidation.
On the hourly chart, 0.250–0.253 is the current nearby support zone; if it breaks down, watch 0.241–0.242. To the upside, first watch the recovery strength around 0.262–0.270; if volume expands again and the price holds above this range, then monitor the previous high of 0.2839. In
post-image
SUSHI+33.87%
K-line pattern: The recent price rebounded sharply from the low of 62,508.3, reaching a high of 82,279.9, and currently stands at 79,874.2, consolidating at elevated levels. The latest candlestick has a relatively small body, with its upper shadow near the previous high, indicating selling pressure overhead.
· Technical indicators
· MACD: DIF (3,246.0) is below DEA (3,423.8), with a negative histogram value (-355.6). A death cross has formed, indicating weakening upward momentum and pullback pressure.
· KDJ: The K value is 87.3 and the D value is 86.9, both in the overbought zone (>80), in
AI
Which company has the best Code Arena WebDev AI model end of September?
OpenAI
83%1.21x
Anthropic
19%5.26x
$15.05K 24H+14 more
BTC+0.34%
ETH+1.64%
Everyone’s staring at the 1D range, but the 4h clock just struck midnight for $MU /USDT.

$MU /USDT - SHORT

Trade Plan:
Entry: 1015.04 – 1016.60
SL: 1025.51
TP1: 1008.56
TP2: 1003.71
TP3: 996.45

Why this setup?
- RSI on the 15m is already at 45.18—that’s not oversold, that’s a bull trap losing its breath.
- With ATR at 3.10 on the 1h, the move down from 1015.82 to TP1 (1008.56) is just 2.3x the average hourly range—easy prey.
- The “Armed” status means the trigger is live; we don’t need a trend flip, just a range rejection.
- Why now? Because the 1D is sideways, and sideways always
MU+0.74%
BTC ETH and DOGCOIN Market update
live-cover
LIVE175
#美国8月非农超预期 #美国8月非农超预期
August NFP Beats Expectations — Is Another Market Drop Coming?
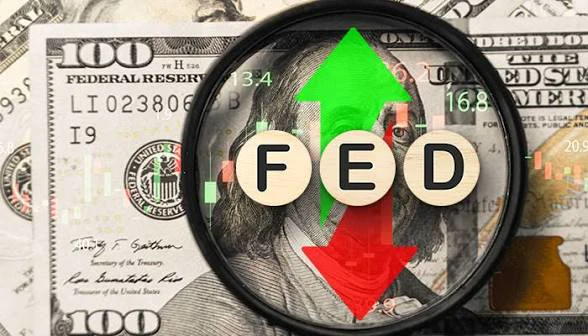
The latest U.S. Nonfarm Payrolls data has given the market another reason to reassess its expectations for the Federal Reserve.
August nonfarm payrolls increased by 162,000, coming in significantly above market expectations. The stronger-than-expected employment data immediately changed market sentiment.
BTC briefly slipped below $80,000, gold retreated, and traders started repricing expectations around the Fed's next moves.
Now the key question is:
Has the market already priced in the negative impact of st
NVDA+0.87%
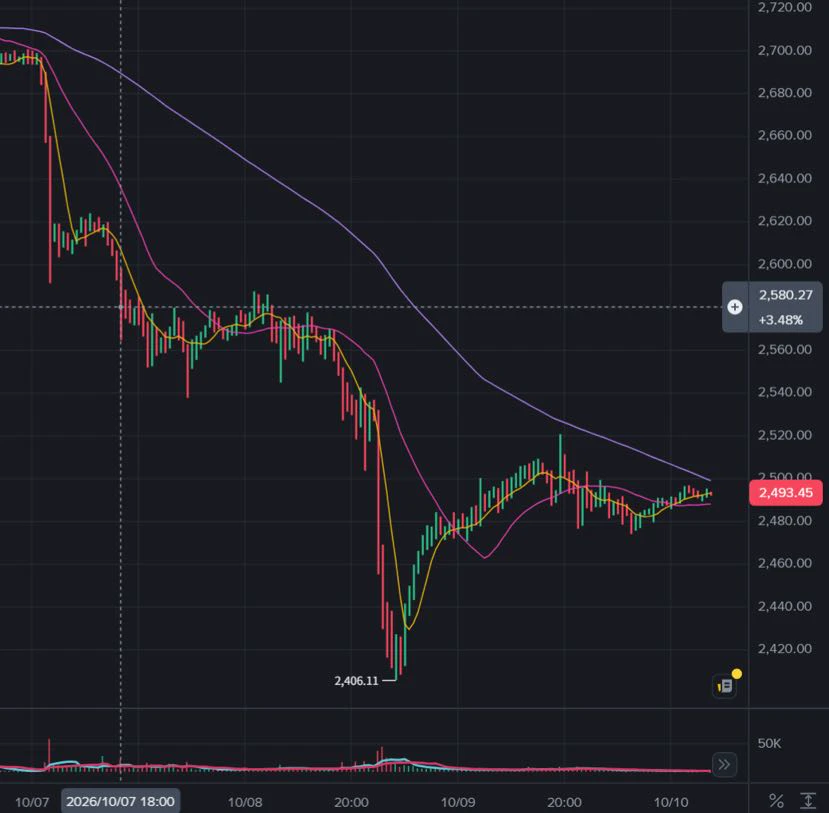
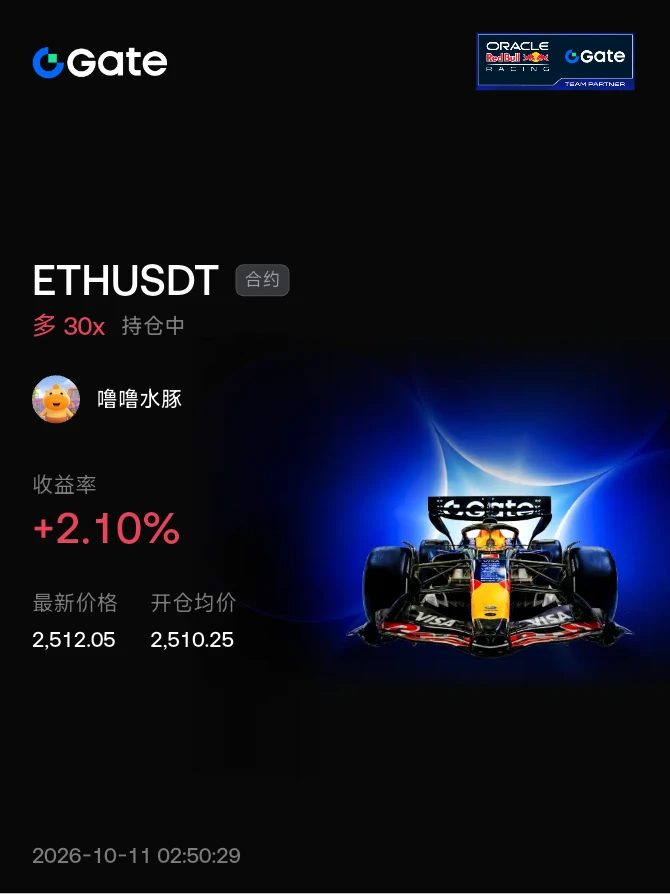
Take profit or significantly reduce the position around 2495–97 (you can try a small short at 2497–95, with a stop-loss at 2510)
post-image
🚨BREAKING: $NKE With this ULTRA RATE PATTERN!!
post-image
NKE-0.86%
After closing 70% of the position, the hardest part is not continuing to hold, but not immediately opening another trade. Before entering this $LTC long, the market had been ranging for quite some time. I gave up trying to guess the direction in advance and only followed after the price genuinely broke out of the range. The entry was not particularly early, but the structure was clear, making it easier to hold with confidence.

There was one pullback while holding the trade, which happened to test the protective level I had set. I was already prepared to be stopped out, but the price recovere
post-image
LTC+6.92%
ADA+5.51%
XRP+1.30%
No vision, can’t hold on—the profit on this move is as thin as paper, but I love it to death. The $CYS short I opened when the sell-off started in the early session at 0.4520 has now moved to 0.241, with a return of +919.15%.🎯

It wasn’t a blind short. Every upward push fell just short, while volume kept getting weaker—a classic sign of a feeble rebound. I said not to chase longs; waiting for signs of resistance before shorting is what feels good.

I just closed 70% first and moved the stop-loss on the remaining 30% to above the entry price. The prerequisite for compounding is staying aliv
post-image
CYS-3.62%
ETH+1.64%
LAB+0.79%
Everyone’s watching $MU /USDT for a breakout—but the 4H chart just whispered a secret the crowd missed.

$MU /USDT - SHORT

Trade Plan:
Entry: 1015.38 – 1017.00
SL: 1026.36
TP1: 1008.56
TP2: 1003.48
TP3: 995.86

Why this setup?
- RSI (15m) at 47.92—no momentum spike, just sideways exhaustion.
- ATR (1H) at 3.25 shows shrinking volatility, priming for a sharp squeeze lower.
- 1D trend is *range*—so we’re not chasing; we’re fading the top of the box at 1016.19.
- TP1 at 1008.56 is 0.75% away; TP2 at 1003.48 is the real magnet if 1015 support cracks.

Debate:
Is 1016 the fake ceiling be
MU+0.74%
September 6 Strategy Plan
Prioritized, for followers only
Today's operation priority ranking
Priority 1: Go long on a pullback to 2470-2473
This is today's optimal plan.
Reason: Near the 15-minute EMA50 and short-term structural support, with an easy-to-place stop-loss and the best risk-reward ratio.
Priority 2: Go long on a pullback after breaking above 2492
Suitable for a strong market.
Must wait for 15-minute candle-close confirmation; do not blindly chase highs.
Priority 3: Short on a failed push higher at 2490-2496
Suitable for a range-bound pullback.
But this is a countertrend short, so
post-image
ETH+1.64%
Omg $ZEC broke out again!🤯🚀 currently 1078!
post-image
ZEC+5.88%
Nobody’s watching PEPE’s quiet 4H reversal—but the data just whispered a nasty secret.

PEPE/USDT - SHORT

Trade Plan:
Entry: 0 – 0
SL: 0
TP1: 0
TP2: 0
TP3: 0

Why this setup?
- 1D trend is *range*, not bullish—so every spike is a short seller’s gift.
- RSI on 15m sits at 56.9, stalling before overbought—momentum is faking strength.
- Confidence 55 on SHORT means the edge is thin but real; entry is still “Waiting,” so we’re early, not late.
- Why now? Because range tops punish late longs—and this setup is 0.5% from a trap.

Debate:
If PEPE rejects this level, do you fade the breakout
PEPE+3.94%
This round’s $UNI long wasn’t the hardest trade to make, but it tested my patience the most. After entering, it didn’t immediately become profitable and kept hovering around the entry line, wearing me down. There were several times when I wanted to exit outright, but in the end I forced myself to hold on with the protective stop. The chart only gradually strengthened after the breakout, so I made an adjustment: close 70% of the position first, and move up the protective stop on the remaining 30% and continue watching.

Some people asked why I didn’t close the entire position. Handling positio
post-image
UNI+21.48%
ADA+5.51%
XRP+1.30%
morning update 🥰🌹
live-cover
LIVE1,930
Everyone's watching SUI bounce, but the 4h chart is quietly screaming something else.

$SUI /USDT - SHORT

Trade Plan:
Entry: 0.7921 – 0.7973
SL: 0.8192
TP1: 0.7763
TP2: 0.7640
TP3: 0.7456

Why this setup?
Why now? The 1D trend is *range*, not uptrend — so this 0.7947 reference is a midpoint trap, not a launchpad.
- RSI 15m at 42.98: momentum is fading, not flipping bullish.
- ATR 1h is tight (0.0102): low volatility favors a grind down, not a breakout.
- Short targets are stacked: TP1 0.7763, TP2 0.7640 — that's a 3.8% drop from current entry if range lows hold.
Bias is SHORT at 55
SUI+5.33%
$SKYAI /USDT is setting up for a move that could invalidate 95% of traders' hopes.

$SKYAI /USDT - SHORT

Trade Plan:
Entry: 0.06031 – 0.06093
SL: 0.06363
TP1: 0.05836
TP2: 0.05686
TP3: 0.05460

Why this setup?
Why now? The 4h bias is SHORT at 95% confidence, and the daily trend is bearish—this isn’t a guess. Price refs at 0.06062, with immediate downside targets staring at TP1 (0.05836) and TP2 (0.05686). The 15m RSI (54.35) shows only a weak bounce, not a reversal. ATR (0.001254) is tight, meaning the breakout is coiling—not stalling. If we lose 0.06031, the path to invalidation (0.05821)
SKYAI+5.85%
After the previous rebound peaked at 80200, it failed to break above the 80800‑81200 resistance zone and formed a top fractal on the lower timeframe, triggering a pullback;
2. The market has now returned to the previous consolidation center (79700‑80000), and the 30-minute timeframe has shifted from a “strong rebound” to a consolidation mode;
3. Structural assessment: The pullback from 82000 has not truly ended yet; this is merely an extension of the consolidation center, and two possible paths remain.
Path 1 (relatively strong)
This consolidation does not break down; a new bottom fractal form
post-image
BTC+0.34%
Load More

Join 40 M users in our growing community

⚡️ Join 40 M users in the crypto craze discussion

💬 Engage with your favorite top creators

👍 See what interests you

View More