Square
Following
Hot
News
Notifications
Profile
Share your thoughts
placeholder
Article
The sky is falling!!!
How did Dwayne Johnson get so skinny?
What happened?
In the crypto market, many traders see BTC trading volume suddenly surge and assume the price is about to rise. But sometimes, volume increases significantly while the price fails to rise and instead falls. Why is that?

First, it's important to understand that trading volume represents market activity, not simply buying pressure. Every trade has both a buyer and a seller, so a surge in volume doesn't necessarily mean the price will rise.

First, rising prices on high volume. If the price continues to rise while volume increases, it suggests market participation is growing and buyers may be ta
post-image
BTC-0.67%
Trenches
mihao
m
bade
b
mihao
4Cxj...pump
Market Cap
$.
Change
.
24h Vol
$.
Holders
.
FOOD
F
bade
b
FOOD
FTu5...pump
Market Cap
$.
Change
.
24h Vol
$.
Holders
.
IDOL
I
bade
b
IDOL
0x3b...ab07
Market Cap
$.
Change
.
24h Vol
$.
Holders
.
Sakura
S
bade
b
Sakura
9sFG...pump
Market Cap
$.
Change
.
24h Vol
$.
Holders
.
AGT
A
bade
b
AGT
0x5d...e274
Market Cap
$.
Change
.
24h Vol
$.
Holders
.
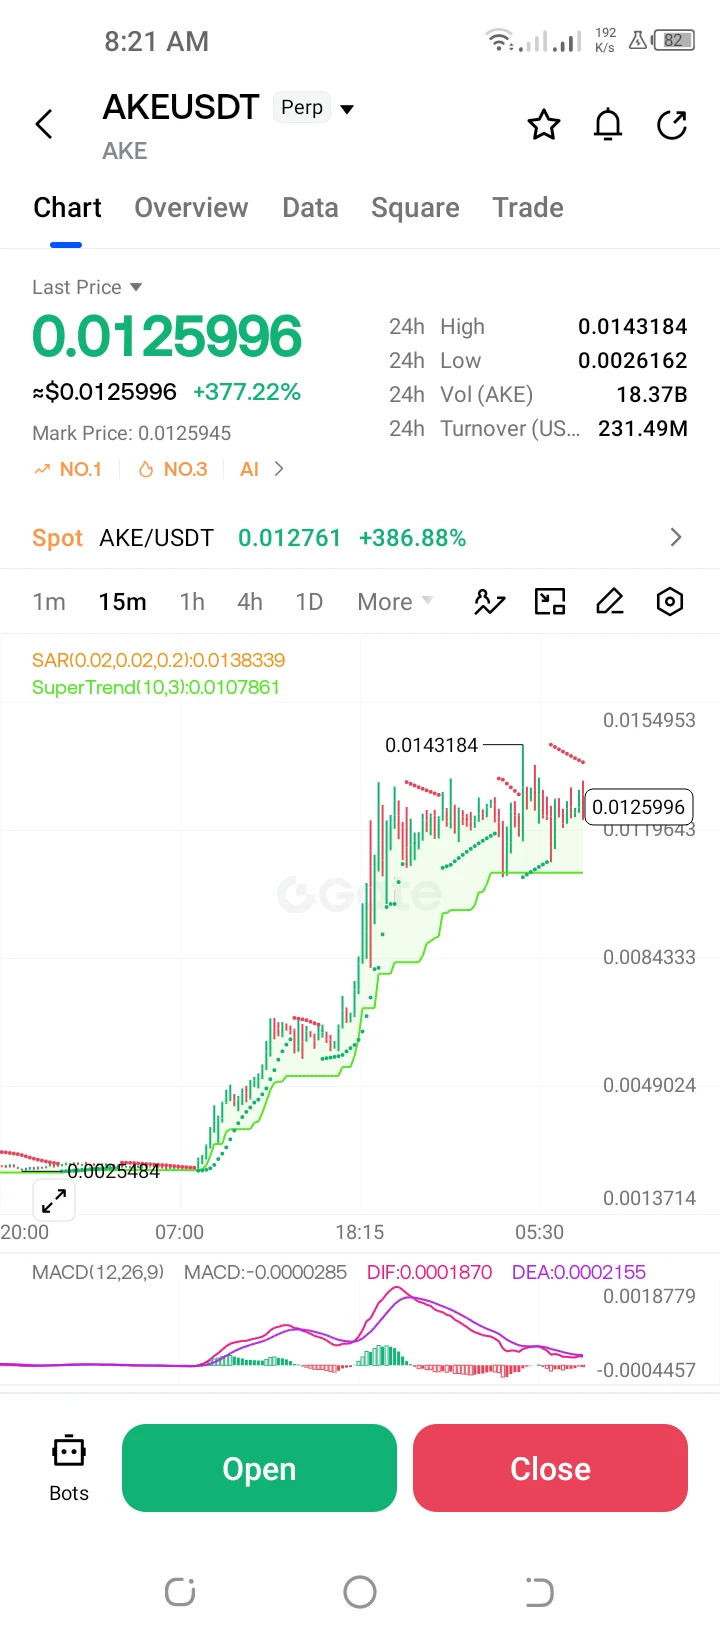
**$AKE /USDT Perp – "Hyper-Parabolic Extension – Long"**
Trading Plan Long $AKE
Entry: 0.0125996
SL: 0.0107861
TP1: 0.0143184
TP2: 0.0154953
AKE is up an astronomical +377.22%. MACD remains highly elevated. Targeting a retest of the 0.0143184 high. Use extreme caution and very tight risk management due to parabolic volatility.
#ShareWeekly.
post-image
AKE+6.39%
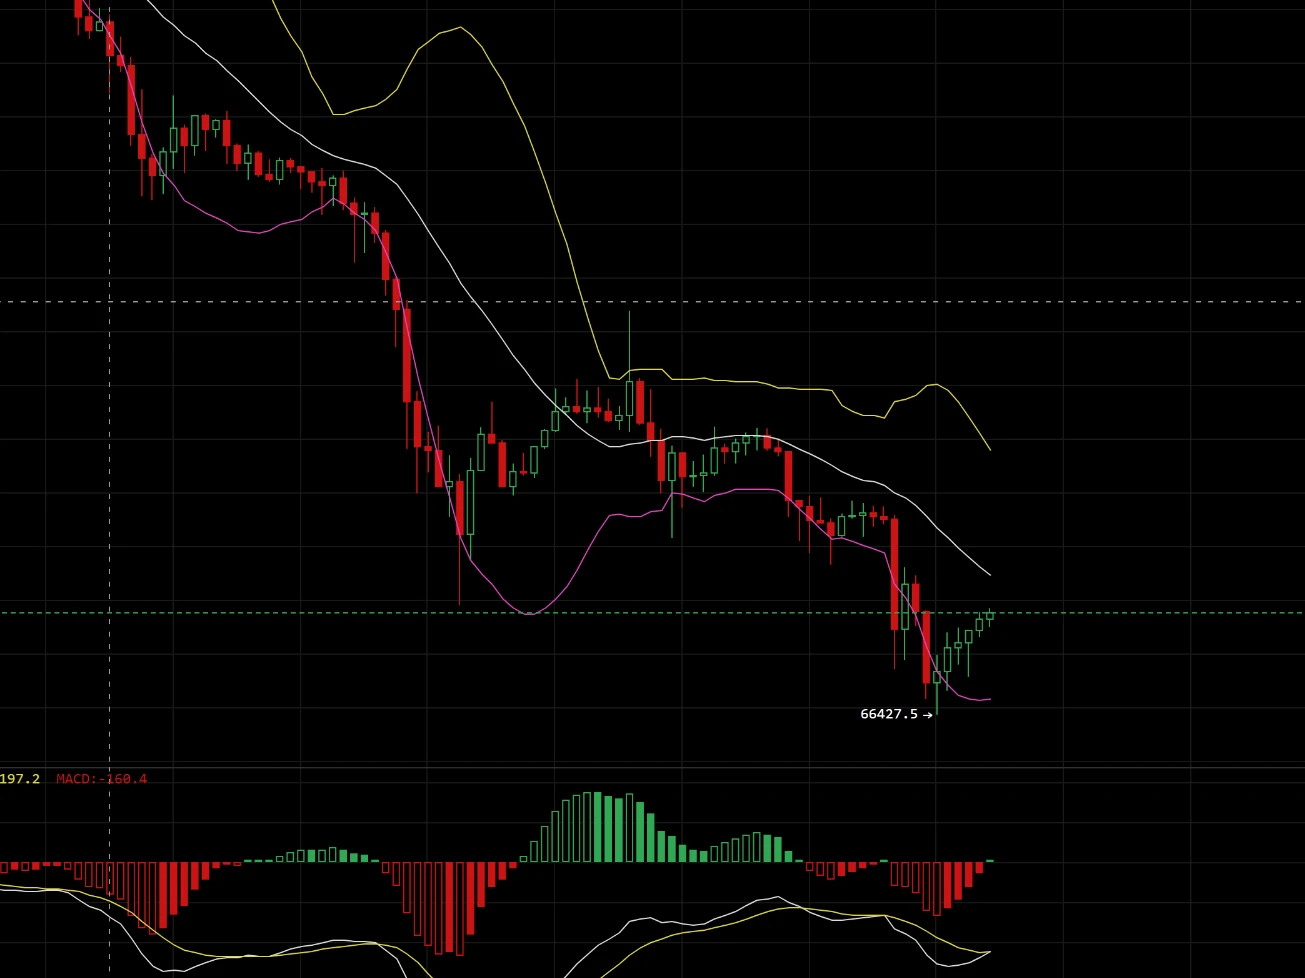
11.14 BTC Trade Setup

The BTC chart is in a clear bearish trend, with the Bollinger Bands opening and diverging downward. Price is generally trading below the middle band, and the complete downward structure shows both highs and lows moving lower. After testing an interim low of 66427, price began a weak technical rebound. The MACD formed a bullish crossover below the zero line, but rebound momentum is limited. Overall, the market remains bearish, and price will likely resume its decline after facing resistance on the rebound.

Entry zone: Lightly short around 68500 (key resistance at the Bol
post-image
BTC-0.65%
Newton could never have emerged in China
After all, if Newton had solicited a prostitute
all his laws would have to be taken down
post-image
Is BTC Suitable for Dollar-Cost Averaging? Use Time for a More Measured Investment Pace!

In the cryptocurrency market, many people hope to buy at the bottom and sell at the top. But in reality, even experienced investors find it difficult to accurately predict every market turn. Some make a lump-sum purchase and then face a major drawdown, while others keep waiting for a lower price and ultimately miss a long-term rally.

So, is BTC suitable for dollar-cost averaging?

First, it reduces the difficulty of timing the market. The biggest feature of dollar-cost averaging is investing in installme
post-image
BTC-0.67%
In cryptocurrency trading, a very common phenomenon is that many people are always in a hurry to close their positions when they’re making a profit, but once they’re at a loss, they’re unwilling to cut it.

Why does this happen?

First, when people are making a profit, they’re afraid of losing the gains they’ve already made. When the price pulls back slightly, they worry the trend is reversing, so they sell early. As a result, trades that could have earned much more end up making only a little.

Second, when they’re at a loss, people are often unwilling to admit that their judgment may have be
post-image
Reviewing my live BTC and ETH trading strategies over the past two weeks: 43 trades, 38 profitable, for an overall win rate of 88.4%.

BTC gained a cumulative 19,901.9 points, while ETH gained a cumulative 833.2 points.

The biggest change over these two weeks was that my trading approach followed the market.

In the first week, the market still offered clear opportunities amid volatility and rebounds. I traded both long and short, followed price action, and didn’t pass up opportunities.

By the second week, BTC and ETH began weakening steadily. Rebounds grew increasingly weaker, and overall h
BTC-0.65%
ETH-1.23%
Bitcoin Breaks Below $69,000 as Selloff Sets New Lows
Bitcoin fell to $83,000 as the crypto selloff entered its third day. Ether, XRP, and SOL also hit four-week lows on Coinbase, while bullish bets accounted for most tracked liquidations.
⚠️ Personal market analysis only. NFA — manage risk and DYOR.
Educational content, not investment advice or a recommendation to buy, sell, deposit, or withdraw any asset. No paid promotion or referral/affiliate links.
post-image
BTC-0.65%
XRP-1.15%
SOL-0.77%
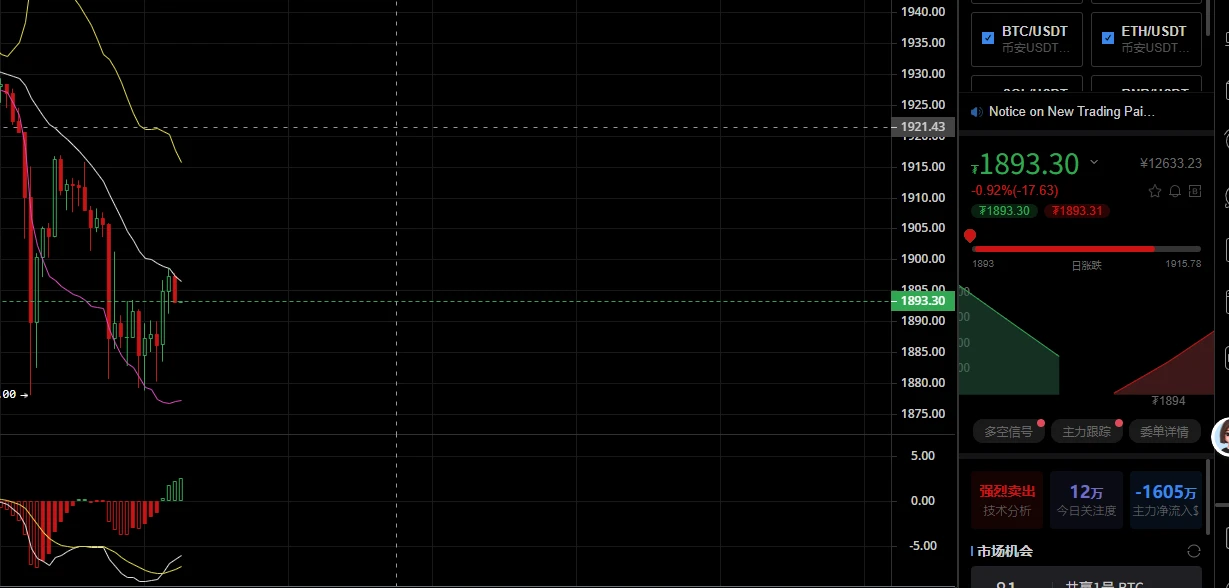
11.14 ETH Trade Setup

Entry (two strategies)

- Aggressive short: 1890–1895 range, provided price fails to hold above 1900, rebounds weakly, and closes with a weak candle; abandon this short attempt if it holds above 1900.
- Conservative short (preferred): Wait for a rebound to the 1915–1921 resistance zone, then enter after signs of a stalled rally, a long upper wick, or a bearish top fractal. This offers a more favorable risk/reward ratio.

Stop-loss

- Aggressive position: Set the stop at 1925. A decisive break above this resistance invalidates the short-term bearish thesis; exit.
- Conse
post-image
ETH-1.23%
  • 1
Everyone, watch out for this person. They’ll maliciously report you and mess with your account.
post-image
BTC has been moving sideways for three days, with the price fluctuating within a range. Many traders are starting to feel anxious: should they go long or short?

In fact, the easiest mistake to make in a sideways market is predicting the direction of a breakout in advance.

There are three signals to watch when assessing a breakout.

First, trading volume. When the price approaches the top of the range, a sustained increase in trading volume indicates that market participation is rising. But higher volume alone does not mean the price will necessarily rise; you also need to watch whether the p
BTC-0.67%
A former FBI agent admitted stealing $2.47 million in cryptocurrency. He could face up to 20 years i
live-cover
LIVE1,408
A former FBI agent admitted stealing $2.47 million in cryptocurrency. He could face up to 20 years i
live-cover
LIVE1,355
How much should you lose on a single trade? Control risk systematically to achieve stable long-term profits!

In crypto futures trading, many people spend every day studying when BTC will rise or fall, but rarely take the time to calculate one thing: if this trade goes wrong, how much of a loss can they actually afford?

In reality, over the long term, predicting market direction is only part of the equation. Risk management is what determines whether an account can survive over time.

First, set your risk per trade in advance. You can use 1% of your account balance as your risk budget for a s
post-image
BTC-0.65%
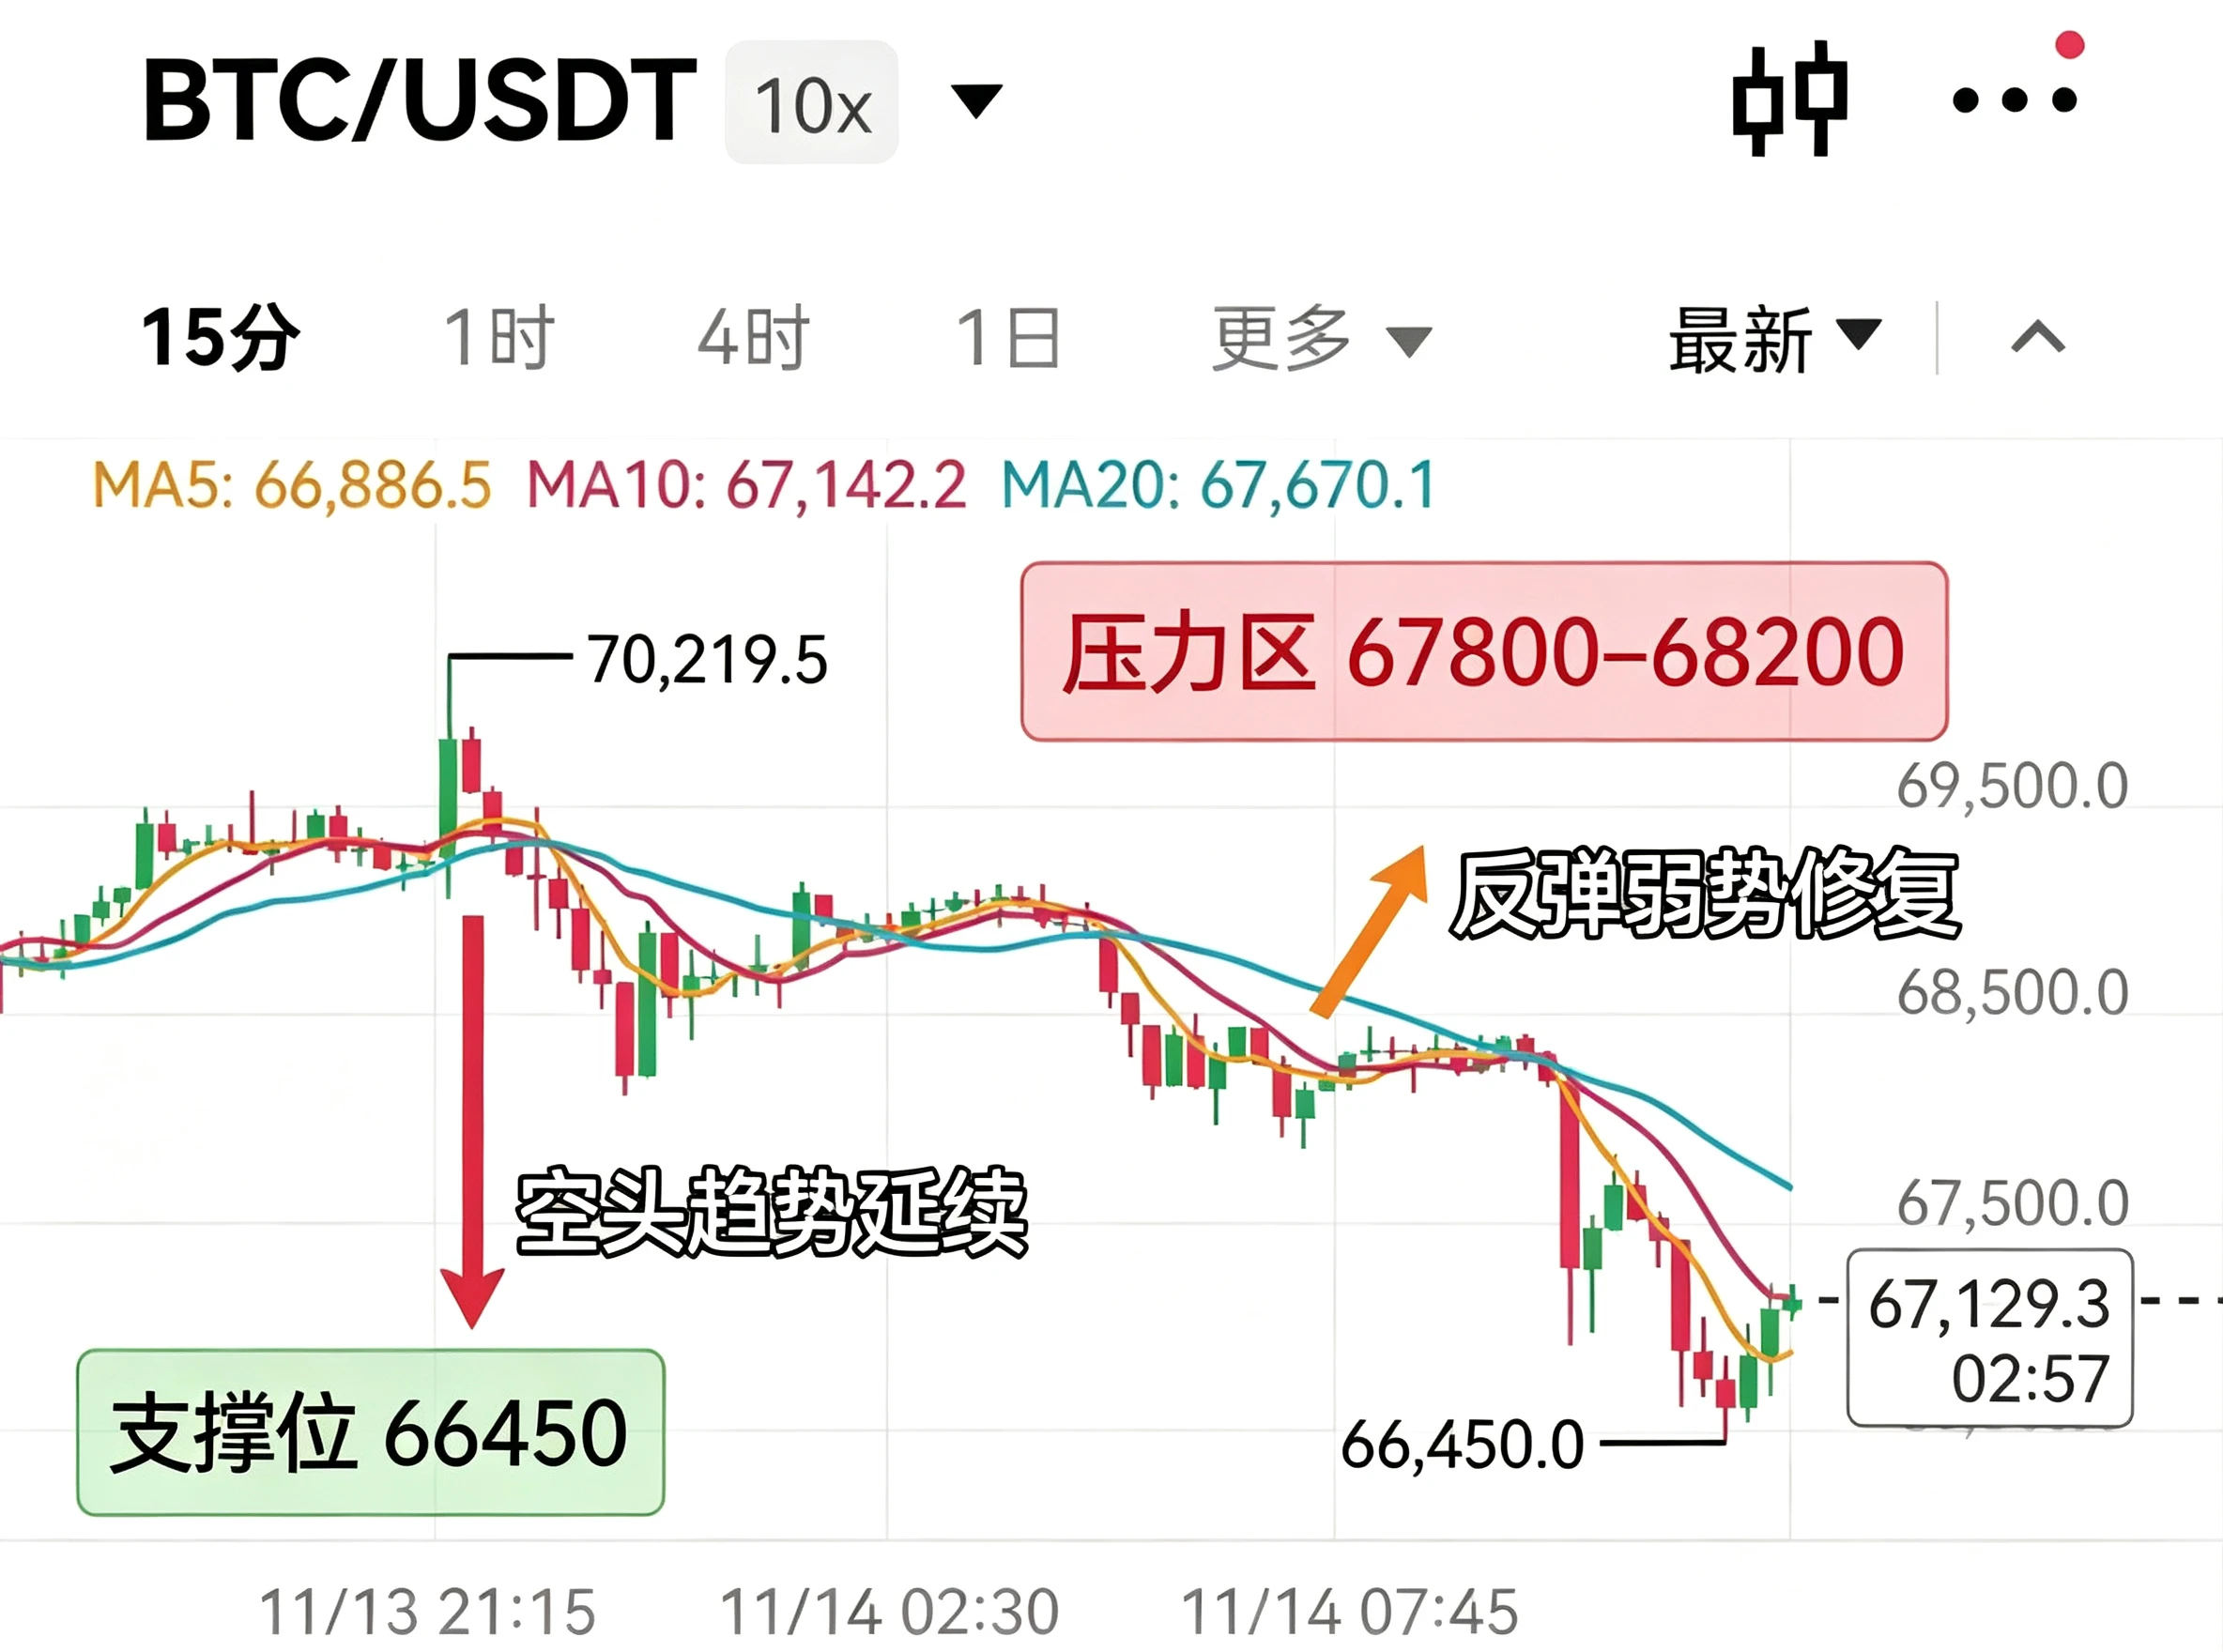
11.14 BTC Outlook #BTC
Prioritize shorts: enter around 678-682, stop at 689

BTC’s downtrend continues, and the rebound is a weak recovery. Resistance is at 67800-68200, with support at 66450. Prioritize shorting at higher levels; don’t blindly buy the dip. Risk management comes first. #BTC
post-image
BTC-0.67%
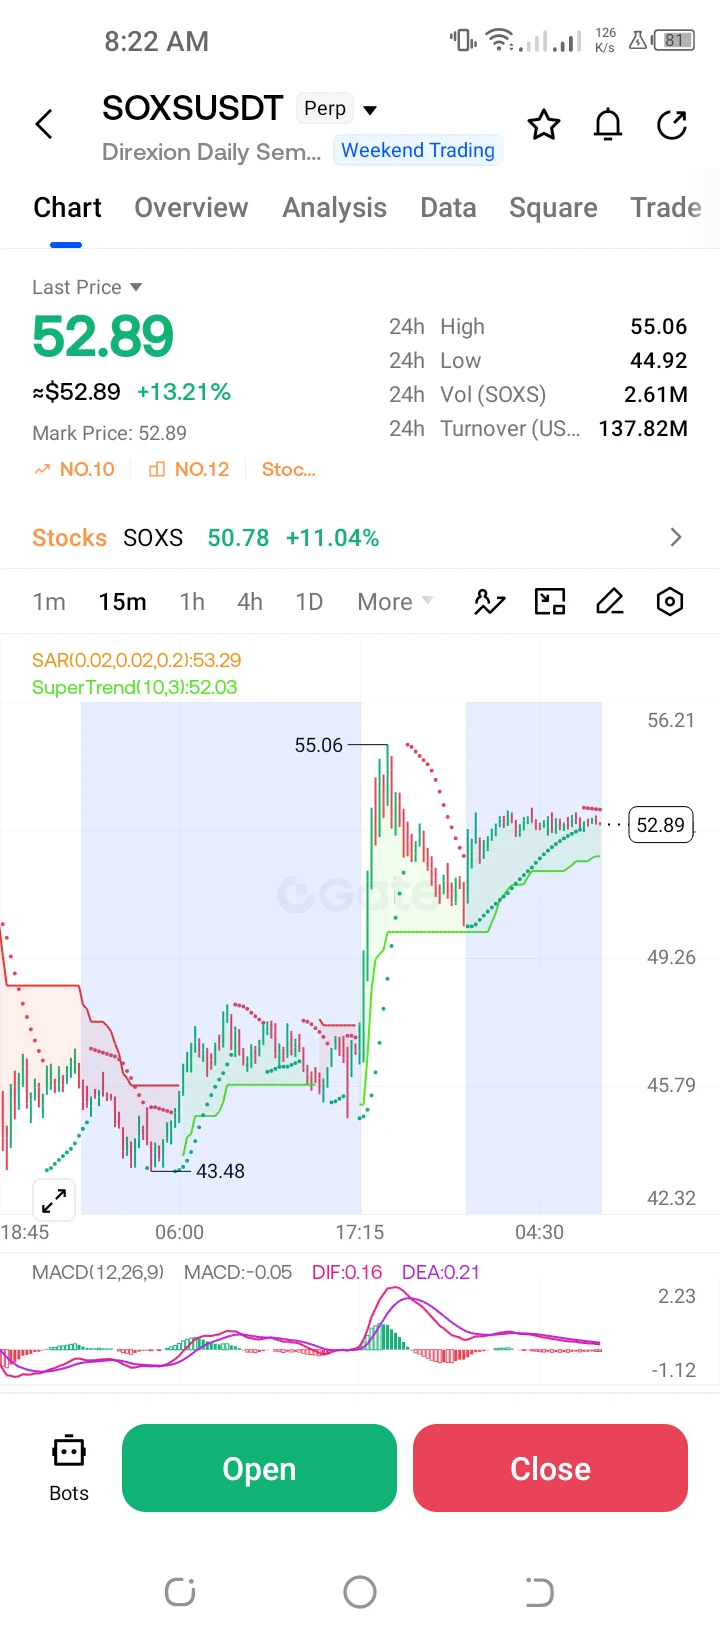
**$SOXS /USDT Perp – "Volatile Rebound – Long"**
Trading Plan Long $SOXS
Entry: 52.89
SL: 49.26
TP1: 55.06
TP2: 56.21
SOXS is up +13.21% after a massive bounce from the 43.48 low. MACD is cooling off but holding high; targeting a retest of the 55.06 local high.
#ShareWeekly.
post-image
SOXS+1.46%
$AKE If everyone shorts and then sells off together, do you think the market maker will absorb it?

Daydreaming
post-image
AKE+6.07%
  • 1
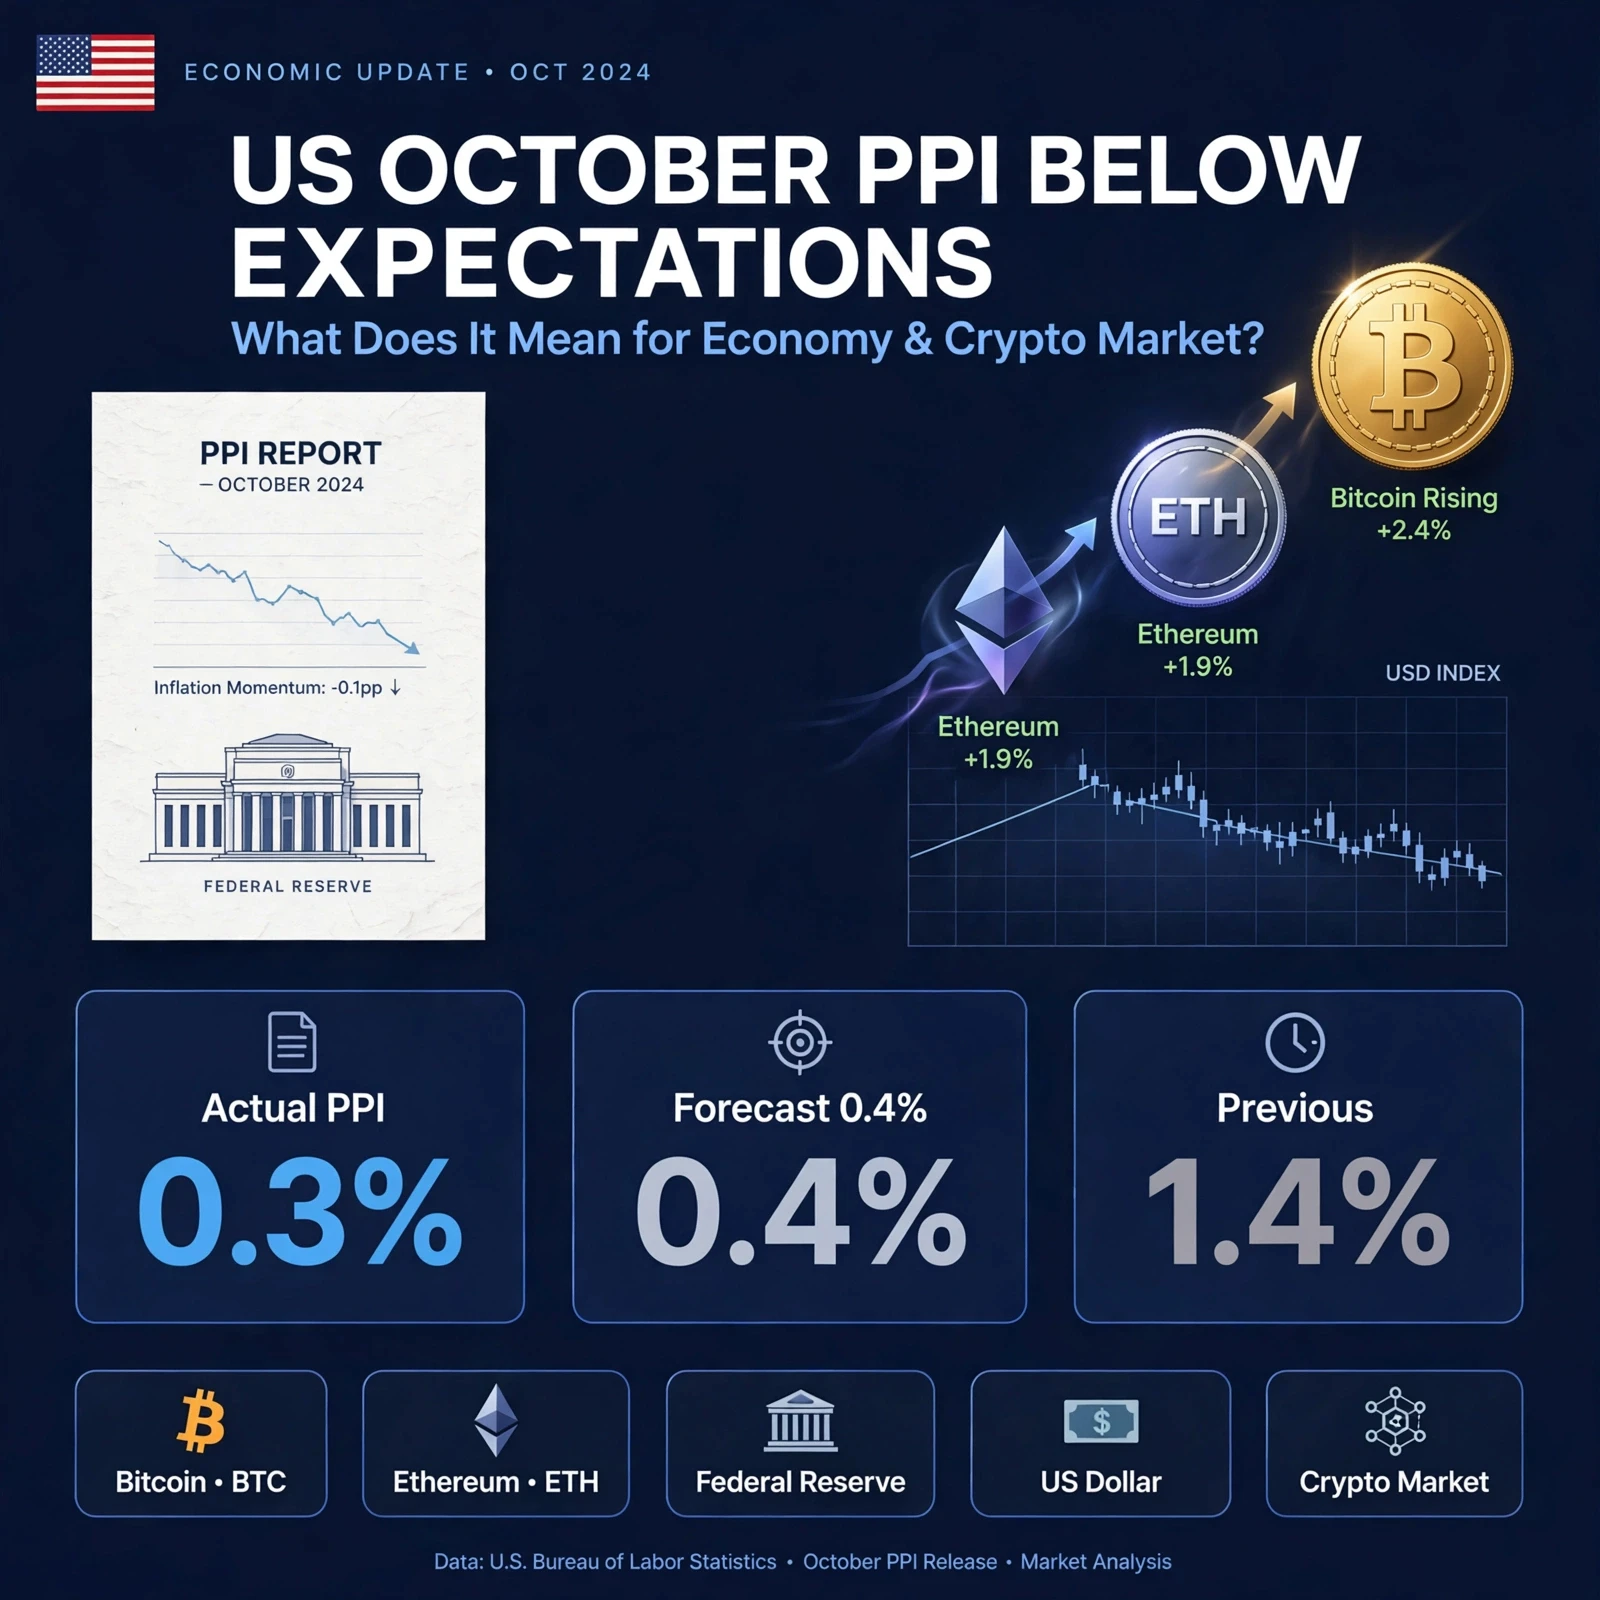
#USOctoberPPIBelowExpectations 🇺🇸 US October PPI Comes in Below Expectations: What Does It Mean for the Economy and Crypto Market?

The latest US Producer Price Index (PPI) report has delivered a slightly better-than-expected result, bringing fresh attention to inflation, Federal Reserve policy, financial markets, and cryptocurrency investors.

According to the October 2026 report, US PPI increased by 0.3% month-over-month, below economists' expectations of 0.4%. This is also a significant slowdown compared with September's revised 1.4% increase.

📊 Key Economic Highlights:

🔹 Actual PPI:
post-image
BTC-0.67%
ETH-1.26%
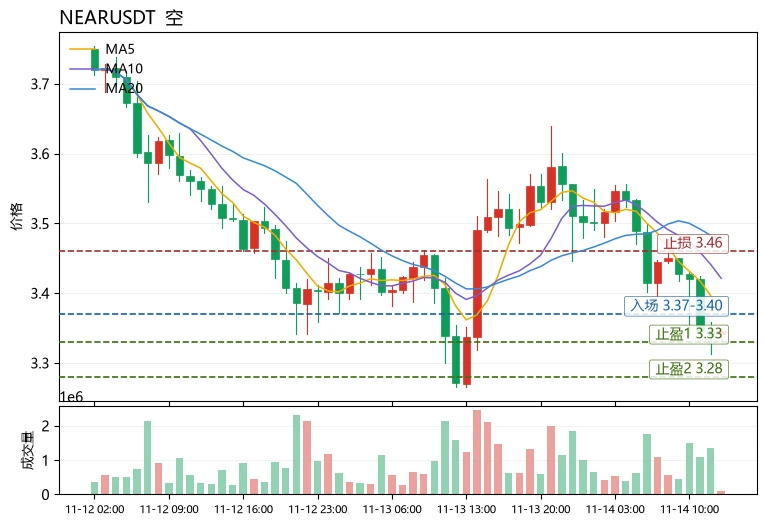
$NEAR Current price: 3.347, up just 1.86% in 24h but still below MA5=3.376 and MA20=3.47555. RSI=35.8 and the MACD histogram at -0.01868 remain bearish. The 30-candle range is 11.18%, while the Fear and Greed Index is only 13—extreme fear combined with a positive funding rate of +0.0100% shows that bulls are still paying to hold positions in a weak market. This is a typical weak-rebound structure, not a reversal. View: bearish bias; use rebounds as opportunities to reduce positions.
Entry reference: 3.37–3.40 (near MA5 resistance and below the Bollinger middle band). Take profit 1: 3.33 (near
post-image
INTCB
INTCBINTEL
Four.meme
MC:$3.22KHolders:4
0.16%
NEAR+1.17%
ZRO-2.59%
Load More

Join 40 M users in our growing community

⚡️ Join 40 M users in the crypto craze discussion

💬 Engage with your favorite top creators

👍 See what interests you

Trending Topics

GateIPOAccessAnthropic

303.4K Views2.8K Discussing

Gate IPO Access Phase 3 features Anthropic (ANT), with USDT subscription interest starting from 100 USDT. Successful allocations will be delivered as real shares to Gate Stock Accounts. Indicative price: $70–$78/share Subscription: Nov 12–17 (UTC+8) Allocation is not guaranteed. Please manage risk accordingly.

Dr.HanOxfordUnionSpeech

147K Views581 Discussing

USOctoberPPIBelowExpectations

460.5K Views1.4K Discussing

View More