Square
Following
Hot
News
Profile
Share your thoughts
placeholder
Article
#Meta暴涨到暴跌 Meta’s Thursday sell-off in both stocks and bonds was the result of the “strength of the income statement” being overwhelmed by the “expansion of the cash flow statement and off-balance-sheet commitments,” not a sign of operational cracks in the results themselves.
The 26% growth in advertising, 14% increase in pricing, and Muse’s rapid ramp-up are real; the $9.89 billion in legal expenses was a one-off, and adjusted EPS of $7.40 far exceeded consensus—also real. But the $825 billion in spending commitments, the first negative FCF in 14 years, capital expenditures exceeding operatin
ZEC | Short 🔴 | Bearish | 15m 24h: -5.36% | Volume: 1956.6M USDT Short rationale: Price below EMA200; EMA20/50/200 in bearish alignment; RSI14 at 47.8; MACD histogram negative; ADX14 at 20.1; volume at 0.47 times the 20-candle average; trend pullback/continuation. Entry: 1218.61 Stop loss: 1240.42 Take profit 1: 1191.35 | Take profit 2: 1174.99 | Take profit 3: 1153.18 Entry price is for reference only; do not chase the trade. The trading strategy is invalidated if the stop-loss level is hit. Technical analysis only, not investment advice.$ZE
post-image
ZEC-3.91%
Trenches
Kimchi
K
bade
b
Kimchi
CSoc...pump
Market Cap
$.
Change
.
24h Vol
$.
Holders
.
kimchi
k
bade
b
kimchi
B1Y2...pump
Market Cap
$.
Change
.
24h Vol
$.
Holders
.
AGT
A
bade
b
AGT
0x5d...e274
Market Cap
$.
Change
.
24h Vol
$.
Holders
.
McRib
M
bade
b
McRib
8idE...pump
Market Cap
$.
Change
.
24h Vol
$.
Holders
.
ZIG
Z
bade
b
ZIG
0x8c...1145
Market Cap
$.
Change
.
24h Vol
$.
Holders
.
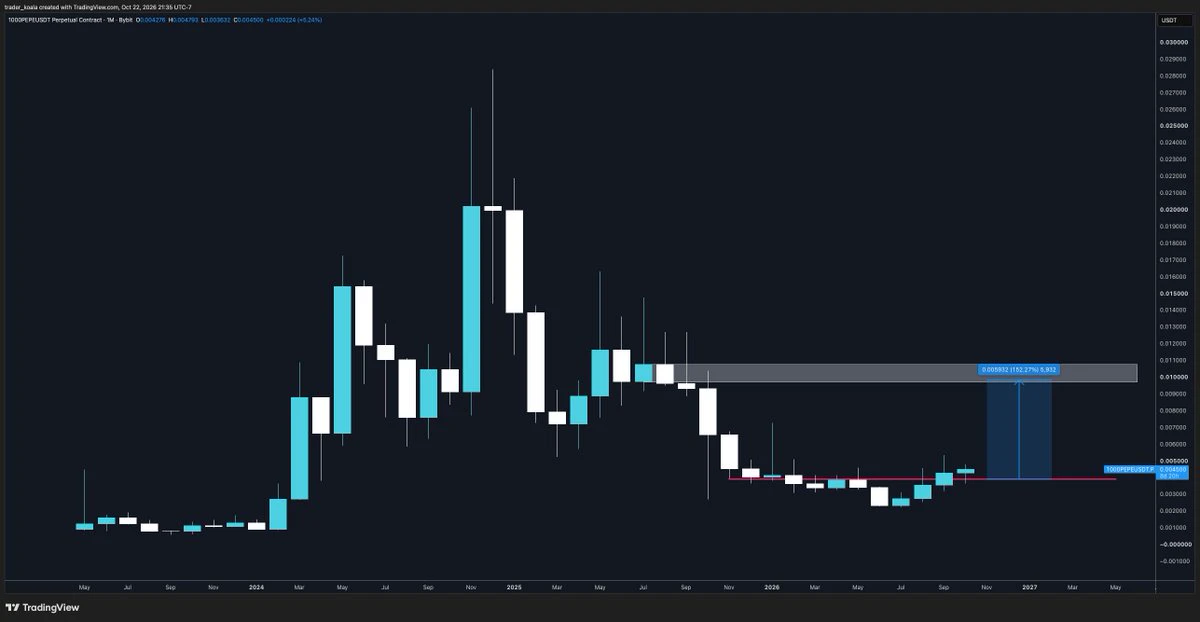
ethereum:0x6982508145454ce325ddbe47a25d4ec3d2311933
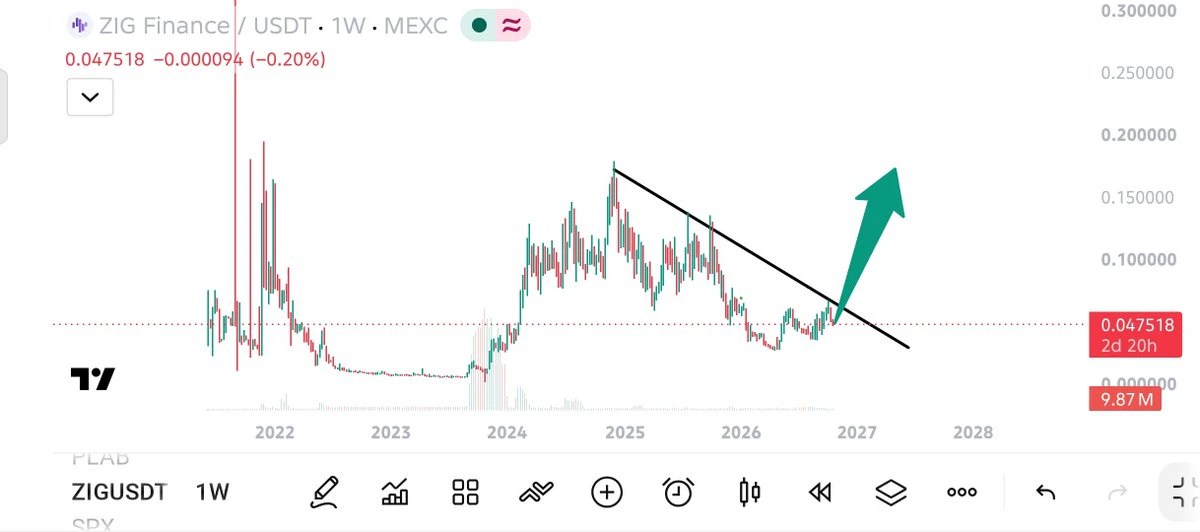
Incredible looking monthly chart
A 2x is a matter of when, not if.
post-image
ETH-1.48%
🇨🇭 SWITZERLAND APPROVES FIRST SPOT BITCOIN ETF!
Swiss regulator FINMA has approved the country’s first spot Bitcoin ETF for public offering.
BIT Asset Management’s ‘BBIT’ fund will trade on the SIX Swiss Exchange in November.
Despite the regulated structure, FINMA issued a caution on Bitcoin’s high volatility.
BTC-1.13%
First Half Revenue Reaches 16.3 billion$ With Future Compute Commitments Potentially Hitting 750bil$
live-cover
LIVE2,046
The 5-star ⭐️ Snow Mountain is seriously fucking hard to run.🚗
If you said you got pregnant from a dream, that’d be more convincing than this 😂.
post-image
Wall Street is starting to question the AI money machine.
The Nasdaq just plunged 2.9%, wiping out $1.2 TRILLION. Nvidia fell 4.4%. AMD crashed over 8%. Meta is burning through cash to fund its AI ambitions.
Fear has hit extreme levels.
Here's the trillion-dollar question nobody wants to answer: What happens if AI spending keeps exploding, but the profits don't?
post-image
NDAQ+7.38%
NVDA-4.31%
AMD-8.12%
MARKET UPDATES
live-cover
LIVE1,749
$ZIG under 100M market Cap is Great opportunity to buy.
Expecting Easy 10x in marketCap in coming months.
Developments are insane.
DYOR.
post-image
ZIG-0.64%
$AKE When dumping, go easy—don't leave the longs stunned
post-image
AKE+49.57%
  • 1
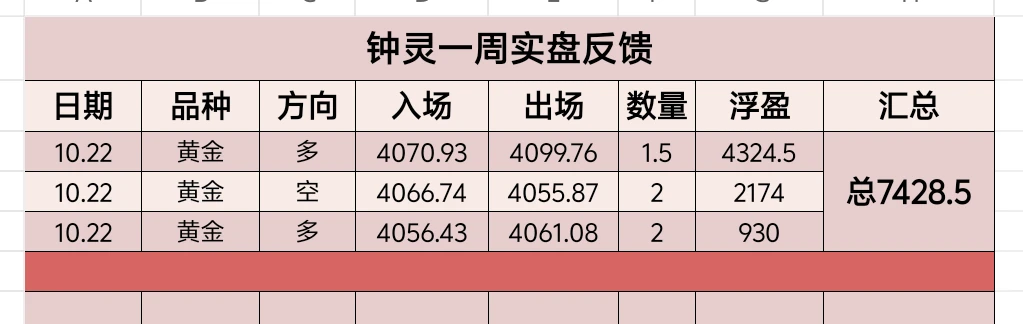
Gold recap for yesterday, Thursday 10.22
Gold long | Entry 4070 | Exit 4099 | Profit: $4,324
Gold short | Entry 4066 | Exit 4055 | Profit: $2,174
Gold long | Entry 4056 | Exit 4061 | Profit: $930
⭕Total profit for the day: $7,428
A cheetah doesn't chase every gazelle that passes by; it waits for the one pounce it's most confident in. Gold can move dozens or even hundreds of points in a day. You don't need to catch every move—just get your share of one stretch.
$XAU #BTC跌破81000美元 #Gate第三季度报告出炉 #韩国KOSPI跌幅扩大至4% #现货黄金跌破$4000
post-image
XAU-1.80%
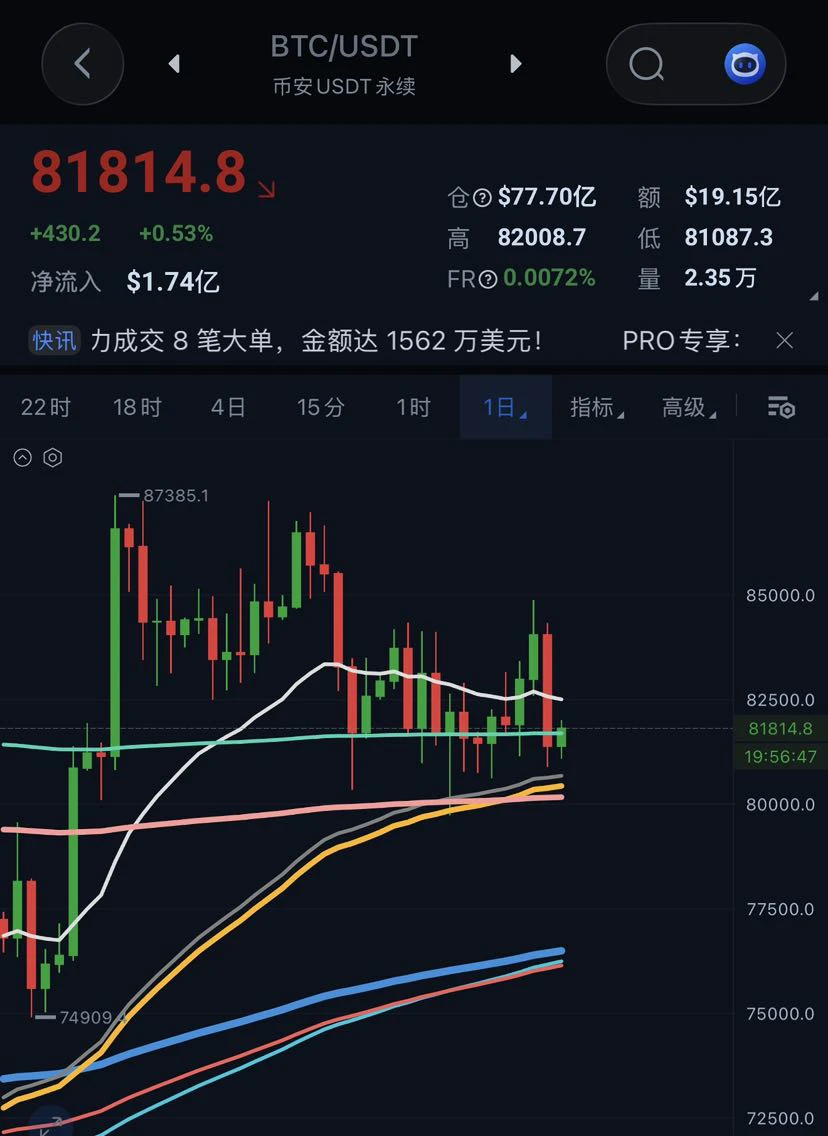
$BTC It has been moving sideways within this range, but it will eventually break out of it. That’s why I’ve said many times that only low leverage and spot can be held through the volatility; high leverage will only get shaken out. $ETH
post-image
BTC-1.13%
ETH-1.48%
  • 4
Great, $MRNA plunged sharply from 254, then gradually recovered. I also caught this rebound and made a little 😍😍😍$ALT $PTB 😍😍😍
post-image
PTB-42.32%
I was out for a walk by the sea and came across someone dancing. I casually filmed it,
but I don’t know what dance she was doing or what the original BGM was.
GrokBot did the edit: removed the original audio, synced it to the beat, and swapped in a new track—all in one go. I originally asked it to pick the music itself. The beat sync was spot-on, but the instrumental track wasn’t quite right; I picked one myself and added it, and it fits pretty well.
GrokBot is fucking useful. If you haven’t tried it yet, get on it.
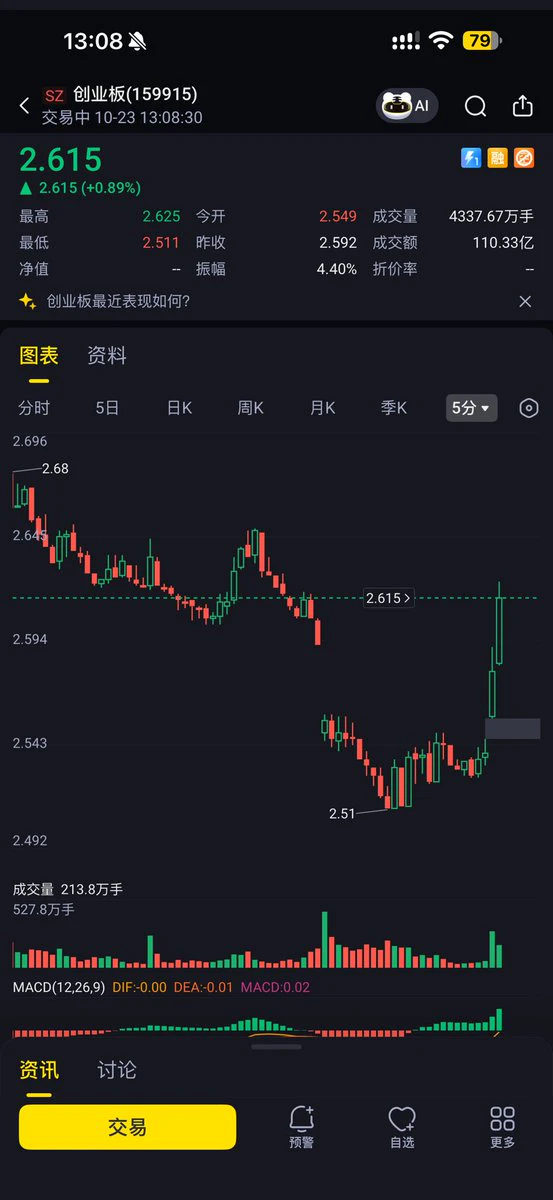
Zhongji Innolight, Eoptolink, TFC Communication, and Accelink Technologies issue announcements jointly.
ChiNext surges sharply— is the A-share market saved? 😲
post-image
Gold $XAU prices have fallen to near 4,000 and are currently around 4,022, testing this key round-number support. During the previous pullback from the highs, prices were repeatedly blocked near the moving averages. They are now trading below several moving averages, and the short-term structure is weak.
4,000 is an important psychological level and a former high-volume trading zone. If prices can stabilize here, it could form interim support; if they break below it decisively, there may be further downside. Trading volume has not expanded noticeably, indicating that selling pressure is still
XAU-1.80%
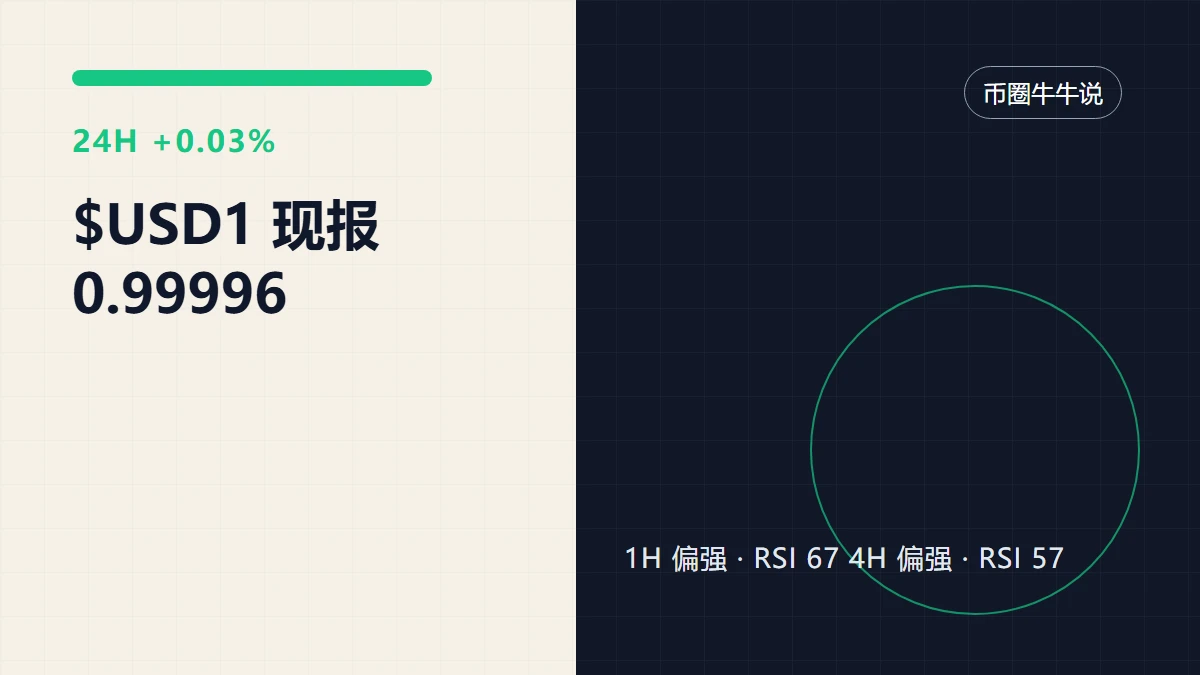
$USD1 24-hour +0.03%, now at 0.99996. The 1-hour chart is slightly strong, and the 4-hour chart is slightly strong. Whether the two charts are saying the same thing matters more than the gainers and losers list. Price-volume alignment is key here. Price shows direction; volume shows participation. When price has already moved but volume is clearly below average, the follow-through of either a breakout or a drop should be viewed with caution. Looking only at candle colors is easy, but price moving and most people being willing to follow are two different things.
Here’s a verifiable update: Gate
post-image
USD1+0.08%
BTC-1.13%
CT | Short 🔴 | Bearish | 15m 24h: -17.30% | Volume: 32.6M USDT Short rationale: Price below EMA200; EMA20/50/200 in bearish alignment; RSI14 at 34.5; MACD histogram negative; ADX14 at 25.8; volume at 0.64x the 20-candle average; trend pullback/continuation. Entry: 0.21586 Stop-loss: 0.231955 Take-profit 1: 0.195741 | Take-profit 2: 0.183669 | Take-profit 3: 0.167574 Entry price is for reference only; do not chase. The strategy is invalidated if the stop-loss level is reached. Technical analysis only; not investment advice.$C
post-image
CT-16.13%
Why might a trading strategy that performs well in historical backtests gradually stop working in live markets?
A beautiful equity curve does not necessarily mean a reliable trading strategy.
In the cryptocurrency market, many traders use historical data to test entry signals, take-profit and stop-loss levels, and position-sizing parameters. But once a strategy is deployed in the market, its win rate may fall, its drawdown may grow, or it may even lose money over the long term.
So where does the problem lie?
I. Historical data is not the same as future markets
Backtesting can only show how a s
post-image
  • 1
Load More

Join 40 M users in our growing community

⚡️ Join 40 M users in the crypto craze discussion

💬 Engage with your favorite top creators

👍 See what interests you

Trending Topics

USEarningsSeason

841 Views2.61k Discussing

The U.S. Q3 earnings season is in full swing, with major tech companies including Tesla and Meta reporting results. Market focus is shifting beyond revenue and profit toward AI spending, capital expenditure, margins and forward guidance. Which company’s earnings are you watching most closely?

GateWCTCS9GlobalTradingCompetition

385.63k Views7.55k Discussing

BTCDropsBelow81000

24.06k Views37.88k Discussing

View More