Share your thoughts
placeholder
Article
The tug-of-war between bulls and bears is intensifying—where will gold go next?
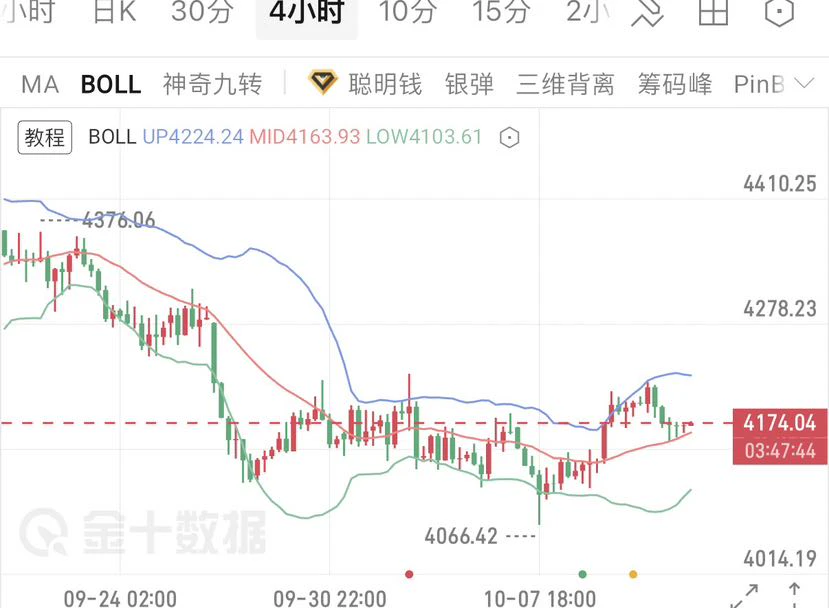
From the daily chart, gold prices have fallen back to trade near the Bollinger Band middle line, which is forming a short-term dividing line between bulls and bears. The RSI is gradually retreating from high levels, bullish momentum has weakened somewhat, and the market has entered a consolidation phase.
On the news front, the market is focused on the Fed’s September interest rate decision. At present, there is considerable disagreement over whether the Fed will raise rates or keep them unchanged in September. U.S.
post-image
XAU-0.03%
$BTC staying above 70k is the best case for altcoins
BTC-0.03%
Sunday Evening Market Updates
live-cover
LIVE2,139
BONK alltime high hype pump pump bigpump ATH let’s go
post-image
BONK+5.28%
PUMP-2.57%
BIGPUMP+5.82%
💰 Don’t let great content earn only likes! Have you activated Gate Social Subscriptions?
Share analysis in the Square or discuss market trends in livestreams—any content can be set as subscriber-only! Market reviews, trading strategies, market observations… Give subscribers access to deeper content while sharing and building a core following!
🔥 Set your own price with 0% revenue share! Activate now: https://www.gate.com/post
📖 Learn more: https://www.gate.com/help/community-center/moments/23369
post-image
  • 11
  • 6
THE COMEBACK WILL BE EPIC
😎😎😎😎😎
post-image
EPIC+6.04%
Damn, this motorcycle is sick.
post-image
My hand trembled slightly when setting the stop-loss a few days ago; this morning I realized that was unnecessary filial piety. While everyone else was running, I watched $BMT ’s position with each upward push: every rebound was weaker than the last, resistance overhead was obvious, and volume failed to follow. This kind of move couldn’t fool anyone.

I went short directly at 0.01906, and by this morning it had already reached 0.01798, with a return of +147.29%. Nothing to brag about—I just followed the market.

I took 80% of the bulk off the table first, and moved the stop-loss on the remai
post-image
BMT-0.28%
BNB-2.44%
BTC-0.05%
BTC returns to $78,000! The market rebounds after finding suppor
live-cover
LIVE1,901
Could it reach 3.6?? #METIS.
Everyone, please don't chase, because I'm in profit.
post-image
METIS+15.22%
This trend doesn’t even require me to think—the account is dancing on its own.
Just took a quick look, and $STONKS has reached 0.012041, with an unrealized profit of +279.81%. This short position was opened during the intraday plunge, when each rebound was weaker than the last and volume failed to follow through—a classic lack of buying support. I shorted around 0.015501 without much hesitation, because the chart had already told you it was going to fall; I was simply following it.
The money you make is the monetization of your understanding; the money you lose is the flaw in your understandi
post-image
STONKS+53.39%
ETH+1.06%
ADA+0.70%
#BTCReclaims80K
BTC Reclaims $80K: Why Dealer Inventory Matters More Than Liquidation Data for Next Move Validation
BTC bounced 5% to $80K amid cooling rate fears and short squeezes. But liquidations are backward-looking; market maker positioning dictates forward flow. The real edge lies in validating whether dealers are long gamma (suppressing volatility) or short gamma (amplifying moves) at this level. Here’s my validation framework. 👇
🔍 Why Inventory Topology Determines True Path of Least Resistance
Gamma Exposure Sign Dictates Volatility Regime: Positive gamma means dealers buy dips/se
BTC-0.03%
#BTC is sitting in a very important middle ground right now: institutional demand is strong, but macro pressure is keeping buyers from comfortably pushing through $82K.
Current Market Snapshot
Bitcoin is trading around $80,000, with the latest available readings showing roughly +0.5% over 24 hours and about $19.1B in 24-hour spot volume.
The bigger picture is more interesting than the small daily move. BTC rallied sharply from the $77K area earlier this week, reached above $82K, and then pulled back toward $80K. The market is now testing whether that breakout can actually develop into another
BTC-0.05%
$MARSCOIN Down 21% in 15 minutes, plunging straight from 0.2697 to 0.1860, with $490 million in volume that is still expanding. This coin is a meat grinder right now, but the bottom created by panic selling is often paradise for short-term hunters.
The Fear and Greed Index on my end has plunged to 12, in the extreme fear zone. Historical data shows that after such levels appear, the probability of a rebound within 24 hours exceeds 70%. The funding rate for $MARSCOIN has turned negative, with shorts paying to short. Such extreme imbalance usually means a reversal is near—it will either be a V-
MARSCOIN-22.11%
Reportedly:
Others generally rate Liangxi’s character fairly positively.
I’m not afraid of how evil or savage anyone is; what I fear most is that they have no money.
When dealing with most people who have no money, promises made → vicious cycle → integrity → trust—nothing can be fulfilled.
post-image
GM if you GM back!
post-image
Nobody’s watching SOL’s 4h death cross—until it hits 102.

$SOL /USDT - SHORT

Trade Plan:
Entry: 106.01 – 106.47
SL: 109.14
TP1: 104.06
TP2: 102.61
TP3: 100.43

Why this setup?
- Price is stalling at 106.24 while 1D stays range-bound—no rescue bid.
- RSI (15m) at 62 looks “strong,” but that’s the last gasp before a 77-confidence short.
- ATR (1h) at 0.93 means the trip to TP2 (102.61) is 3.9x the average candle—clean path, low noise.
- Why now? Entry is live, SL is tight (109.14), and invalidation at 103.08 is far below—room to breathe.

Debate:
Are you fading this 106 pop or waitin
SOL+3.02%
#Gate60MillionUsers
NVDA vs TSLA: Same tech universe, completely different momentum.
The latest session showed a clear split: NVIDIA held firm while Tesla suffered a heavy rejection.
Market Snapshot
$NVDA : $230.36 | +0.84%
• Volume: 135.35M shares
• Day range: $229.63–$234.76
• 52W high: $236.54
$TSLA : $354.08 | -5.92%
• Volume: ~65.0M shares
• Day range: $351.32–$364.69
• 52W range: $297.38–$498.83
Why It Matters
NVIDIA is still being supported by the AI infrastructure narrative. Its latest earnings showed $96B quarterly revenue, up 106% YoY, while guidance pointed to roughly $108B next
TSLA+0.26%
NVDA+0.26%
$LIT broke out a few days ago, but I didn’t chase it directly and waited for a pullback confirmation before entering. The core logic at the time was that after breaking above the key level on heavy volume, it did not quickly fall back below it. Once that level was confirmed, the area above was a vacuum zone. I entered long with a limit order, and the price action was relatively smooth after entry, with no major pullback along the way.

I took partial profits when it rallied to the first target, with roughly 70% of the position closed for around +939.63%. I moved the protection level for the r
post-image
LIT-4.20%
BTC-0.05%
DOGE+1.40%
This trend is so obvious I don’t even need to use my brain—the account is dancing on its own. A few days ago, I took one last look at the market before bed. Those $SOL rebounds were clearly weak: low-volume rises, with every push upward falling just short, and heavy pressure overhead. This wasn’t an advance—it reeked of a bull trap.
I figured: no one would take it higher, so it would eventually come back down. After the market opened, I decisively went long, entering at 104.52. The logic was simple—volume failed to follow through, and the rebound was weak, so no matter how fierce it looked, it
post-image
SOL+3.02%
ADA+0.70%
BNB-2.44%
Load More

Join 40 M users in our growing community

⚡️ Join 40 M users in the crypto craze discussion

💬 Engage with your favorite top creators

👍 See what interests you

View More