






Square
Following
Hot
News
Notifications
Profile
Share your thoughts
placeholder
Article
Amundi, which manages €2,579bn, now has more tokenized assets onchain than BlackRock and its $15.5 trillion: $2,513,837,705 against $2,466,650,508.
Amundi's total rose 23.64% in the past 30 days, with ~$1.8B of it on Stellar.
@Amundi_ENG @StellarOrg
XLM-0.64%
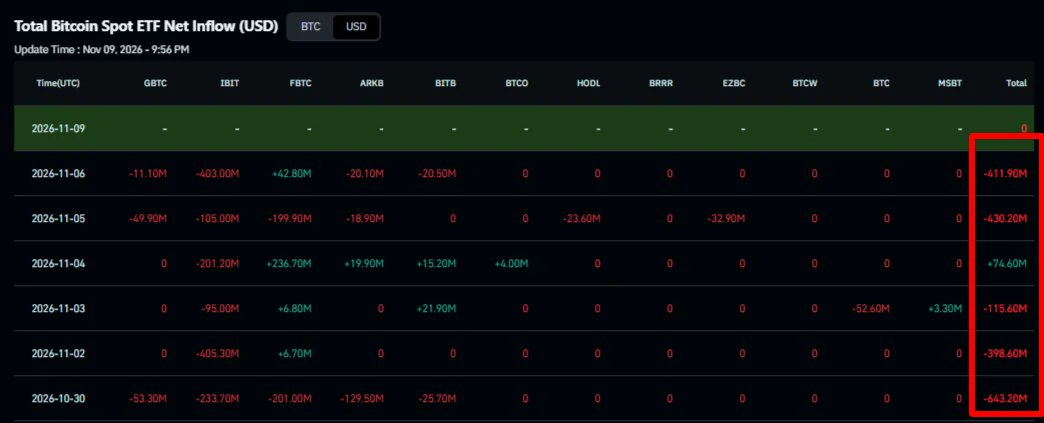
$BTC spot ETFs have recorded nearly $1.92B in net outflows over the last 6 trading days.
post-image
BTC-1.31%
Trenches
牛逼
牛
bade
b
牛逼
0x96...7777
Market Cap
$.
Change
.
24h Vol
$.
Holders
.
STONK
S
bade
b
STONK
6GmA...UNgx
Market Cap
$.
Change
.
24h Vol
$.
Holders
.
PIEVERSE
P
bade
b
PIEVERSE
0x0e...25a9
Market Cap
$.
Change
.
24h Vol
$.
Holders
.
BTC
B
bade
b
BTC
C5xp...pump
Market Cap
$.
Change
.
24h Vol
$.
Holders
.
ON
O
bade
b
ON
0x0e...1d48
Market Cap
$.
Change
.
24h Vol
$.
Holders
.
$STAMP — Oracle BUG dumped the price by 93% for a WHOLE MINUTE and wiped out my 1x long! 🚨
​Look at this orderbook anomaly: while $STAMP was trading safely at 0.00014, the oracle glitched and locked in a 0.000013 price point right inside the orderbook for about a minute!
​That’s a 13x collapse (−93%) that completely froze and instantly liquidated my 1x LEVERAGE LONG for $2,200. The moment it cleared, the price popped right back to normal!
​Support literally claims: "It's just low liquidity and normal market risks."
​Real traders, look at the screenshot and tell me:
​1. How can a price d
STAMP+52.30%
Cooling Tower Spare Parts: Japanese Manufacturer Cuts Drawing Search Time from Nearly an Hour to 4.5 Minutes
In a customer story released by OpenAI on November 9, 2026, Japanese air-conditioning and ventilation equipment maker Kuken Industries used a search tool built on the OpenAI API to find maintenance drawings in a nearly 70-year archive of cooling tower plans. The time it took field engineers to find the relevant drawing fell from nearly an hour to 4.5 minutes. The company expects to reduce the annual work hours spent “looking for drawings” by about 90%.
【Paper archives took half a day; e
post-image
As of November 10, ETH is trading around $2,130. With a daily decline of 4.36%, it is hovering near the lower bound of its 24-hour range, which spans from $2,065 to $2,227. This movement is not unique to the crypto market; it is intertwined with broader macroeconomic developments that shape global risk appetite.

Market attention is currently focused on the U.S. inflation data for October, due to be released on Tuesday. This figure is critical as it serves as the final inflation reading before the Federal Reserve’s meeting on December 8–9. Following strong employment data released last week, t
ETH-1.26%
Democrats Sweep Congress: Is a Major Shift Coming for Crypto? Tighter SEC Oversight and Prediction M
live-cover
LIVE85
MARKET UPDATE
live-cover
LIVE13
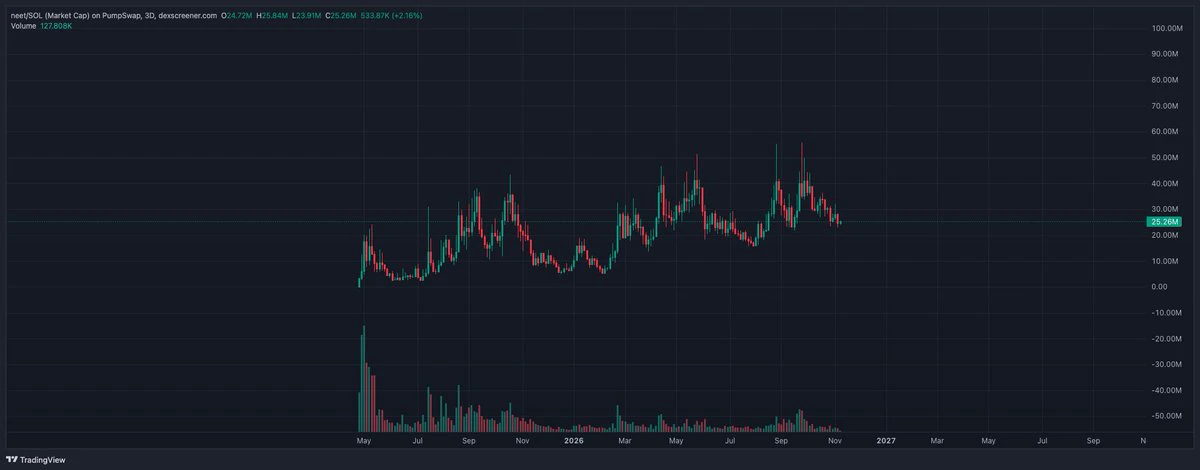
Tempted to reposition back into solana:Ce2gx9KGXJ6C9Mp5b5x1sn9Mg87JwEbrQby4Zqo3pump because the word is starting to get viral with unemployment tiktoks and reels it could run hard on second wave of onchain memes. + chart is unbelievably strong considering it launched last year April. Is this a good decision? I really believe so tbh.
post-image
SOL-0.77%
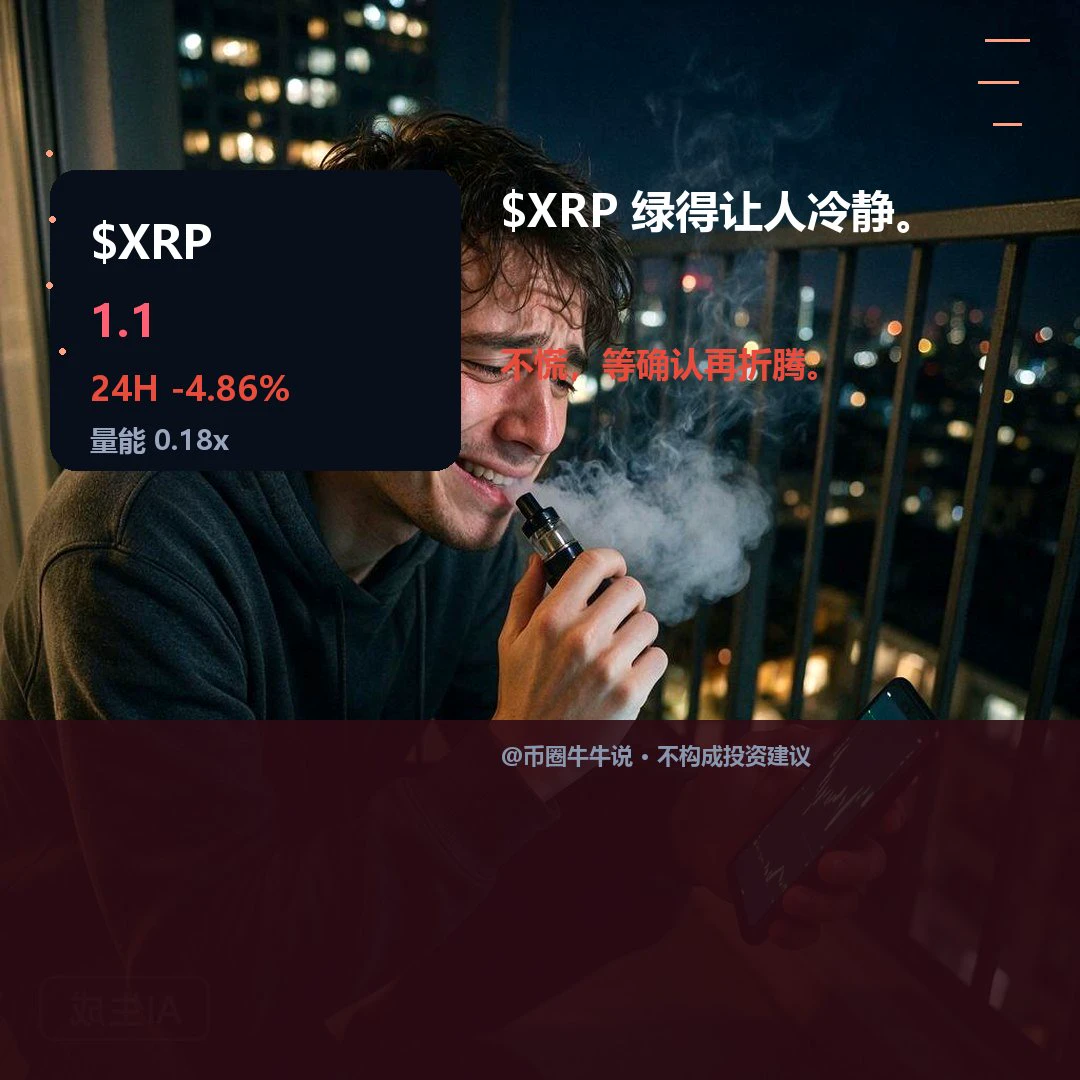
$XRP Currently at 1.0957, down 4.86% over 24H. The 1H and 4H charts are both weak; the 4H RSI is oversold, and moving averages are acting as resistance. Volume is only 0.18x. Holding above 1.1542 could signal a rebound; a break below 1.0764 would indicate further weakness. In review, watch for a failed hold above 1.1542 and a reclaim of 1.0764, with volume confirmation. Market volatility is high; for observation only.
post-image
XRP-1.15%
Markets: Latest Update and Technical Analysis ✅️
post-image
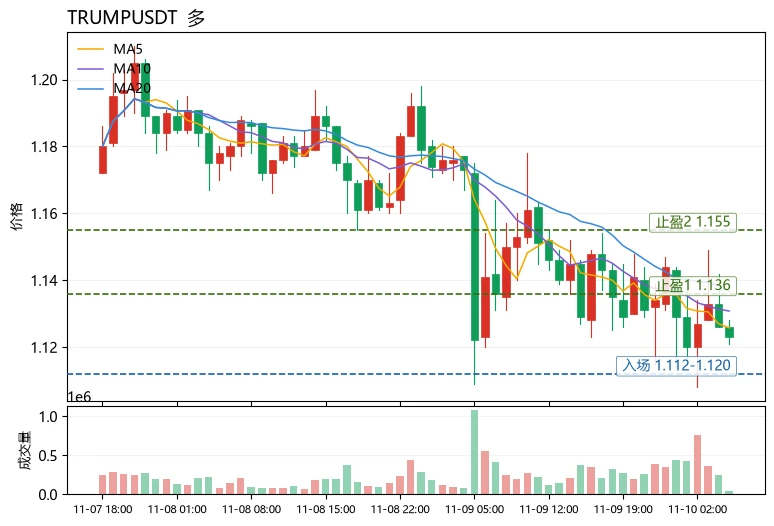
$TRUMP Short-term outlook is bullish, with the funding rate as the key signal. The current price is 1.123, down 3.94% over 24h, while the funding rate is -0.0253%. Shorts are continuously paying to hold their positions, indicating that the decline is driven by both long position reductions and shorts chasing the move, rather than being led by new short positions. The price is above the Bollinger lower band at 1.116. Although MA5 at 1.1258 is below MA20 at 1.1368, the MACD histogram has turned positive, RSI at 41.8 is approaching oversold territory, and the Fear and Greed Index is at 29, in fe
post-image
TRUMP-0.95%
XPL-0.60%
UNI+3.05%
Shorted $CL when the price cleanly broke below 87.0 and selling pressure intensified. The result was excellent, with a 52% gain. 🎯 ⚡Profit: $ 151 Add these assets to my watchlist:

$TST and $ETH .
post-image
TST
TSTTestToken
Pump.Fun
MC:$2.41KHolders:2
26.08%
CL-1.83%
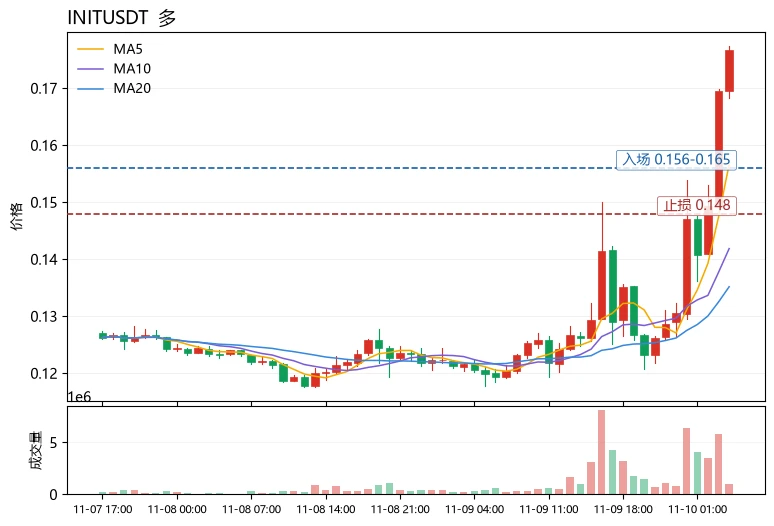
$INIT Short-term bias is bullish, but only suitable for buying pullbacks—not chasing highs. The Fear & Greed Index is just 29, with the broader market in the “Fear” zone. BTC has provided no strong catalyst, so capital is leaning more toward sector rotation; INIT’s 24h gain of +44.31% is a typical strong catch-up move. High-beta coins tend to outperform early in a sentiment recovery, but pullbacks can also be swift when sentiment is fragile. Technically, MA5=0.156664 has crossed above MA20=0.135168, forming a bullish alignment. The MACD histogram at +0.004725 shows momentum is still intact, b
post-image
SPCXB
SPCXBSpaceX
Four.meme
MC:$3.12KHolders:2
0%
INIT-2.53%
never thought i'd miss this guy
post-image
Getting back active on pump , my stats looking good
Always focus quality over quantity to make sure we eat
Looking to add a few to my group as well
post-image
Rapid technological advancements are constantly reshaping the digital asset landscape and creating unprecedented opportunities for intelligent investors. Identifying networks that solve real world problems through innovative infrastructure remains the ultimate strategy for building generational wealth.
The $PIEVERSE ecosystem brings artificial intelligence directly into the hands of everyday users through autonomous agents. By integrating secure wallets seamlessly into popular messaging applications this project creates a massive bridge between traditional communication and Web3 utility. Empo
post-image
PIEVERSE+0.58%
INIT-2.53%
EDGE-7.65%
  • 2
  • 2
$BR /USDT LONG SETUP BREAKOUT OFF THE BASE

$BR /USDT

Direction: LONG

Entry: 0.4601

Stop Loss: 0.4390

Targets
TP1: 0.4759
TP2: 0.4865
TP3: 0.5023

$BR ‌
BR+6.26%
Nvidia is about to report earnings, with the results due after the U.S. market closes on November 17. Revenue more than doubled year over year last quarter, growing 106%, and this time its guidance comes in at $108 billion. With Blackwell shipments continuing, another record isn’t out of the question. Honestly, this scale is pretty incredible.

But rather than marveling at that $100 billion figure, I’d rather hash out three questions with friends in the community.
First, $NVD —can it still be considered a chip company? I’m inclined to say no. From GPUs to networking and a complete computing sy
post-image
NVDA-4.34%
🌈 Gate Live Livestream Inspiration - November 9

Hot Topic Recommendations:
🔹Sudden flash crash before BTC’s weekly close! A wick down to $73,510, with $715 million in long positions liquidated in 1 hour—who’s dumping?
🔹Democrats sweep the US Congress. Is the crypto industry in for a shake-up? SEC regulatory authority and prediction market rules could both tighten—who will be hit first?
🔹AI stocks plunge, but tech giants are insisting that demand hasn’t disappeared! Is this round of AI selling an overreaction driven by panic, or has the bubble burst?
🔹South Korea’s 5,000-point stock-marke
post-image
GateLiveChinese
🌈 Gate Live Livestream Inspiration - November 9

Hot Topic Recommendations:
🔹Sudden flash crash before BTC’s weekly close! A wick down to $73,510, with $715 million in long positions liquidated in 1 hour—who’s dumping?
🔹Democrats sweep the US Congress. Is the crypto industry in for a shake-up? SEC regulatory authority and prediction market rules could both tighten—who will be hit first?
🔹AI stocks plunge, but tech giants are insisting that demand hasn’t disappeared! Is this round of AI selling an overreaction driven by panic, or has the bubble burst?
🔹South Korea’s 5,000-point stock-market level is under threat! KOSPI remains under pressure after opening lower. How much longer will Asian tech stocks keep falling?
🔹Apple is also stepping up its AI arms race! The CEO is personally urging the software team, and Siri is no longer the focus. What’s the next AI trump card?
🔹Gold breaks above $4,100! Safe-haven funds continue to pour in. How high could gold’s next target be?
🔹Jensen Huang embroiled in personal controversy, with Nvidia down over 2% in after-hours trading! Trump publicly backs him. Will this turmoil affect Nvidia’s stock price and market confidence?

Go live with any topic for a chance to be featured on the official website homepage!
🔥 More topic inspiration and tips: https://www.gate.com/help/community-center/live_chat/49345

repost-content-media
BTC-0.65%
NVDA-4.34%
AAPL+2.37%
XAU+0.38%
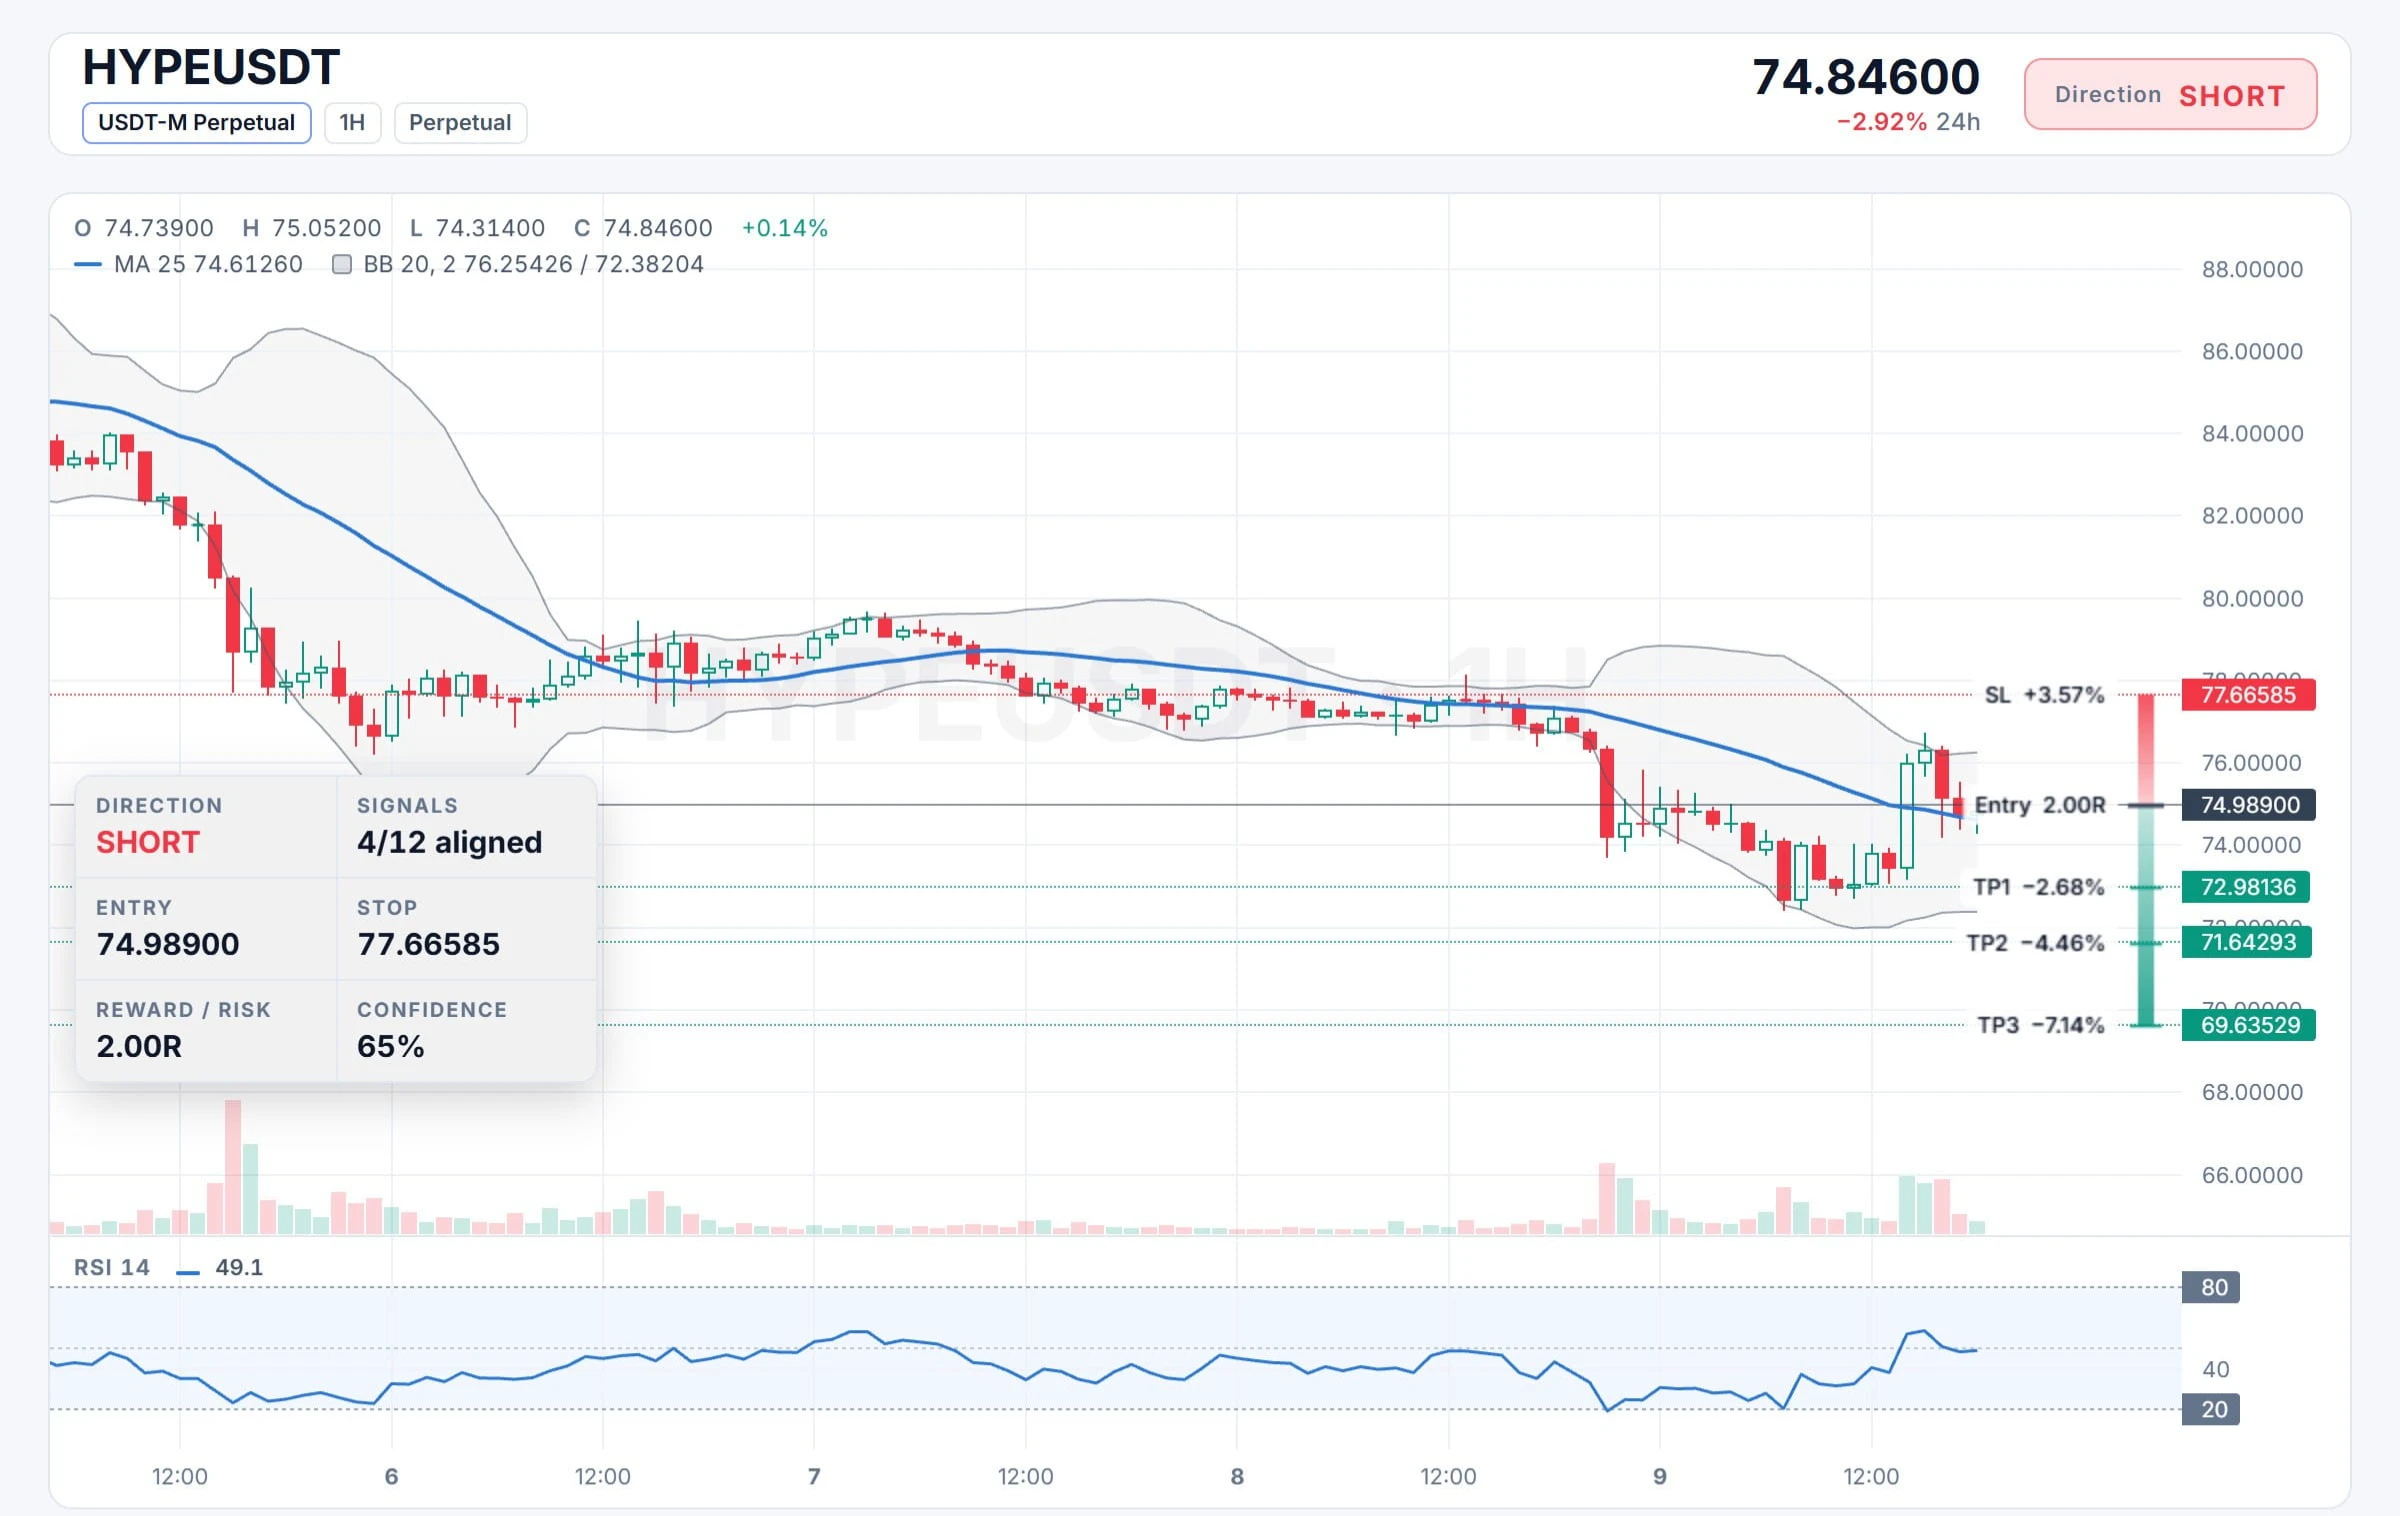
Bulls Are Trapped: $HYPE USDT Short Setup Is Ready to Launch

$HYPE /USDT

Trade Direction: SHORT

Entry Range: 74.98900

Take-Profit Targets
🔹 TP1: 72.98136
🔹 TP2: 71.64293
🔹 TP3: 69.63529

🛑 Stop-Loss: 77.66585

$HYPE ‌
post-image
HYPE+0.33%
Load More

Join 40 M users in our growing community

⚡️ Join 40 M users in the crypto craze discussion

💬 Engage with your favorite top creators

👍 See what interests you

Trending Topics

USCPIDataIncoming

44.29k Views2.03k Discussing

The U.S. October CPI report will be released on November 10 at 8:30 a.m. ET. September CPI came in at 3.7% year over year, and markets will be watching closely for signs that inflation is cooling, especially in core CPI. A softer-than-expected reading could strengthen rate-cut expectations, while hotter inflation may pressure risk assets through higher Treasury yields and a stronger dollar. How do you think this CPI print will move $BTC, U.S. stocks and gold?

RedBullDoublePodiumInBrazil

9.98k Views30.59k Discussing

BTCFlashCrash

220.49k Views66.6k Discussing

View More