





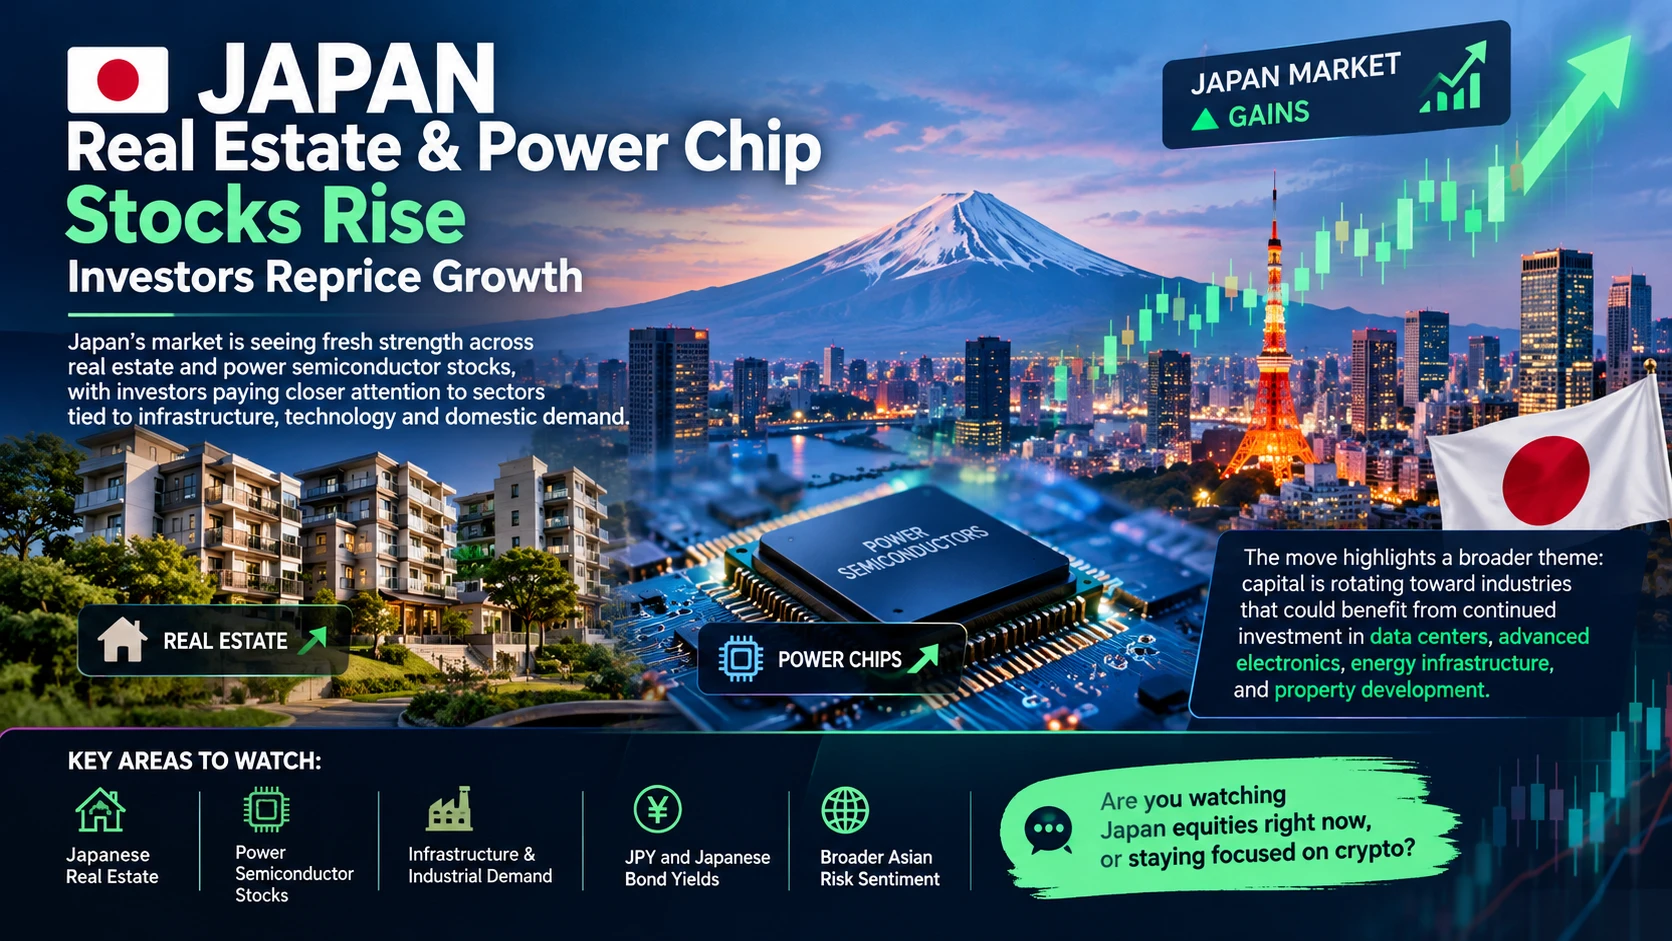
#日股地产电力半导体板块走强 #Gate广场中秋团圆局 Sector outlook after Japan stocks’ rate hike: Semiconductors > Electricity > Real Estate
In an environment where “the Bank of Japan raises rates to 1.25% and clearly indicates it will continue raising them,” the potential ranking of the three sectors is: Semiconductors > Electricity > Real Estate.
Semiconductors: least sensitive to domestic interest rates, driven by the global AI cycle and yen depreciation, with the strongest structural momentum;
Electricity: rate hikes are a headwind, but it has independent profit drivers from rising electricity prices + nuclear restarts, making it the “stable” option;
Real estate: the most direct victim of rate hikes, with both financing costs and discount rates rising; it led the decline at today’s close.
Market interpretation
The Nikkei 225 closed up 1.38% at 65,018.95 points, with semiconductors clearly taking center stage: the Nikkei Semiconductor Index was up 2.88% intraday, Tokyo Electron closed up 4.2% (53,110 yen), SoftBank Group rose more than 5%, Advantest gained 4.7%, and Kioxia rose 3.5%, driven by a broad rally in U.S. chip stocks overnight (the Philadelphia Semiconductor Index +3.14%, Arm +8%, Intel +7%). However, the real estate sector closed down 1.40%, while electrical equipment rose 2.69%—the supposed “rally across all three sectors” did not materialize in the closing data, as real estate has already weakened first.
Rate-hike background: this is not an isolated rate hike
The Bank of Japan today raised its policy rate from 1.0% to 1.25%, the highest since 1995 (31 years), with a 7–2 vote; this was the second rate hike in three months since June, and the shortest interval between hikes since 1990, described as the “fastest tightening pace in 36 years.” Governor Kazuo Ueda clearly indicated that rate hikes will continue and did not rule out consecutive large hikes. The rate hike came against a backdrop of inflation being pushed up by rising oil prices and yen depreciation, while the yen instead fell after the hike—indicating that the market believes Japanese interest rates remain well below those in the United States. The Federal Reserve is also in a rate-hike cycle, having just raised rates by 25 bp on the 17th.
The key is not that rates were raised by “25 bp today,” but the direction and speed of rate increases—which transmit completely differently to the three sectors.
Semiconductors: least sensitive, strongest structural momentum (highest potential)
The rallying logic is “global,” not “Japanese interest rates”: the AI capital expenditure cycle + export earnings benefiting from yen depreciation + linkage to U.S. chip stocks. The Nikkei Semiconductor Index is up 48.4% over the past three months and 40.8% year to date, far exceeding the Nikkei 225’s corresponding gains of 17.1% / 16.9%.
Limited impact from rate hikes: higher rates weigh on valuations, but this is offset by strong earnings growth; domestic rate hikes do not alter global AI demand;
Risks: expensive valuations and high volatility (on September 17, it opened high but fell throughout the session, with Tokyo Electron at one point down 2%), as well as heavy dependence on U.S. market sentiment.
Electricity: rate-hike headwinds, but independent profit drivers (second-highest potential)
Headwind: electricity companies are highly leveraged, bond-like assets; higher rates raise financing costs and also pressure valuations;
But this round has a clear profit-improvement logic: due to disruptions to shipping through the Strait of Hormuz, LNG costs have surged (LNG accounts for approximately 30% of Japan’s power-generation fuel), and Japan’s wholesale electricity prices are expected to rise approximately 40% year over year in the second half of 2026; some regions have already planned to raise retail electricity prices starting in November; Tokyo Electric Power’s September fuel-cost adjustment unit price has already risen significantly from August.
Nuclear restarts are also improving the cost structure. Electricity is essentially an “inflation beneficiary + defensive” sector; earnings improvement is relatively certain, but its upside is less pronounced than that of semiconductors, making it a steady allocation.
Real estate: the most direct victim of rate hikes (third-highest potential)
The transmission mechanism is the most direct: higher financing costs, rising risk-free rates weighing on REIT valuations, and higher mortgage rates suppressing demand. Japanese asset managers have explicitly judged that J-REITs and real estate developers face direct headwinds from rising financing costs and bond yields;
The market is already pricing this in: the J-REIT market fell 3.69% month over month in August, and Nomura also pointed out that REITs declined against a backdrop of rising interest rates (although rental earnings are still improving);
Note: physical property prices in Tokyo are still rising (foreign capital is snapping up properties in prime areas); that is the physical asset market, whereas real estate stocks/REITs in the equity market are priced based on “interest-rate discounting”—the logic is the opposite. If Ueda continues raising rates, real estate will be the hardest hit of the three sectors.
On the “style rotation” discussion
The real beneficiaries of rate hikes are the financial sector (wider net interest margins for banks and higher investment returns for insurers). The Nikkei has already launched a Top 10 bank-stock index in response to rising interest rates. The style rotation being discussed by the market is more likely to be a rebalancing from “AI semiconductors → financials/value” than a turn toward real estate. Even if style rotation occurs, semiconductors are merely taking a short-term breather; the AI theme is not over. Real estate, meanwhile, is the least likely of the three to become the successor.$JPN225
In an environment where “the Bank of Japan raises rates to 1.25% and clearly indicates it will continue raising them,” the potential ranking of the three sectors is: Semiconductors > Electricity > Real Estate.
Semiconductors: least sensitive to domestic interest rates, driven by the global AI cycle and yen depreciation, with the strongest structural momentum;
Electricity: rate hikes are a headwind, but it has independent profit drivers from rising electricity prices + nuclear restarts, making it the “stable” option;
Real estate: the most direct victim of rate hikes, with both financing costs and discount rates rising; it led the decline at today’s close.
Market interpretation
The Nikkei 225 closed up 1.38% at 65,018.95 points, with semiconductors clearly taking center stage: the Nikkei Semiconductor Index was up 2.88% intraday, Tokyo Electron closed up 4.2% (53,110 yen), SoftBank Group rose more than 5%, Advantest gained 4.7%, and Kioxia rose 3.5%, driven by a broad rally in U.S. chip stocks overnight (the Philadelphia Semiconductor Index +3.14%, Arm +8%, Intel +7%). However, the real estate sector closed down 1.40%, while electrical equipment rose 2.69%—the supposed “rally across all three sectors” did not materialize in the closing data, as real estate has already weakened first.
Rate-hike background: this is not an isolated rate hike
The Bank of Japan today raised its policy rate from 1.0% to 1.25%, the highest since 1995 (31 years), with a 7–2 vote; this was the second rate hike in three months since June, and the shortest interval between hikes since 1990, described as the “fastest tightening pace in 36 years.” Governor Kazuo Ueda clearly indicated that rate hikes will continue and did not rule out consecutive large hikes. The rate hike came against a backdrop of inflation being pushed up by rising oil prices and yen depreciation, while the yen instead fell after the hike—indicating that the market believes Japanese interest rates remain well below those in the United States. The Federal Reserve is also in a rate-hike cycle, having just raised rates by 25 bp on the 17th.
The key is not that rates were raised by “25 bp today,” but the direction and speed of rate increases—which transmit completely differently to the three sectors.
Semiconductors: least sensitive, strongest structural momentum (highest potential)
The rallying logic is “global,” not “Japanese interest rates”: the AI capital expenditure cycle + export earnings benefiting from yen depreciation + linkage to U.S. chip stocks. The Nikkei Semiconductor Index is up 48.4% over the past three months and 40.8% year to date, far exceeding the Nikkei 225’s corresponding gains of 17.1% / 16.9%.
Limited impact from rate hikes: higher rates weigh on valuations, but this is offset by strong earnings growth; domestic rate hikes do not alter global AI demand;
Risks: expensive valuations and high volatility (on September 17, it opened high but fell throughout the session, with Tokyo Electron at one point down 2%), as well as heavy dependence on U.S. market sentiment.
Electricity: rate-hike headwinds, but independent profit drivers (second-highest potential)
Headwind: electricity companies are highly leveraged, bond-like assets; higher rates raise financing costs and also pressure valuations;
But this round has a clear profit-improvement logic: due to disruptions to shipping through the Strait of Hormuz, LNG costs have surged (LNG accounts for approximately 30% of Japan’s power-generation fuel), and Japan’s wholesale electricity prices are expected to rise approximately 40% year over year in the second half of 2026; some regions have already planned to raise retail electricity prices starting in November; Tokyo Electric Power’s September fuel-cost adjustment unit price has already risen significantly from August.
Nuclear restarts are also improving the cost structure. Electricity is essentially an “inflation beneficiary + defensive” sector; earnings improvement is relatively certain, but its upside is less pronounced than that of semiconductors, making it a steady allocation.
Real estate: the most direct victim of rate hikes (third-highest potential)
The transmission mechanism is the most direct: higher financing costs, rising risk-free rates weighing on REIT valuations, and higher mortgage rates suppressing demand. Japanese asset managers have explicitly judged that J-REITs and real estate developers face direct headwinds from rising financing costs and bond yields;
The market is already pricing this in: the J-REIT market fell 3.69% month over month in August, and Nomura also pointed out that REITs declined against a backdrop of rising interest rates (although rental earnings are still improving);
Note: physical property prices in Tokyo are still rising (foreign capital is snapping up properties in prime areas); that is the physical asset market, whereas real estate stocks/REITs in the equity market are priced based on “interest-rate discounting”—the logic is the opposite. If Ueda continues raising rates, real estate will be the hardest hit of the three sectors.
On the “style rotation” discussion
The real beneficiaries of rate hikes are the financial sector (wider net interest margins for banks and higher investment returns for insurers). The Nikkei has already launched a Top 10 bank-stock index in response to rising interest rates. The style rotation being discussed by the market is more likely to be a rebalancing from “AI semiconductors → financials/value” than a turn toward real estate. Even if style rotation occurs, semiconductors are merely taking a short-term breather; the AI theme is not over. Real estate, meanwhile, is the least likely of the three to become the successor.$JPN225