






Square
Following
Hot
News
Profile
Share your thoughts
placeholder
Article
#WarshIMFSpeech 📊 100% Win! Gate Square “Share Weekly” Special Topic is Ongoing!........
Post with hashtags for red packets, Up to 100 USDT weekly !
How to Join.......
1️⃣ Register: https://www.gate.com/campaigns/6244......
2️⃣ Post with #ShareWeekly and WarshIMFSpeech......
💬 Topic
Fed Chair Kevin Warsh speaks at an IMF fireside chat today. With inflation pressures rising, markets are watching for policy signals and their impact on the USD, stocks, and BTC.
💡 Discussion
1️⃣ Will Warsh sound hawkish or dovish? Could the Fed hike rates again?
2️⃣ How will his remarks impact BTC? Rally or pul
TSLA-2.17%
$2 won’t make you rich. 72 good trades might.
Start with $2 USDT. Make 20% on a trade and reinvest it:
10 trades → $12
30 trades → $475
50 trades → $18,000
72 trades → $1,000,000+
At 30% per trade, you get there in 51.
Look at trade 30. That’s when $2 stops feeling like a joke and starts looking like a real account.
Nobody posts their $2 day. Everyone waits until the account looks impressive. I’d rather show the beginning.
Every big account was small once. Day 1 was never the problem. Quitting before Day 30 was.
So this is my challenge. $2. One setup. Every trade written down, wins and losses.
post-image
Trenches
AGT
A
bade
b
AGT
0x5d...e274
Market Cap
$.
Change
.
24h Vol
$
Holders
.
CNPY
C
bade
b
CNPY
0xc6...ddd2
Market Cap
$.
Change
.
24h Vol
$.
Holders
.
Q
Q
bade
b
Q
0xc0...0589
Market Cap
$.
Change
.
24h Vol
$.
Holders
.
Gato
G
bade
b
Gato
55A3...pump
Market Cap
$.
Change
.
24h Vol
$.
Holders
.
FTR
F
bade
b
FTR
DFMt...pump
Market Cap
$.
Change
.
24h Vol
$.
Holders
.
#DOGE #WCTCS9 Dogecoin May See Its First Major Daily Death Cross of 2026: Is a Potential Trend Reversal Coming?
A potential trend reversal could offset bearish pressure and invalidate the current pattern.
Dogecoin could see its first daily death cross of 2026 as moving averages suggest they will converge in the coming days. The daily 50-day moving average is currently trending downward, while the daily 200-day moving average is flattening, highlighting the potential for a death cross. Dogecoin saw its first daily golden cross since 2026 in October, but profit-taking in the crypto market drove
post-image
ThisIsTranslateContent:
#DOGE #WCTCS9 Dogecoin may see its first major daily death cross of 2026: Is a potential trend shift approaching?
A potential trend shift could counter bearish pressure and invalidate the current setup.
Dogecoin could see its first daily death cross of 2026, as moving averages point to convergence in the coming days. The daily 50-day moving average is currently sloping downward, while the daily 200-day moving average is flattening, highlighting the potential for a death cross. Dogecoin saw its first daily golden cross of 2026 in October, but profit-taking in the crypto market drove its price down to a low of $0.077. Bears seem to be making an aggressive effort to negate this bullish signal, with the possibility of a death cross drawing near.
The timing of a death cross remains uncertain, as a trend shift could counter the bears’ push and invalidate the current pattern. At the time of writing, Dogecoin was up 3.19% over the past 24 hours to $0.081, after briefly selling off as investors weighed higher-than-expected inflation data and the latest remarks on interest rates from Fed Chair Kevin Warsh.
Inflation data released this week was strong: the Producer Price Index released Thursday showed wholesale prices rose 6.3% year over year in September, the biggest increase since 2022. The Consumer Price Index also rose in data released Wednesday. Fed officials responded in September by approving the first rate hike in more than three years; markets expect the Fed to hold rates steady in October and hike again in December.
Could a trend shift be coming? The last time Dogecoin saw a death cross on the daily chart was in November 2025, followed by months of selling until a golden cross appeared recently. This has focused market attention on price action in case a death cross ultimately appears again.
Crypto analyst Ali recently posted a contrarian take on X, sharing three reasons to be bullish on Dogecoin.
First, the TD Sequential indicator has previously marked potential turning points for Dogecoin several times, and this time it issued a buy signal on the daily chart as the price neared $0.081.
Second, URPD data shows that about 36 billion DOGE previously traded near $0.081.
Third, whales appear to be buying near this support level, having accumulated 600 million DOGE since October 12.
If $0.081 holds and Dogecoin rebounds, Ali identifies the $0.16 to $0.17 range as a potential profit-taking zone. $DOGE
repost-content-media
DOGE-2.52%
$AKE — A bullish reversal pattern has formed at a strong support level...
AKE bounced from the $0.02850 support zone, showing signs of a potential bullish reversal. The price is currently trading around $0.02927, and the latest green candle indicates renewed buying interest. If buyers maintain momentum and break through nearby resistance, the market could see a stronger recovery. Entry zone: $0.02900 – $0.02930 Target 1: $0.02950 Target 2: $0.03000 Target 3: $0.03050 Stop-loss: $0.02840
post-image
AKE+0.71%
Lighter's EVM devnet, built with Axiom, is live, letting smart contracts place, modify and cancel orders on its exchange directly. Lighter is backed by Founders Fund, Ribbit Capital and Robinhood.
@Lighter_xyz
post-image
LIT-2.38%
HOOD-4.94%
$XRP bulls, this is your moment to show up
we’ve been printing lower highs and lower lows inside this channel, and price is approaching the area where a reversal could start
reclaim $1.40–$1.45 and the setup going to be more interesting
until then, it’s a potential breakout, not a confirmed one
Wait to plan your juicy R:R ahead
XRP-1.58%
Inflation is basically another tax
post-image
Eth sopr oscillator buy signal
post-image
ETH-1.36%
The most unusual detail in today’s market is that the Fear & Greed Index remains in the greed zone at 55, while $SOXLB plunged 8.58% in a single day. Its current price of 86.5 has fallen straight through the lower Bollinger Band at 90.4088, and its RSI has crashed to the deeply oversold level of 17.5. Broader market sentiment has not turned cold, but this asset has already been abandoned by investors—a classic case of outflows from an individual coin within a sector, rather than systemic risk. With BTC trading flat, this kind of divergence often means selling pressure is nearing its end.
Tech
post-image
BTC-0.52%
i clicked out after 100% but queue let me run it to almost 2x
gud tek
post-image
#USMemoryStocksExtendLosses
#ShareWeekly
US MEMORY STOCKS UNDER PRESSURE: IS THE AI MEMORY BOOM LOSING MOMENTUM OR CREATING A NEW BUYING OPPORTUNITY?
The recent selloff in memory and storage stocks has created a major debate across the technology sector. Micron Technology (MU), SanDisk (SNDK), Western Digital (WDC), and Seagate Technology (STX) are facing renewed selling pressure after an extraordinary rally driven by artificial intelligence infrastructure, data centers, and rising demand for high-performance storage.
However, I believe the most important question is not simply why these sto
MU-5.66%
SNDK-6.90%
WDC-6.91%
STX-7.45%
SK Hynix+0.79%
My friend shorted $AGT , $Q and $BTW today. All three. Same day.
His logic was solid: “It’s already up 65%. It can’t go higher.”
$AGT hit 0.1048 and kept going.
Then he said, “Okay, $Q is up 119%. That’s insane. Now THIS one has to dump.” It printed another green candle while he was typing the order.
By then he was angry, so he went for the third one: “$BTW is only up 34%, there’s still room for a clean short.” The chart made a new high and he made a new lesson.
The funny part is that Q’s funding was negative. Shorts were paying longs to stay in the trade. He literally paid a fee to be wrong
post-image
AGT+66.83%
Q+122.30%
BTW+30.83%
  • 1
Bitcoin Support and Resistance Levels
live-cover
LIVE961
The Magnificent Seven are propping up S&P earnings growth. The earnings data is still there, but this level of concentration is a risk in itself. Once the social media buzz cools, the crowded trade can quickly unwind. After doing this for so long, I’ve learned that position sizing is always more important than getting the direction right. What do you think?
post-image
SPX+5.61%
A huge bearish candle just came down.
If 80K holds, I’m not closing my long. I’m sticking with my bullish view and targeting 90K.
post-image
$APR Down 16% in a day, plunging straight from 0.0478 to 0.0380. It’s now at 0.0399, with 13.7M in trading volume—this isn’t a pullback; someone’s moving out overnight. Here’s the dilemma: is this a golden opportunity or catching a falling knife?
The bullish case: First, the 24-hour low of 0.0380 has been tested twice without breaking, showing signs of short-term support; second, 13.7M in trading volume means liquidity is still there—it’s not a stagnant pool, so you can get in or out; third, after dropping 20% from 0.0478 to 0.0380, most of the short-term panic has likely played out, making a
APR-13.00%
Something doesn't look right. $AVA is currently at 0.3957, up 34.73% in 24 hours, but look at this candle—the low was 0.2810, the high was 0.4226, a 50% swing, with $72.9M in trading volume. This isn't normal turnover; someone's aggressively sweeping up.
Three possibilities: first, someone positioned early in the derivatives market, with spot buying helping push the price up; second, low-priced holders have finished rotating their positions, and the whales are testing the selling pressure above; third, it's a pure sentiment-driven short squeeze, with 24-hour volume piling above $70M as short-
AVA+34.99%
Some things don't need to be seen to be trusted.
Opportunities are reserved for those who are prepared!!!
  • 1
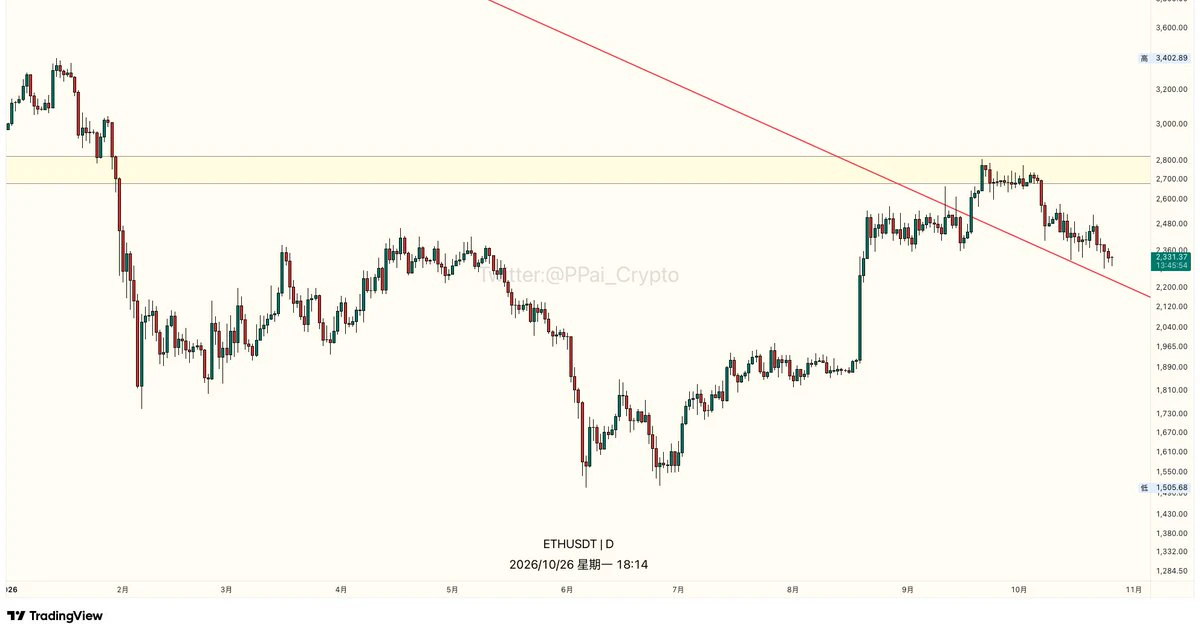
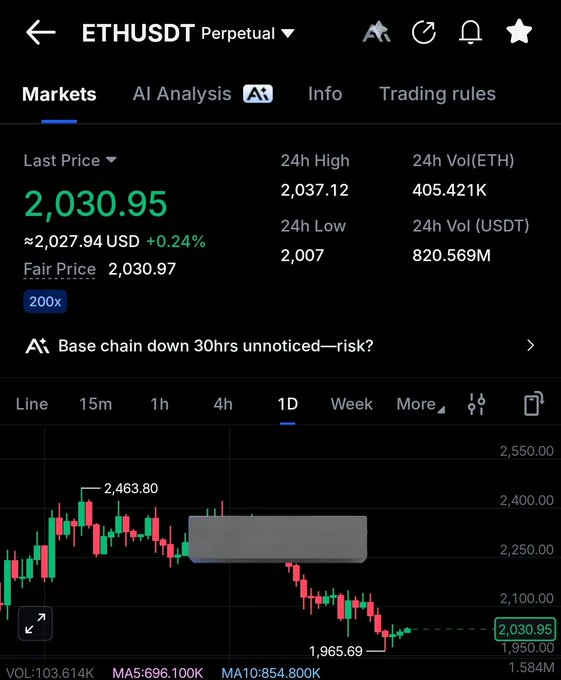
$BTC and $ETH are dumping again.
$120 million worth of longs liquidated in the past 60 minutes.
post-image
BTC-0.52%
ETH-1.36%
  • 7
  • 2
Load More

Join 40 M users in our growing community

⚡️ Join 40 M users in the crypto craze discussion

💬 Engage with your favorite top creators

👍 See what interests you

Trending Topics

USSeptemberPPIBeatsExpectations

91.35k Views1.93k Discussing

US September PPI came in at 6.3% YoY, well above the 5.3% market expectation, pointing to renewed producer-side inflation pressure. Weekly jobless claims were 199K, broadly in line with forecasts. Could hotter inflation further reduce room for rate cuts, and what does it mean for $BTC, US stocks, and gold?

GateWCTCS9GlobalTradingCompetition

37.87k Views6.67k Discussing

GateBTCAndETHFuturesVolumeRanksTop3

53.8k Views1.81k Discussing

View More