Square
Following
Hot
News
Profile
Share your thoughts
placeholder
Article
🎁 I’m truly touched to have received two thoughtful gifts in a row from friends in the industry!
The first was a Blue Box sleep set from @BAI_AGI.
It feels wonderfully comfortable, and amid the busy pace of life, it’s a gentle reminder to get plenty of rest. Thank you, @Anchor9960.
The second came from @NodeXX_cn: a full set of branded merchandise.
T-shirts, cushions, baseball caps, and more were all included—I can really feel how much thought the team put into it. Thank you, @jolin_xyz.
It feels so good to be remembered. In the second half of 2026, we’ll keep moving forward together 💪
Var's points for this week are out—here's how things went this week
My 12M in volume was all from SWAPs and only earned 22 points, nearly 540,000 per point. Last week it was 180,000 per point, and I got over 50 points. Although I earned very few points this week, I basically achieved zero loss
I took a look at everyone's points:
There are users ranging from 120,000 to 700,000 per point. Based on the results I've seen so far, spread is still a very important metric (because when I got 180,000 per point last week, 50% of my volume was RWA)
Although Swaps offer double points and low loss, that's
post-image
SWAP-3.44%
RWA+1.85%
FARM-0.19%
SOL+1.50%
ME+2.73%
They sleep while you build wealth
post-image
$UNITREE What the fuck is going on? The coin over on A is up 4.4%, so how come you're only up 2%? Can someone tell me why this is happening—is this pig slaughtering?
post-image
$JST Short-term bullish, but this is a passive long position following the broader market, not an independently strong trend.
The Fear & Greed Index remains in the greed zone at 63. As long as BTC holds its support, capital is willing to rotate into mid- and small-cap coins, making JST a beneficiary rather than a leader. Technically, MA5=0.13398 is above MA20=0.133663, and the MACD histogram at +0.0005121 remains bullish. RSI=56.3 is neutral to strong, with no overbought pressure. The Bollinger Bands are narrowing to 0.130857–0.13647, and the current price of 0.13595 is near the upper band, in
post-image
BTC+0.76%
WAL-22.91%
web3 developer activity just hit a 5-year low
the builders are leaving?
post-image
The new-generation Roadster has three versions:
🚗Performance: Two seats, street-legal, with an active aerodynamic package and a downforce system; 0–60 mph in under 1.6 seconds. Available by reservation.
🚗Thrust: Two seats, with cold-air thrusters added to the rear; limited release.
🚗Rocket: Single seat, with thrusters all around the body; available by invitation only and not street-legal.
In other words, the versions with thrusters are specifically for demonstrations and cannot be driven on public roads. Ordinary people cannot buy them either.
If this were XPeng Motors, it would be slammed
post-image
XPEV+2.28%
#USSeptemberCPITopsEstimates USSeptemberCPITopsEstimates
The US September CPI report just dropped, and it came in hotter than expected. This report effectively killed any remaining hopes that the Fed would pivot soon.
Headline Inflation: Energy Steals the Show
September CPI rose 3.7% year-over-year, above the expected 3.6% and up from 3.4% in August. Month-over-month, prices climbed 0.6% — the largest single-month jump in five months.
Gasoline was the biggest culprit. The gasoline index surged 9.1% month-over-month, accounting for more than half of the overall CPI increase on its own. The broa
post-image
GAS+2.43%
CME+1.39%
US500+0.22%
NAS100+0.37%
CICC-0.76%
10.16 Morning ZEC Public Strategy
Short Strategy $ZEC
  Entry zone: Light short near the area above 1240-1260 after a pullback
  Stop-loss defense: around 1300 (execute planB after breakout)
Take-profit levels
  First take profit: around 1220
  Second take profit: around 1180 (middle-band level)
Third take profit: around 1140 (dense trading zone)
Fourth target: below 1090 (lower-band support)
Operational factors: The current price is above the Bollinger middle band; the Bollinger Bands show signs of narrowing while moving upward. This rebound has continued with rising
ZEC+8.32%
Jelitics changed his tune? He once said “$SI —sell it all to me,” but now he has sold half at a loss!
Jelitics once publicly stated: “You can sell all your $SI tokens to me.”
But today, he sold half of his $SI holdings at a loss:
· Sold: 21.38M $SI
· Sale value: approximately $279K
· Total invested: $1.4M
· Current loss: $562K
From “buying it all” to “selling half,” $SI whale activity has clearly shifted.
Chart:
post-image
SI+39.22%
$Bull is coming This bull has lost its buzz; even the comments aren’t as lively as before.
post-image
牛来+5.80%
📈October 16 Midday Market Outlook📈
$BTC 观点:
Many bears have been left baffled by this rally, surely wondering why the price suddenly surged when it had been falling just fine.
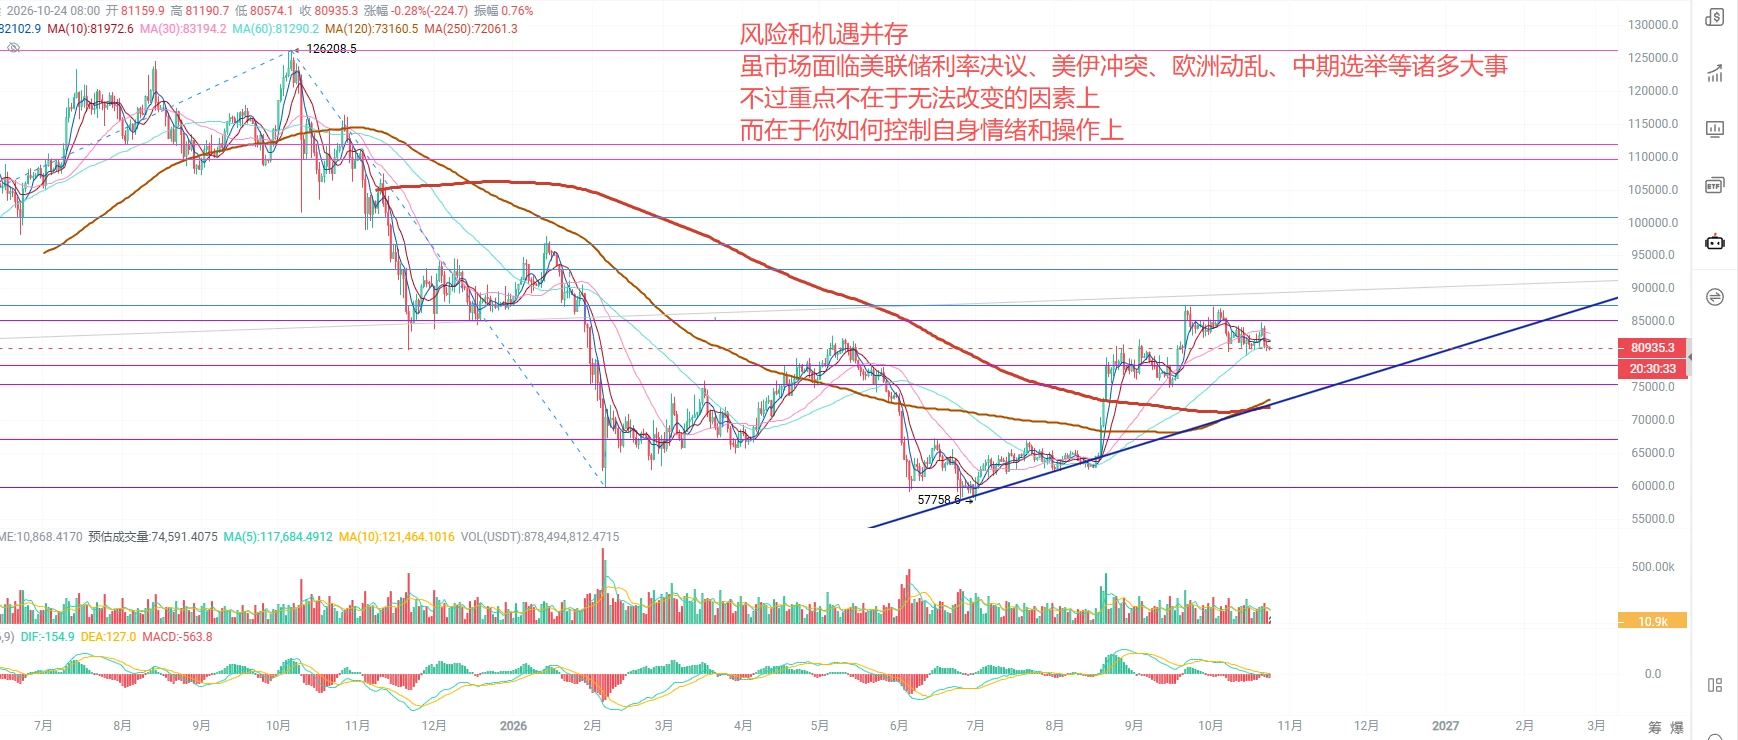
With 80k on the verge of breaking, note that 80k is a very important support level. Even if the price is going to break below it, it won't do so in one go. The first time it reaches 80k, there will definitely be a rebound. If the rebound fails to break above the previous high of 84,300, the price will test the 80k round-number level again.
Last night $BTC I opened a long at 80,600 because there was plenty of lon
BTC+0.72%
Yesterday I shorted three trades and lost on all of them
Still shorting today
🤡
I feel it's moving pretty well
This week's test
Next week, the major bull market begins
post-image
BTC MARKET UPDATE
live-cover
LIVE1,285
KOL take: Ansem remains firmly bullish on BTC! Crypto market confidence has fallen to a ten-year low
live-cover
LIVE2,405
₿ BITCOIN MARKET UPDATE: BULLS VS. BEARS — WHO WILL WIN?
Back to the #Bitcoin market, where bulls and bears seem to be calling each other fools while the price struggles to choose its next direction. 😂🐂🐻
After pulling back, BTC has rebounded near the $80,000 zone, showing encouraging strength on the hourly timeframe. However, a short-term bounce does not necessarily mean the downtrend is over.
📊 Here’s what matters right now:
🔹 First Resistance: The 4H MA200 trendline remains a key hurdle for the bulls.
🔹 Major Resistance: Even if BTC breaks above the MA200, the 4H MA120 near $83,800 cou
post-image
BTC+0.76%
NVDA-1.92%
USDCAD-0.05%
Hammer Bobi October 16, 2026 ETH Market Analysis
Market review: The previously mentioned 2330 and 2300 were successfully bottom-fished
Today's market analysis: A very long lower wick on the daily chart
The market is oscillating around the daily box range of 2325—2517 and 2548
Holding above 2440, 2460, and 2480 targets 2500 and 2540
Historical key levels 2380 and 2400 remain valid
Prioritize going long, with shorting as a supplement; sell high and buy low within the range—do not blindly hold out of conviction
Watch the market if 2400 and 2410 br
ETH+2.57%
The short-term prediction market shows highly unified bullish expectations, with the market essentially ruling out ETH breaking significantly below 2,200.
Odds are extremely low at all levels, leaving no trading upside on the long side.
In an environment with highly consistent bullish sentiment, beware of the risk of a sudden wick-driven pullback. Once the price breaks below 2,300, it could significantly impact this prediction market.
The short-term prediction market shows highly unified bullish expectations, with the market essentially ruling out ETH breaking significantly below 2,200.
Odds a
post-image
ETH+2.57%
  • 1
Came across Tesla and Xiaomi at the same time😂😂
One is flying, while the other is testing whether the suitcase is closed
post-image
$SNDK 5-hour chart is flashing a deeply oversold reading with RSI at 24.6 and price hammering out a long wick just above $1,276—setting up a showdown between relentless bears and bargain-hunting bulls. The current price at $1,369.35 keeps the door open for a quick bounce, but the dominant downtrend warns that rallies may be short-lived. ‌
SNDK+2.02%
Load More

Join 40 M users in our growing community

⚡️ Join 40 M users in the crypto craze discussion

💬 Engage with your favorite top creators

👍 See what interests you

Trending Topics

USSeptemberPPIBeatsExpectations

91.35k Views1.9k Discussing

US September PPI came in at 6.3% YoY, well above the 5.3% market expectation, pointing to renewed producer-side inflation pressure. Weekly jobless claims were 199K, broadly in line with forecasts. Could hotter inflation further reduce room for rate cuts, and what does it mean for $BTC, US stocks, and gold?

GateWCTCS9GlobalTradingCompetition

37.87k Views6.42k Discussing

WarshIMFSpeech

62.4k Views754 Discussing

View More